
Abstract
Introduction
Diabetes is related to different complications, such as nephropathy. In kidneys, the tight junctions (TJ) regulate the paracellular transport of solutes and water. The claudins are the most significant component in the TJ and are expressed throughout the epithelium and modulated permeability.
Objective
To evaluate the antioxidant effect of Jatropha dioica (JD) extract and claudin 2 (CLDN 2) in the kidney of rats with induced diabetes.
Methods
It is an experimental, explanatory, prospective, longitudinal, and analytical study. The effect of hydro-alcoholic extract from JD root on the presence of CLDN 2 in rats with induced diabetes was evaluated. The experiment lasting 21 days, treated 40 rats with and without induced diabetes by an intraperitoneal (IP) injection of alloxan. The study groups were exposed to JD extract at 25, 50, and 100 mg/kg. There was no significant morphological difference in the renal tissue morphology of the treated and control groups.
Conclusion
These results demonstrate that JD extract at 50 mg/kg ameliorated the tubular damage induced by diabetes, and the mechanism might be related to the CLDN2 expression. Finally, JD could also increase total antioxidant capacity to protect the kidney from oxidative stress.
Introduction
Diabetes is a chronic disease characterized by the fact that the pancreas is insufficient to produce insulin due to an autoimmune process, type 1 diabetes (T1D), or the body does not effectively use the insulin secreted by the pancreas, type 2 diabetes (T2D). The elevation of blood glucose manifests in both T1D and T2D. T1D is also referred to as insulin-dependent or juvenile and requires the daily administration of this hormone. It has been postulated that T1D has a genetic origin and cannot be prevented. On the other hand, T2D, also called non-insulin-dependent, occurs in adulthood, represents 90% of diabetes cases, and can be prevented or, in some cases, reversed via treatment. 1 High glucose levels in diabetes cause severe damage and microvascular complications such as retinopathy, heart disease, and neuropathy.2,3 Medicinal plants may be essential in managing blood glucose through different mechanisms. For example, Galega officinalis could be beneficial for treating diabetes and reducing fast blood sugar by improving the serum level of insulin and preventing kidney tissue damage by antioxidant features. 4 G officinalis is known as Galega belonging to the Fabaceae family. It is known to grow in the Middle East and southeastern Europe.4–6 Various reports indicate that G officinalis is useful as an adjuvant treatment for diabetes mellitus, with a known origin from the Middle Ages.4,6 It has been identified that G officinalis contains flavonoids, tannins, saponins, glycosides, resins, and steroids with antioxidant properties. 6
At the renal level, the functions of blood filtration are performed in the glomerular capillaries. There, the reduction of liquid volume and modification of the composition by the phenomenon of tubular resorption and tubular secretion forms the urine that enters the renal pelvis. 7 The glomerular and tubular epithelial cells have as their primary function the handling of organic and inorganic solutes. Therefore, the homeostasis of extracellular fluids depends on their efficient functioning. Renal tight junction proteins (TJ proteins) are involved in paracellular solute and water transport.
These proteins are adhesion complexes that form a continuous belt around the circumference of the cells 8 allowing a good diffusion through the paracellular route that includes TJ proteins located in the apical portion in the epithelial cells. 9 There are different integral proteins, such as claudins and occludins. The claudins are the most abundant proteins, constituting large chains of TJ proteins, and expressed throughout the modulation of epithelial permeability. 10
The TJ proteins are responsible for the size and charge selective conductance properties of paracellular pathways. 11 The ocludins are expressed along the segments of the epithelial tubular nephrons. 12
Diabetic nephropathy (DN) manifests by reduction of the glomerular filtration 13 where creatinine clearance values decrease to values below 60 mL min/1.73 m2. The primary marker of renal damage is a urinary albumin excretion. 14 In addition, the pathogenesis involves various elements, such as decreased nitric oxide production, increased protein kinase activity, overproduction of reactive oxygen species (ROS). Although the generation of free radicals (FRs) is a normal characteristic of cell function, excessive generation or insufficient removal of FRs can cause oxidative stress and lead to injury or destruction of the tissue. There are innate defense mechanisms to counteract the high production of FR or ROS, predominantly the action of enzymes such as catalase, superoxide dismutase, and glutathione peroxidase. 15 On the other hand, Syzygium (S.) aromaticum is a dried flower bud belonging to the Myrtaceae family native to the Moluccas islands in Indonesia, also cultivated on different continents for its gastronomic utility.16,17 Recently, it has been shown that medicinal plant extracts such as S aromaticum exert a protective action on kidney tissue against oxidative damage and decrease urea and creatinine levels, kidney weight, glomerular diameter, and thickness of the glomerular basement membrane. 18 As external help, ascorbic acid, tocopherol, β-carotenes, and other carotenoids, as well as selenium, have been helpful for their complementary antioxidant effect to combat ROS. Likewise, the secondary metabolites present in roots and plants such as curcumin, flavonoids, terpenoids, phenylpropanoids, tannins, coumarins, and lignins capture FRs due to their high metal-reducing and chelating capacity. In addition, these mechanisms neutralize ROS.19,20 It has been proposed that the antioxidants present in medicinal roots such as curcumin could help in the preventive treatment of pathologies such as serum lipoperoxidation and liver and liver diseases. 21
Jatropha dioica (JD) is endemic plant of South United States (Texas) and most of Mexico. It grows in dry and semi-dry climate. This plant belongs to the Kingdom Plantae, the spurge family (Euphorbiaceae) and is commonly known as leatherstem, leatherwood or sangre de drago (“dragon blood” within Spanish speaking area). It owes its common name to the presence of a colorless liquid that changes to red in contact with oxygen. The bush typically grows to the height of 50 to 150 cm.22,23 The presence of terpenoids compounds, flavonoids, reducing sugars and alkaloids are possibly responsible for the antioxidant effect observed using model radical scavenger (1, 1-diphenyl-2-picrylhydrazyl, DPPH) for the root extracts of JD The presence of terpenoid compounds, flavonoids, reducing sugars, and alkaloids has been identified by observing their antioxidant activity that counteracts FRs in JD root extract. 24
In our previous work it was determined that the ethanolic extracts (70%) obtained from JD were not toxic. 25 Similarly, aqueous extracts do not have genotoxic or cytotoxic effect as shown in analysis of micronucleus in mouse peripheral blood. 26 Also, it has been reported that this plant extract exhibits a protective behavior on mouse hepatocytes, renal and medulla bone cells. 27 The JD extracts contain phenolics which are bioactive compounds displaying antioxidant function. 28 In addition, other properties of this plant extracts have also been reported such as an antibiotic, 22 anti-hyperglycemic, 29 and antiviral. 30
Previous research studied the antioxidant properties of the hydroalcoholic extract of JD from the plant, stem, and root aerial parts. We resulted in the latter with the highest quantification of polyphenols. 31 Therefore, this study aimed to evaluate the effect of the hydroalcoholic extract of the JD root on the morphology of renal tissue in diabetic rats. In addition, the immunoreactivity of claudin 2 (CLDN 2) within the same tissue was evaluated since it is believed that the extracts of JD have a protective behavior on the cells.
Materials and Methods
Extract Preparation
The plant material was collected in May 2015 locally in Torreon, Coahuila, Mexico (103°26 33” W and 25°32 40” N). It was cleaned, cut into small pieces, and dried. In an amber jar, 2 g of the dry powdered root of JD was placed in 50 mL of a hydroalcoholic solution containing 75 wt% of water and was stirred for 48 h at room temperature (RT). Then, it was filtered and condensed on a rotary evaporator at low temperatures, and the concentrate was placed in an oven at 60°C until full dryness was achieved. The collected powder was resuspended in water at the required concentrations.
Study Groups
To determine the dose to be administered to the animals, a toxic activity lethality test of the extracts in Artemia salina larvae was carried out in a lethal dose of 2183.84 ppm. At 2183.84 ppm of extract, half of the brine shrimp were exposed to a vegetable test with an LC50 value greater than 1000 ppm. Therefore, this extract is not considered toxic. 32 The concentrations examined were 25, 50, and 100 mg/kg, according to Araujo Espino 2017. 26
In this study, 40 young female Wistar rats, 7 to 8 weeks old, and weighing 180 to 260 g were used. They were maintained at RT (25°C ± 2°), and with 12 h light/darkness cycles. The commercial food and water were ad libitum access. The animals underwent a 7-day adaptation period before starting the treatment. Also, the animals were cared according to the Mexican standard NOM-062-ZOO-1999, after getting the approval from the Bioethics Committee with reference number 01-04-16 of the Faculty of Medicine of the Autonomous University of Coahuila.
Diabetes Induction
The diabetes was induced by an intraperitoneal (IP) injection of alloxan (Sigma)24–26 at 125 mg/kg of weight (0.5 mL/100 g of body weight) by IP. The rats included showed values higher than 200 mgdL−1 of glucose in blood for 14 days. After 2 weeks of being induced to diabetes, without reversing hyperglycemic state, the rats received a dose administration daily of 25, 50, 100 mg/kg−1 extract diluted in purified water, without feeding between 7:00 and 10:00
Glucose was measured with a glucometer (brand: Accu-Chek®). The treated animals that showed fasting glucose levels larger than 250 mg/dL after a period of 14 days were used for the following experiment. Glucose measurements were performed with a glucometer (Accu-Chek Nano Performa®, Roche).
Administration of JD Extract
Two weeks after diabetes induction, and without presenting hypoglycemic shock, the animals were administered daily doses of 25, 50, or 100 mg of extract in purified water/kg weight, in fasting conditions between 7:00 and 10:00
Histopathological Analysis
The kidney tissue was fixed in 10% v/V formalin solution (100 mL of 37%-40% formaldehyde with 900 mL of 0.9% saline solution) to preserve the tissue structure during 48 h. Then, kidney samples were cut crosswise, and processed by the conventional histologic technique: washed in PBS 1X, dehydrated in gradual ethanol solutions, xylene treated to remove the alcohol, and embedded in paraffin blocks. Next, histological slices of 5 to 7 µm thick were obtained with a microtome Leitz 1512®, placed directly in a water bath at 40°C with 0.01% of egg albumin, and dewaxed in an oven at 56°C for 1 h. Most reagents used were purchased from Merck®.
Staining with Hematoxylin and Eosin
Dewaxed sections were placed in xylene, xylene: ethanol solution (1:1), and absolute ethanol; then were rinsed in distilled water and immersed in the hematoxylin according to Harris formula (Golden Bell). Next, the sections were washed (water, acid alcohol, water) and immersed 6 times in eosin solution (Harleco Dade de México S.A.; 0.25% w/V dissolved in ethanol 80% with 0.5% of glacial acetic acid). Following, they were washed according with the next order: ethanol 96°, absolute ethanol, ethanol: xylene solution (1:1), xylene, and finally the sections were mounted in synthetic resin. They were allowed to dry at RT for 48 h. The samples were observed with an Olympus® optical microscope under 40x magnification.
Preparation of Samples by the Technique of Tissue Array
Once the areas of interest were identified in the H&E kidney-stained slides, they were collected from the donor blocks to prepare the tissue arrays according with techniques already described by our research team. 33 Briefly, the tissue cores from the donor blocks were inserted into the perforations made in the acceptor blocks. Later these blocks were placed in the stove to melt the paraffin and to cover the wells. Once the tissue arrays were ready, they were cut by microtomy to 5 µm slices thickness.
Immunohistochemical Method
First, the slides were covered with a 10% poly-L-Lysine adhesive solution (Sigma-Aldrich®) in distilled water for 15 min, then were dried at 56°C, and stored until their use.
For the immunohistochemistry analysis for the detection of CLDN 2, tissue slices of 5 μm were deparaffinized and rehydrated, and immunolabeling was performed according to the manufacturer's protocol. Briefly, slices were incubated for 1 h in a solution of Target Retrieval Solution (TRS) high pH, 1x at 100°C for the antigen recovery, and then slices were washed 3 times in tris-buffered saline + Triton X-100 0.1% (TBST) (TRS and TBST solutions were purchased in Dako Cytomation Inc.). After that, slices were incubated in 3% H2O2 in methanol at RT for 10 min, followed by incubation with 10% horse serum in PBS 1x at 37°C for 30 min. Later, the sections were incubated with monoclonal specific antibody mouse anti-CLDN 2 (MA5-11711, 1:50 dilution, Thermo Scientific Pierce Antibodies) at 4°C overnight. Then, slices were washed 3 times with TBST at RT, and were incubated 1 h with the Mouse and Rabbit specific HRP/DAB/ABC detection system (ab64264 Abcam®) and 3,3′ diaminobenzidine were used to visualize antibody staining. Finally, sections were counterstained with Harris’ hematoxylin (Sigma Chemical Co). For negative controls, primary antibody was omitted, and sections were incubated with TBST alone.
High-resolution digital images were obtained using an Eclipse 50i microscope (Nikon Tokyo Japan) with an NIS-Elements software system. All samples were evaluated by 3 independent specialists in Morphology using previously published criteria. 34
Morphometric Analysis
In this study, a morphometric analysis was performed in the immunolabeling method by light microscopy, at a 40x magnification in 8 representative fields scattered in the preparations as follows. 34
The color parameters, hue distribution, saturation, and luminance were established in the capture software and were the same for all the images obtained. From the images obtained, the brown hue of the positivity to CLDN 2 was manually selected, and the program (with the detection threshold of the control sample pre-calibrated) converted the interval color to grayscale and the other tissue components to white. Then, the processed images were automatically analyzed to determine the percentage of the area and intensity of the density (Int Dent) of elastic fibers in each sample. Quantitative analysis of positive area was performed in triplicate sections using ImageJ v1.51 (NIH). 35
Statistical Analysis
For the analysis of the comparison of weight results, glucose levels, histopathological, and morphometric analysis, a one-way variance analysis (ANOVA) was performed considering a statistical significance value of 95% and to compare the significant differences P < .05. The Student’s t-test for paired samples was used.
Results
A qualitative analysis of flavonoids and triterpenes was performed after pulverization and preparation of the extracts both by the hydroalcoholic route and by infusion, to determine the anatomical area with the highest polyphenol content, whole plant matter registered the presence of flavonoids. In contrast, the triterpenes were not identified in the hydroalcoholic extract of the stem. When quantifying the concentrations of polyphenols in the extracts, statistically significant differences were found (ANOVA: P< .001). The concentration range found in the 4 extracts was from 23.0 to 44.03 µg/mL of ac. gal., with a mean of 35.32 ± 7.85 (95% CI 30.32 to 40.31). The values for the mean and standard deviation (SD) of polyphenol concentration in descending order were EHR > IR > IT > EHT (43.44 ± 0.723; 40.56 ± 0.446; 33.24 ± 1.02; 24.05 ± 0.927 µg/mL ac. gal., respectively). The EHR extract showed the highest concentration of 43.67 ± 0.72 µg/mL ac. gal. (95% CI 41.65 to 45.24) while the EHT extract presented the lowest concentration of 24.05 ± 0.92 µg/mL ac. gal. (95% CI 21.75 to 26.35) (ANOVA P < .0001); therefore, the concentration of polyphenols in EHR is 44.64% higher than that of EHT.
Induction of Diabetes
The diabetes was induced by an IP injection of alloxan (Sigma)24–26 at 125 mg/kg of weight. After 2 weeks, the animals without hypoglycemic shock and fasting glucose levels larger than 250 mg/dL were considered as with diabetes and chosen for the subsequent experiments. In Table 1, the results of rat weight and blood glucose levels are shown. These parameters were determined at the beginning and the end of the experimental treatment period of 21 days. These results show homogeneous glucose values from the beginning to the end of the treatment in all the groups. On the other hand, the weight data in the diabetic group show a significant decrease, with an extract dose of 25 mg/kg (P<.05) is compared with the initial weight. However, with doses of 50 and 100 mg/kg of the extract, weight tended to increase, without and statistical significant difference.
Blood Glucose Levels and Body Weight at the Start and end of Treatment in the Different Groups.

The data are presented as average with standard deviation.
D + E 25mg/kg: diabetes treated with 25 mg/kg of JD extract.
D + E 50 mg/kg: diabetes treated with 50 mg/kg of JD extract.
D + E 100 mg/kg: diabetes treated with 100 mg/kg of JD extract.
*Significant difference P < .05. Student’s t-test paired samples.
Abbreviations: CN, negative control; CD, diabetes control without treatment, only water ad libitum; D VE, diabetic treated with 100 mg/kg of vitamin E; E, extract; O, olive oil.
Determination of Histological Parameters
In the kidney sections of the negative control group, we observed the specific features of the tissue: glomerulus, urinary space, proximal and distal tubules. The structural dimensions of the urinary space, glomerular capillaries, and renal capillaries are shown in Figure 1. No statistically significant differences were observed in the structural dimensions between the study groups. All of these with normal morphological characteristics (Figure 2A). In contrast, in diabetic groups (Figure 2B), diabetic + 25 mg/kg of extract (Figure 2C), diabetic + 50 mg/kg of extract (Figure 2D), diabetic + 100 mg/kg of extract (Figure 2E), single extract (Figure 2F), only olive oil (Figure 2G), and diabetic plus 100 mg/kg of vitamin E (Figure 2H), also no morphological alterations were observed. Only some areas with mild to moderate vascular congestion were observed in a few cases.

Structural dimensions of the urinary space, glomerular capillary, and renal corpuscle. NC: negative control. Kruskal–Wallis test and Dunn's multiple comparisons test and DC group. *P < 0.05.

Histological micrographs of the kidney. Treatment time: 21 days. (A) CN: negative control; (B) CD: diabetes control; (C) D + E 25 mg/kg: (D) D + E 50 mg/kg; (E) D + E 100 mg/kg; (F) Extract; (G) olive oil, and (H) D + VE. The cuts were paraffin-soaked and stained with hematoxylin and eosin. Magnification: 40x.
Immunoreactivity of CLDN 2 in Renal Tissue
In the negative control group, the presence of immunoreactivity to CLDN 2 was observed in distal and proximal convoluted tubules, the glomeruli did not exhibit reactivity (Figure 3A).
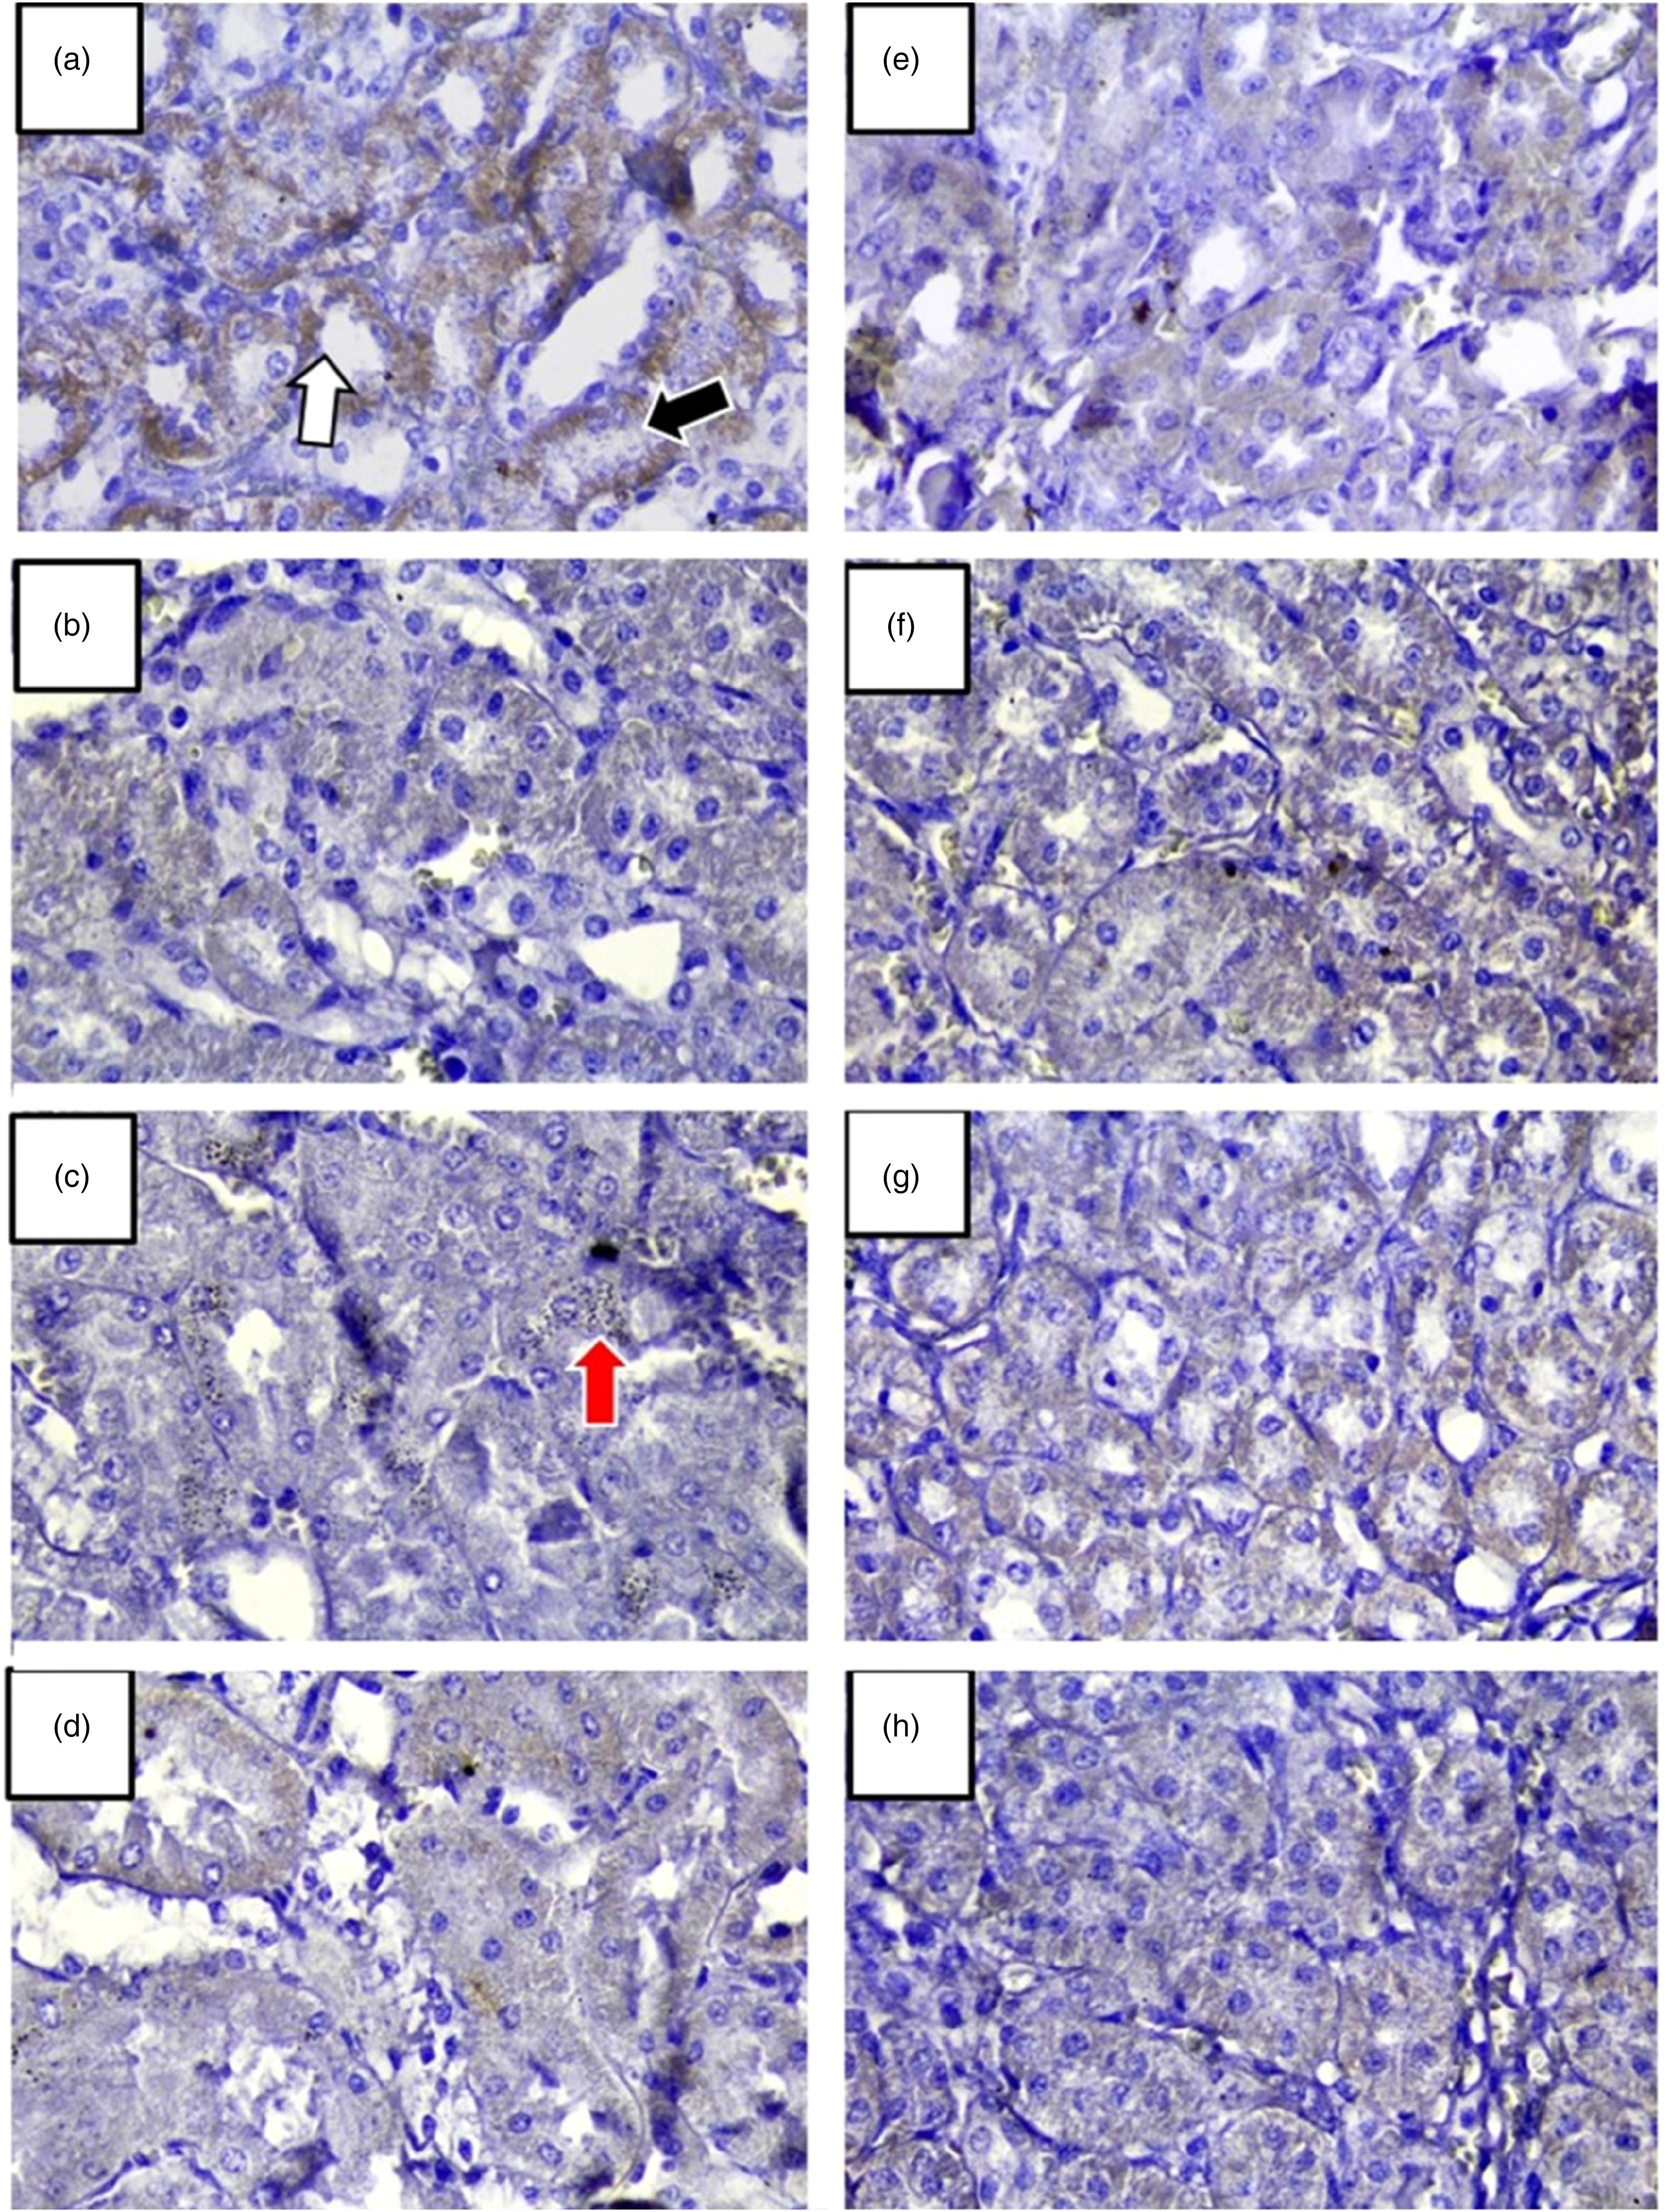
Immunoreactivity of claudin 2 (CLD2) in renal tissue. Treatment time: 21 days. (A) CN: negative control; (B) CD: diabetes control; (C) D + E 25 mg/kg: (D) D + E 50 mg/kg; (E) D + E 100 mg/kg; (F) Extract; (G) olive oil, and (H) D + VE. The cuts were paraffin-soaked and stained with hematoxylin and eosin. Magnification: 40x.
In contrast, in the diabetic group, an apparent decrease in immunoreactivity of CLDN 2 was observed in distal and proximal convoluted tubules (Figure 3B).
In the diabetic group with 25 mg/kg of extract, also an apparent decrease in CLDN 2 immunoreactivity in distal and proximal convoluted tubules was visible (Figure 3C). Here, the presence of cytoplasmatic inclusions was observed.
In the diabetic group with 50 mg/kg of extract, cytoplasmic inclusions were observed, but also a greater reactivity of the CLDN 2 in distal and proximal convoluted tubules compared to the diabetic group with 25 mg/kg of the extract was detected (Figure 3D). The diabetic group treated with 100 mg/kg of extract (Figure 3E) showed less reactivity to CLDN 2 compared to the other diabetic group with extract treatment which determines this dose as overdose. The nondiabetic group that administered only extract (Figure 3F), only olive oil (Figure 3G), and diabetic plus 100 mg/kg of vitamin E (Figure 3H) presented immunoreactivity of CLDN 2 in distal convoluted tubules and proximal convoluted tubules like the negative control group.
We performed an analysis of the densitometry resulting from the immunohistochemical assay, which showed a statistically significant difference between the groups (P = .02). In the multiple comparisons, the group ND has differences with D + E50 (P = .003) and D + E100 (P = .0003), decreasing the densitometry of the anti-CLDN2 antibody significantly in the groups that were administered the JD extract. No differences were observed between the ND group and the rest of the experimental groups (Figure 3).
Compared to the DC group, the densitometric analysis of claudin reactivity in renal tissue shows a statistically significant difference between the groups treated at different doses with JD (25 mg, 50 mg, and 100 mg). On the contrary, the groups treated with vitamin E and the vehicle (olive oil) did not show differences in the densitometry concerning the DC group (Figure 4).

Densitometric analysis of claudin. D + E 25 mg/kg: diabetes treated with 25 mg/kg of JD extract. D + E 50 mg/kg. diabetes treated with 50 mg/kg of JD extract. D + E 100 mg/kg, diabetes treated with 100 mg/kg of JD extract. Kruskal–Wallis test and Dunn's multiple comparisons test and DC group. **P < .001, ***P < .0001.
Discussion
In this study, supplementation with an extract from JD was administered to healthy nondiabetic rats and rats with induced diabetes. The diabetes was induced by an IP injection of alloxan (Sigma) at 125 mg/kg of weight.36–38 After 2 weeks, the animals without hypoglycemic shock and fasting glucose levels larger than 250 mg/dL were considered diabetic. The treatments included a daily dosage of 25, 50, and 100 mg/kg of JD extract, 50 mg/kg of vitamin E. Control groups were negative group, diabetes group, nondiabetic rats treated with 50 mg/kg JD extract, and nondiabetic rats given olive oil.
Previously, we have shown that the damage caused to the islets of Langerhans induced by alloxan is due to damage to the beta cell, causing dysfunction that manifests with hyperglycemia and diabetes. 39 In addition, a study by Storz in 2020 showed that beta cells are susceptible to damage from exposure to diets rich in saturated fat while the intake of polyunsaturated fatty acids exerts a protective effect on beta cells. 40 Not only animal models have the effect of polyphenols on the recovery of pancreatic cells. For example, a study in patients with T2D given infusions of Somarinus officinalis for 90 days found decreased percentages of glycated hemoglobin, insulin resistance, and improved pancreatic β-cells function. Currently, the use of drugs such as sulfonylureas, whose site of action depends on the ability of the pancreas to secrete insulin and, therefore, requires functional beta cells to exert a therapeutic effect, is still being considered. However, in the long term, it generates pancreatic damage due to overexploitation of the insulin-secreting function by the pancreatic beta cells. 41 The active ingredients present in vegetables, such as JD, can be an alternative treatment for hyperglycemic states resulting from damage to the pancreatic beta cell, which allows restoring the physiology of glucose transport.
The results of rat weight and blood glucose levels shown that diabetic animals with the treatment of 50 and 100 mg/kg showed a decrease in glucose levels and a weight gain without a significant difference versus diabetic control. On the other hand, the weight data in the diabetic group treated with an extract dose of 25 mg/kg showed a decrease in the significance (P < .05) compared to the initial weight. The treatment group of 25 mg/kg showed no change in glucose levels. Weight decrease could suggest a positive influence of the treatment with 25 mg/kg of the JD extract. However, due to lack in visible trend in the other groups studied that conclusion cannot be proved. In similar research 21 lack of trend was also observed and it was suggested that it might be due to the length and levels of treatment. Here, we add that absence of a trend might be as well attributed to the low number of subjects in each group.
Various mechanisms are associated with impaired pancreatic secretion and insulin resistance in T2D, for example, vitamin D deficiency, 42 or oxidative phenomenon in the cell membrane. In the case of polyphenols, they improve insulin resistance by inhibiting the phosphorylation of IRS serine proteins, which increases the phosphorylation of protein kinase B (Akt), a protein that promotes the translocation of GLUT4 to the cell membrane. Likewise, due to its high reducing capacity, it sequesters ROS superoxide. In summary, some polyphenols have been shown to enhance gene expression of proteins involved in insulin signaling. 43
In other hand, no change in the renal structure was observed, which indicates that the extract does not cause damage to the studied organ. Chandran et al. reported 44 that the polyphenolic compounds from plant extracts have protective ability in organs such as kidney, liver, pancreas, and heart, due to their antioxidant capacity. In this work, although no morphological changes were observed in tissues of extract exposed animals, there were areas of mild to moderate vascular congestion visible on diabetic groups with the treatment of 25 and 100 mg/kg of extract. On the other hand, the diabetic group that was treated with dose of 50 mg/kg of JD extract did not show any damage or vascular congestion. This leads to suggest that this is a suitable concentration to induce cell protection.
Hyperglycemia causes a high production of ROS. In response to oxidative stress, numerous modifications are manifested at the cellular and molecular level. Kidney damage resulting from hyperglycemia and oxidative stress is the result of the activation of immunological pathways, including the inflammatory process, fibrosis and apoptosis. 45 The polyphenols or bioactive compounds present in plants considered medicinal improve the pathological conditions of chronic diseases, such as DM. 45 These data suggest that polyphenols can modify the progression of DN by modulating premature cell aging, reducing oxidative stress, the inflammatory state, apoptosis, and therefore the production of collagen in fibrosis. Resveratrol, a polyphenol, has been shown to prevent kidney damage caused by oxidative stress, enhance antioxidant capacity, and attenuate inflammatory and fibrotic responses. 46 The main function of the kidney is the elimination of xenobiotics, including drugs and environmental toxic agents. Due to the mechanism of secretion, the cells of the proximal tubules are the main site of accumulation of toxic materials and location for primary damage of the nephron. Subsequently, damage presented in glomerulus, distal tubules, and loop of Henle produce alterations in renal function. It is important to emphasize that the oxidative stress that occurs in the kidney can start as an alteration of the thigh junction function. Thus, identifying the role of antioxidants in preventing oxidative stress could be useful in preventing damage to the JT structure.47–49
In diabetes, the increase in glucose decreases the expression of gap junctions, a phenomenon that explains the presence of microvascular complications of diabetes.50,51 A study with Zucker rats demonstrated that hyperglycemia enhanced oxidative stress. This result in the malfunction of gap junctions in the juxtaglomerular apparatus. Finally, the observations from molecular biology experiments suggest that the maintenance of the gap junction is fundamental in the autoregulation of the filtration processes and exchange of glomerular-tubular solutes, which is altered in diabetes.50,52 Here a greater immune reactivity of the CLDN 2 was observed in the negative control group, in the diabetic group exposed to 50 mg/kg of extract and in the diabetic group treated with vitamin E. On the contrary, the diabetic group showed the lowest immune reactivity of CLDN 2, followed by the diabetic group exposed to 25 mg/kg and the group subjected to 100 mg/kg. In the negative control group, the presence of immunoreactivity to CLDN 2 was observed in distal and proximal convoluted tubules. In a similar study were vitamin A (retinoic acid) was administered to diabetic rats decreases of CLDN 2 and occludins in the proximal tubules and lowering of CLDN 5 in the glomerulus were showed. 53 The nondiabetic group that was administered extract, olive oil, diabetic rats exposed to 100 mg of vitamin E, presented immunoreactivity of CLDN 2 in distal and proximal convoluted tubules like the negative control group. Comparable levels of CLDN 2 in the nondiabetic group exposed to JD extract and negative control show that this extract is not hindering the correct kidneýs functions.
The diabetic group treated with 50 mg/kg of extract JD displayed typical renal tissue morphology and increased CLDN 2 immunoreactivity suggesting that this dosage is the most beneficial in the treatment of diabetes.
Conclusions
The histological parameters analysis of kidney tissue shows that the extract of JD is not toxic. There was no morphological damage observed in the kidney structure in any of the groups, with only mild to moderate vascular congestion observed in the diabetic groups. The diabetic group treated with 50 mg/kg of extract JD displayed typical renal tissue morphology and increased CLDN 2 immunoreactivity suggesting this dosage is the most beneficial in the treatment of diabetes.
Communication mediated by TJ plays a role in the pathogenesis of T2D. An alteration in TJ due to genetic or environmental disorders affects the endocrine dysfunctions of the pancreas and kidneys that contribute to the appearance and evolution of this metabolic disorder.
Footnotes
Acknowledgments:
The authors would like to thank Vivarium of Universidad Juárez del Estado de Durango for their contribution on animal donation.
Author’s Contribution
Conceptualization: Dealmy Delgadillo Guzmán and Agustina Ramírez Moreno; Formal analysis: Agustina Ramírez Moreno; Funding acquisition: Rubén García Garza and Adolfo Soto; Project administration: Dealmy Delgadillo Guzmán; Resources: Erika Flores Loyola and Irais Castillo Maldonado; Supervision: Dealmy Delgadillo Guzmán; Validation: Ibrahim Sharara Núñez, Hady Keita, and David Pedroza Escobar; Writing—original draft, Agustina Ramírez Moreno, Adolfo Soto Domínguez Writing—review and editing, Rubén García Garza. All authors have read and agreed to the published version of the manuscript.”
Declaration of Conflicting Interests
The authors declared no potential conflicts of interest with respect to the research, authorship, and/or publication of this article.
Funding
The authors disclosed receipt of the following financial support for the research, authorship, and/or publication of this article: This research was funded by Consejo Nacional de Ciencia y Tecnología for the doctoral scholarship (grant number 574703).