
Abstract
Inonotus obliquus is a rare, edible and medicinal fungus that is widely used as a remedy for various diseases. Its main bioactive substances are polysaccharides and terpenoids. In this study, we characterized and investigated the pan-genome of three strains of I. obliquus. The genome sizes of JL01, HE, and NBRC8681 were 32.04, 29.04, and 31.78 Mb, respectively. There were 6 543 core gene families and 6 197 accessory gene families among the three strains, with 14 polysaccharide-related core gene families and seven accessory gene families. For terpenoids, there were 13 core gene families and 17 accessory gene families. Pan-genome sequencing of I. obliquus has improved our understanding of biological characteristics related to the biosynthesis of polysaccharides and terpenoids at the molecular level, which in turn will enable us to increase the production of polysaccharides and terpenoids by this mushroom.
Introduction
Inonotus obliquus (Persoon : Fries) Pilat also called chaga in Russia, is a type of white-rot fungus in the family Hymenochaetaceae, Basidiomycetes 1 that is edible and has medicinal uses. It is widely distributed across the Northern Hemisphere, mainly in Europe, Asia, and North America. 2 The mushroom is used as an alternative and traditional medicine to manage certain diseases in China, Russia, Japan, and other Asian countries for centuries due to its perceived health benefits. 3
Polysaccharides and terpenes have been recognized as the main bioactive compounds in I. obliquus, and they are responsible for antitumor, 4 anti-inflammatory, 5 antioxidant, 6 and immunomodulatory activities. 7 Some studies have illustrated that crude polysaccharides from I. obliquus ameliorate diabetic symptoms and that they show great antioxidant and hypolipidemic capacities.8,9 A triterpene called inotodiol has antiproliferative properties, demonstrated in vitro with human lung adenocarcinoma (A549), cancer-derived, and HeLa cells. 10
Genome sequencing has become more rapid and more practical, but genome sequences alone are insufficient to explain biological characteristics. Studies of genetic variation between different organisms can overcome such limitations and broaden the understanding of genes with biological functions. The pan-genome is defined as all genes from all isolated strains of a species. 11 Pan-genome analyses are conducted to account for genomic diversity. 12 The pan-genome is usually subdivided into core genome and accessory genome. The core genome includes the conserved genes across all observed genomes from all species. These genes are essential for the viability of the organisms. The accessory genome includes genes from isolated genomes or individual genomes within one species. These genes could influence phenotypic differences between isolates. 13
Pan-genome analyses are well-established in comparative prokaryote genomics, but have also been extended to comparative intraspecific studies in eukaryotes. There have been a series of recent studies showing the existence of eukaryotic pan-genomes in some form. Comparative analyses of different cultivars of Brassica oleracea have been conducted using the pan-genome. 14 In fungi, multiple studies of the Saccharomyces cerevisiae pan-genome have shown evidence for core and accessory genomes of varying size 15 based on whole-genome sequencing of S. cerevisiae isolates, providing an evolutionary picture of the genomic variants in yeast. 16
There are many strains of I. obliquus that are widely distributed in the northern hemisphere. Analysis of their evolutionary relationships has great significance for making full use of the wild resources of this species. A genome-wide analysis of triterpene compounds and polysaccharide genes can reveal their formation mechanisms at the molecular level, in order to improve triterpene and polysaccharide contents in I. obliquus.
Materials and Methods
Sample Collection and DNA Extraction
Three strains of I. obliquus from different countries were analyzed. JL01 originated from China, HE from Russia, and NBRC8681 from Japan. Hyphae with vigorous growth were cultured for 20 days to extract genomic DNA, which was extracted from mycelium using the cetyltrimethylammonium bromide (CTAB) procedure. 17 The quality and concentration of the DNA samples were quantified using NanoDrop 2000 (Thermo Fisher).
DNA Library Preparation and Sequencing
DNA was extracted and randomly interrupted using physical means (ultrasound) to obtain inserted fragments of the required length (i.e., 350 bp). Primers were added at the sticky end of the fragment to construct the library. The constructed sequencing library was used for bridge PCR on a sequencing chip (Illumina flow cell), followed by paired-end sequencing. The resulting data were interpreted as nucleic acid sequences for further analysis.
Illumina Sequencing Quality Control
The raw sequence reads were scored (quality score = −10×log10P, P was the probability of identifying base errors). 18 Higher quality scores indicate more reliable bases. A quality score of 20 indicates that one in 100 bases will be mistakenly identified, while a score of 30 indicates that one in 1 000 bases will be mistakenly identified. Clean reads were obtained by removing the sequencing adapters and primer sequences of raw reads and filtering of low-quality data.
Genomic Component Analysis
Velvet software was used to assemble the sequencing data of each strain. 19 Genemark-ES was used to predict the genes of the assembled genome. 20 Repeat Masker software was used to predict the repeated sequences of the strain genome. 21 The software tRNA scan-SE was used to predict the tRNA in the genome, 22 and the software Infernal 1.1 23 was used to predict the rRNA in the genome and other ncRNAs, in addition to tRNA and rRNA based on the Rfam database. 24
Gene Function Annotation
The predicted gene sequences were annotated with functional databases such as clusters of orthologous groups (COG), 25 Kyoto encyclopedia of genes and genome (KEGG), 26 Swiss-prot, 27 TrEMBL, 27 and the non-redundant (Nr) database 28 by BLAST, 29 and the annotation results of gene functions were obtained. Based on the comparison results of the nr database, Blast2GO software 30 was used to annotate the function in the gene ontology (GO) database. 31 HMMER 32 was used to conduct Pfam function annotation based on the Pfam 33 database. In addition, further COG classification analysis, KEGG metabolic pathway analysis, and GO function classification analysis were conducted according to the annotation results.
BLAST comparisons were made between predicted gene protein sequences and functional databases such as the pathogen-host interaction factor database (PHI) 34 and corresponding annotation results were obtained. In addition, HMMER 32 was used for functional annotation of carbohydrate enzymes based on CAZyme. 35
Analysis of Variation and Differences Among Strains
JL01 was used as the reference genome, and genomes of the other two strains were compared with JL01 using the Applied MUMmer 36 package. These comparisons identified single nucleotide polymorphisms (SNPs), small insertions/deletions (InDels), and genome structure variation. Alien Hunter 37 and HGT-Finder 38 were then used to predict horizontal gene transfer for each strain.
Comparative Genomics Analysis
OrthoMCL 39 was used for gene family analysis of predicted protein sequences of each strain and protein sequences of the reference genome to look for gene families that are either common (core gene families) or unique to each strain (accessory gene families). JL01 was used as the reference genome. The software Mugsy 40 was used to compare the genome sequences of all sequenced strains with those of the reference genome. From the comparison results, the common sequences of all strains were identified as the core genome sequences, while the remaining sequences were accessory genome sequences.
Results
Genome Sequencing and Assembly
A 350 bp library was constructed for each strain, and the raw data were sequenced using the Illumina platform. The results are shown in Table 1. The sequencing volume of the corresponding sequencing libraries was between 6.39 and 8.64 Gb. The minimum sequencing depth was 202 and the maximum 270. The sequencing quality values Q20 and Q30 were all above 93%.
Genome Characteristics of 3 I. obliquus Strains.

GC content and genome size for all three strains are summarized in Table 2. Results show that the genome size of JL01 is 32.04 Mb, that of HE is 29.04 Mb, and that of NBRC8681 is 31.78 Mb. GC content for all three strains was >47%, indicating moderate GC content.
Statistics of Assembly Results.

Genomic Component Analysis
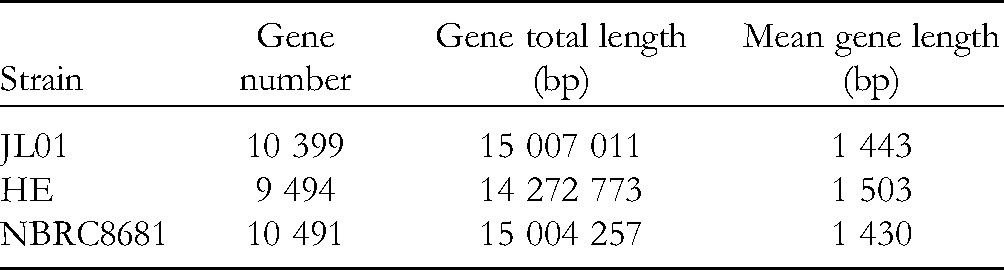
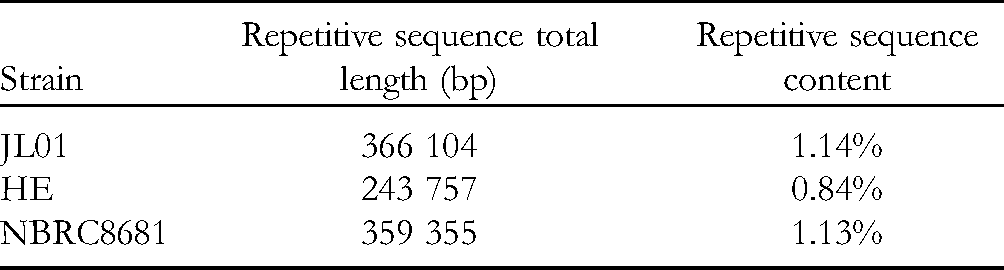
Gene prediction was carried out for the assembled genomes. The specific statistical information of gene prediction for each strain is shown in Table 3. Strain NBRC8681 had the largest number of genomes (10 491), followed by JL01 (10 399), and HE (9 494). Mean gene length (bp) of all three strains is 1 400-1 500. The percentages of repetitive sequence ranged from 0.84%-1.14% (Table 4). The numbers of rRNA genes were four (JL01), five (HE), and two (NBRC8681), and the numbers of tRNA genes were 83 (JL01), 86 (HE), and 84 (NBRC8681). The numbers of other RNA genes were 21 (JL01), 19 (HE), and 20 (NBRC8681) (Table 5).
Genetic Prediction of Each Strain.
Repetitive Sequence Prediction.
Results of Non-coding RNA Prediction.

Gene Function Annotation
The results of functional annotation of the predicted genes are shown in Table 6. The databases used for functional annotations include COG, GO, KEGG, Pfam, Swiss-Prot, TrEMBL, and Nr. The numbers of predicted genes annotated were 8 908 (JL01), 8 744 (HE), and 8 932 (NBRC8681). The protein sequences of the predicted genes were compared with special databases including the carbohydrate-active enzymes database (CAZyme) and pathogen host interactions (PHI-base) (Table 7). In total, 424 (JL01), 428 (HE), and 419 (NBRC8681) genes were annotated to the CAZyme private database. For the private PHI-base, 2 394 (JL01), 2 429 (HE), and 2 377 (NBRC8681) genes were annotated.
The Number of Functional Annotations for the Predicted Genes.

The Number of Annotations From Special Databases.

Variation and Differences Among Strains
Each strain was compared with the genome of the reference strain JL01 to find SNPs and small InDels (Table 8). The number of SNP mutations in HE reached 36 973; however, NBRC8681 had 144 348 SNPs. In terms of structural variation (InDels), HE did not differ from JL01, regardless of insertion or deletion. However, there were 21 insertions and 70 deletions in strain NBRC8681. The horizontally transferred genes of each strain were predicted; there were no shared genes between JL01, HE, and NBRC8681.
Prediction of Variation in Each Strain.

Comparative Genomics Analysis
The predicted protein sequences of each strain and the protein sequences of the reference genome were analyzed to find the common and unique gene families of each strain. Gene families shared by all strains are core gene families, and any others are considered accessory. The statistical results of core gene and accessory gene families are shown in Figure 1. There were 6 543 core and 6 197 accessory gene families among the three strains.
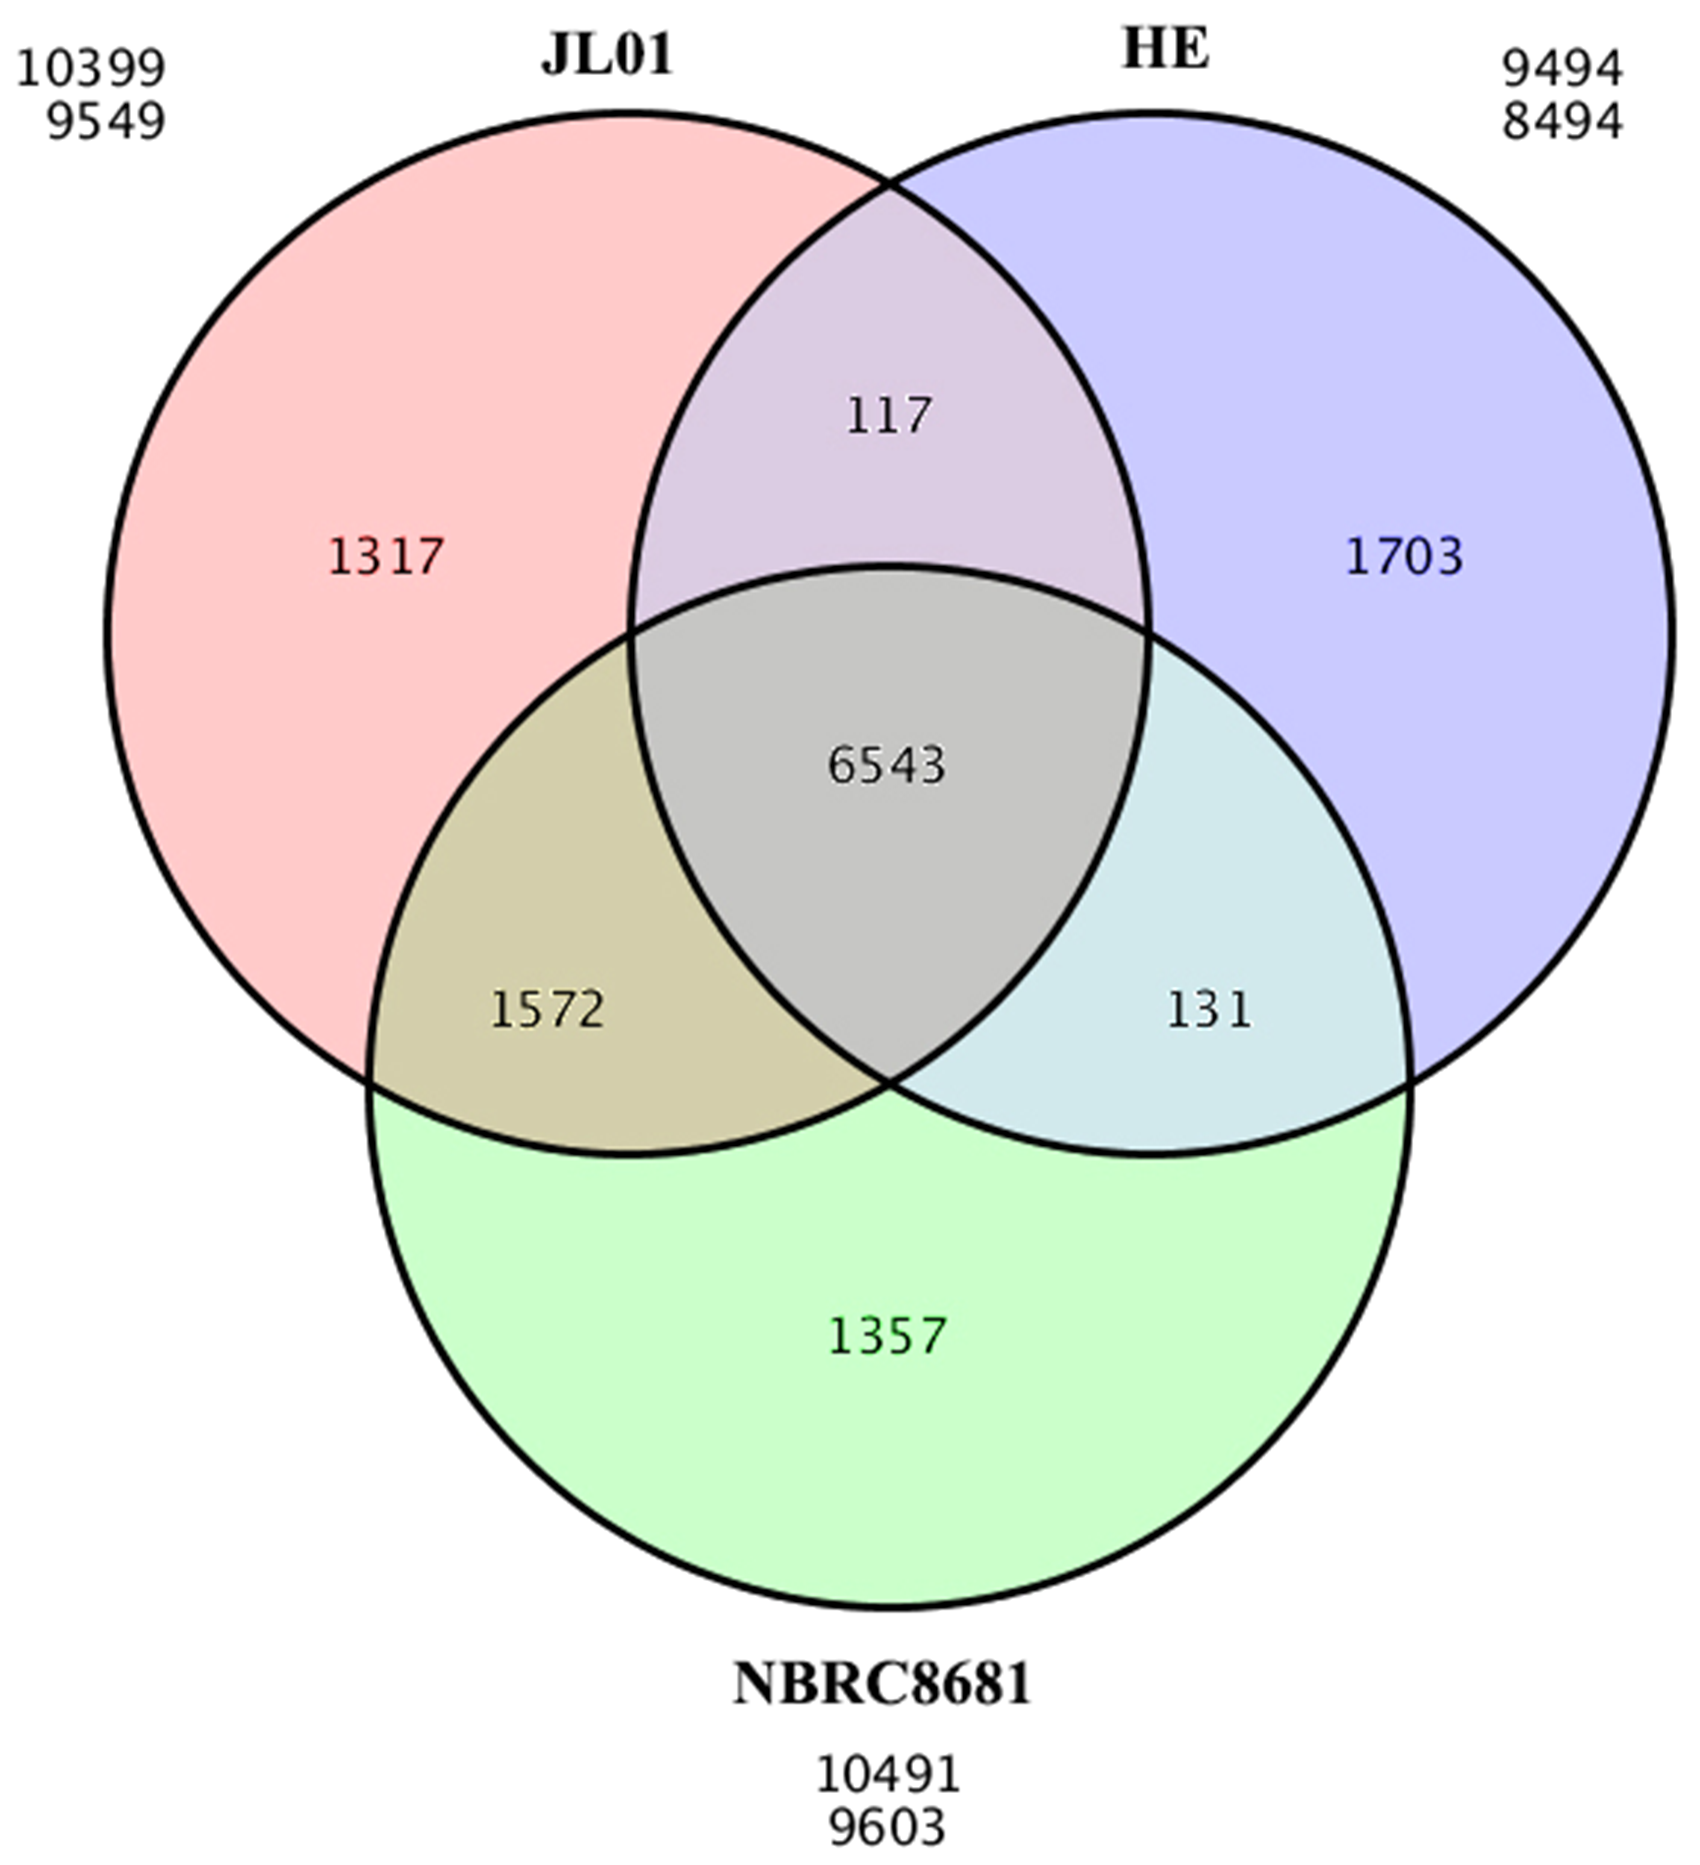
Gene family Venn diagram with three circles.
Note: the area in the middle circle represents the number of gene families shared by all strains. The number in the ellipses around the middle circle represent the number of gene families unique to each strain.
Pan-genome families vary with the number of strains included (Figure 2). JL01 is the reference genome. The number of core gene families decreased as strains were added: there were 6 660 core genes when HE was added and 6 543 core genes when NBRC8681 was added. However, on the contrary, the number of pan-genome gene families increased gradually as strains were added. The number of pan-genome gene families reached 11 383 when HE was added, and 12 740 when NBRC8681 was added.

Changes in pan-genome families with the addition of strains.
To characterize the distribution of gene functions on the basis of the GO classification, GO analysis was performed to identify the functions of the strain-specific genes of JL01, HE, and NBRC8681, which were classified into three main categories: cellular component, molecular function, and biological process. The results are shown in Figure 3.

Annotation classification of GO secondary nodes for specific genes.
For JL01, there were no strain-specific genes for supramolecular complex, transcription factor activity, protein binding, nucleic acid binding transcription factor activity, signal transducer activity, electron carrier activity, metallochaperone activity, translation regulator activity, molecular transducer activity, molecular function regulator, reproduction, immune system process, reproductive process, signaling, multicellular organismal process, developmental process, multi-organism process, and biological regulation. The largest number of annotated genes (1 061) was enriched in catalytic activity, followed by metabolic process (894) and binding (775).
For HE, there were no strain-specific genes for supramolecular complex, transcription factor activity, protein binding, signal transducer activity, metallochaperone activity, translation regulator activity, molecular transducer activity, molecular function regulator, reproduction, immune system process, reproductive process, and multicellular organismal process. All the annotated genes were concentrated in catalytic activity (1 105), metabolic process (913), and binding (799).
For NBRC8681, there were no strain-specific genes for extracellular region, membrane-enclosed lumen, supramolecular complex, transcription factor activity, protein binding, nucleic acid binding transcription factor activity, electron carrier activity, antioxidant activity, protein tag, translation regulator activity, molecular function regulator, reproduction, immune system process, reproductive process, multicellular organismal process, developmental process, multi-organism process, and detoxification. All the annotated genes were concentrated in catalytic activity (1 037), metabolic process (868), and binding (789).
Prediction of Polysaccharide and Terpenoid Genes
To identify candidate genes responsible for the polysaccharide and terpenoid genes, functional genome comparisons were conducted by analyzing the pan-genome. There were 20 gene families related to polysaccharide biological function, including 50 genes. The number of core gene families was 14 and there were seven accessory gene families among the three strains. There were 30 gene families related to terpenoid biological function, including 71 genes. The number of core gene families was 13 and there were 17 accessory gene families among the three strains (Figure 4, Tables 9 and 10). In the polysaccharide biological synthesis pathway, polysaccharide lyase family protein, endocellulase, cellulase, glucoamylase, lytic polysaccharide monooxygenase, cellobiose dehydrogenase, glycoside hydrolase family protein, and NAD-binding protein were identified (Table 9). In the terpenoid synthesis pathway, terpenoid synthase, terpenoid cyclases, delta(6)-protoilludene synthase, and alpha-muurolene synthase genes were predicted (Table 10).

Polysaccharide (left) and terpenoid (right) gene family Venn diagrams with three circles.
Prediction of Polysaccharides Genes Family.

Prediction of Terpenoid Genes Family.

Discussion
Inonotus obliquus has a wide geographical distribution, being found from the mountainous areas of meridional zones to subarctic areas in the Northern Hemisphere, including regions within Canada, the United States, Asia, and Europe. 41 In this study, JL01 originated from China, HE from Russia, and NBRC8681 from Japan. The strains used in this pan-genome analysis span the typical geographical region of I. obliquus, and can, therefore, provide accurate and broad genomic information.
Genome sequencing provides the opportunity to better understand and confirm the genetic relationships among fungal isolates, and can be used to identify gene candidates that could contribute to biological activity. For I. obliquus strains, our results showed that the genome size of JL01 is 32.04 Mb, for HE 29.04 Mb, and for NBRC8681 31.78 Mb, all of which are consistent with the genome sizes of edible and medicinal fungi sequenced previously, which are between 30 and 50 Mb. The genome size of Ganoderma lucidum is 43.3 Mb, encoding 16 113 predicted genes. 42 The genome of Volvariella volvacea has been sequenced and assembled into 62 scaffolds with a total genome size of 35.7 Mb, containing 11 084 predicted gene models. 43 The complete Pleurotus ostreatus genome contains 35 Mb. 44 Although JL01 had the largest genome, it has fewer predicted genes than strain NBRC8681, which had 10 491.
Comparing the genome sequences of the three strains, the number of SNPs/small InDels was found to be significantly different (Table 8). SNPs/small InDels of NBRC8681 had the biggest differences compared to JL01. Structural variation of NBRC8681, including InDels, was obviously different from JL01. Although HE and JL01 have some differences in SNPs/small InDels, there is no difference in InDel structural variation between the two strains. This may be due to the relatively close geographical locations of JL01 and HE. However, NBRC8681 has the most predicted genes (10 491), which may be related to it having the most variation.
Sequencing has been widely used to predict gene function. Li et al. used Ganoderma lucidum at three different developmental stages as materials and conducted transcriptome analysis on the long non-coding RNA (lincRNA), identifying 402 lincRNA with an average length of 609 bp. 45 Muraguchi et al. identified a large number of genes related to secondary metabolism by sequencing. 46 In our study, functional genome comparisons were conducted by analyzing the pan-genome. In total, 20 gene families related to polysaccharide biological function were identified. The number of core gene families related to polysaccharide biological function was 14; however, there were only seven gene families for polysaccharide biological function belonging to accessory gene families among the three strains. Researchers should therefore focus on core gene families when studying polysaccharide biosynthesis genes. On the contrary, there were 13 core gene families related to terpenoid biological function and 17 accessory gene families related to terpenoid biological function (Figure 4). When studying the functional genes of terpenes of I. obliquus, it may thus be more important to focus on accessory gene families than on core gene families.
In this study, we predicted some polysaccharide related genes (Table 9). Polysaccharide lyases cleave the polymer chain by a β-elimination mechanism. Most of the enzymes in this class randomly cleave the main chain of polysaccharide structures. The products in a few cases may be monosaccharides, but are more commonly oligosaccharides. 47 Cellulases break down cellulose into monosaccharides, polysaccharides, and oligosaccharides. 48 Endocellulase (EGPf) is one kind of hyperthermophilic cellulase, and EGPf combined with β-glucosidase (BGLPf) degrades glucose at high temperature. 49 Glucoamylase hydrolyzes polysaccharides by consecutive cleavage of α-1,4 and α-1,6 glycosidic bonds. 50 Regulation of glycoside hydrolase is important during polysaccharide biosynthesis. 51 Lytic polysaccharide monooxygenases (LPMO10 s) use redox chemistry to cleave glycosidic bonds in polysaccharides, such as cellulose and chitin. 52 NAD-binding domain is found in diverse bacterial polysaccharide biosynthesis proteins. It is an import protein for polysaccharide biosynthesis. 53
Some terpenoid related genes were also predicted (Table 10). Most have been annotated to terpenoid synthase. Terpene synthase (TPS) enzymes are recognized as the gatekeepers of species-specific terpenoid pathways. TPS gene families include more than 100 members that function in metabolic networks. 54 Because terpenoid synthases catalyze cyclization reactions, they are also known as terpenoid cyclases. 55 Terpene cyclase catalyzes the cyclization of farnesyl diphosphate (FPP) to delta(6)-protoilludene. In the presence of Ca2+, delta(6)-protoilludene synthase catalyzes diverse cyclization reactions. 56 Alpha-muurolene synthase is encoded by the COP3 gene. Cop3 synthesizes seven different sesquiterpenes with alpha muurolene 15 and germacrene A 13 as the major products. 57 Analysis of these identified genes has great significance to elucidate the synthesis mechanism of polysaccharides and terpenoids of I. obliquus.
Footnotes
Author Contributions
Xiaofan Guo and Shouming Wang designed experiments, collected and analyzed data. Shouming Wang wrote the manuscript.
Data Availability Statement
The genome assembly of Inonotus obliquus in this study has been deposited at NCBI with accession no. PRJNA743015.
Declaration of Conflicting Interests
The authors declared no potential conflicts of interest with respect to the research, authorship, and/or publication of this article.
FundingThe authors disclosed receipt of the following financial support for the research, authorship, and/or publication of this article: This work was supported by the Natural Science Foundation of Xiaogan city (grant number [XGKJ2020010055]).