
Abstract
The presented study was aimed at exploring the bioactive properties (antioxidant, antimicrobial and food preserving) and chemical composition of R. discolor fruits collected from 2 geographically distinct wild-growing populations and extracted by using different solvents (methanol, ethanol, acetone and water). The total phenol (TPC), flavonoid (TFC) and anthocyanin (TAC) content varied from 52.7 to 186.8 mg GAE/g, 3.5 to 7.0 mg QE/g and 11.1 to 28.2 mg/g dry weight (dw), respectively. HPLC-DAD analysis identified cyanidin-3-glucoside (Cy-3-Glu) as the dominant anthocyanin that ranged in concentration from 18.4 to 32.2 mg/g dw. The acetone extract revealed the highest antioxidant activity through the ferric reducing antioxidant power (FRAP), total reducing power (TRC) and ß-carotene bleaching in vitro methods. The examined extracts showed antimicrobial activity, being more effective against Gram-positive (G+) than Gram-negative (G-) bacteria. Furthermore, Candida glabrata was the most susceptible among the pathogenic yeasts. The ethanol fruit extract was the most active against Listeria monocytogenes and thus chosen for incorporation in yoghurt and further analyses regarding its food preserving properties, which confirmed its efficacy towards this food-borne pathogen. Additionally, panelists gave high marks to the novel product regarding color, taste, texture flavor and overall acceptance. The obtained results indicated that R. discolor fruit extracts exhibits notable bioactivity and might therefore be considered as a good platform for the development of new preparations to be used in the food industry.
In recent years there has been a growing market demand for the replacement of synthetic antioxidants and colorants with natural compounds in the food industry and the creation of novel functional food products. 1 -6 In this regard, wild edible fruits are of particular interest, due to their high bioactive phytochemical contents. Furthermore, these species do not require any special conditions to grow, which could provide an added value for such products. 2
The genus Rubus L. (Rosaceae), with about 750 species, is one of the most diverse genera among plants. 7 Rubus fruits are a significant source of polyphenolic compounds, especially phenolic acids, flavonoids (anthocyanins, flavonols and tannins), 2,8,9 carotenoids, 10 and linoleic, linolenic and organic acids. 2,3 Furthermore, blackberries contain a high level of nutrients, particularly vitamins (vitamin C), minerals (magnesium and potassium), sugars, and dietary fibers. 2,8
The listed polyphenolic compounds along with vitamins and carotenoids exhibit notable antioxidant activity individually and synergistically. 8 -13 The most abundant polyphenols in blackberries are anthocyanins and tannins, which are related to their antimicrobial activity. 1,5 The antimicrobial properties of these compounds are influenced by the number and position of hydroxyl groups. Furthermore, their activity is reduced by glycosylation. 5 The polyphenol content, especially that of phenolic acid, anthocyanin and tannin (ellagitannin), is positively correlated with a broad spectrum of health-promoting effects including anti-inflammatory, 1,14 antitumor, 5,8,14 neuroprotective, 9,14,15 hypoglycemic, 9,14 and cardioprotective. 14
However, blackberry polyphenol profile changes during maturation, storage and processing, which is of particular interest because they are represented in the human diet not only as fresh, but more often in processed dairy products, such as jellies, jams, syrups, juices and desserts. 5,13,16 According to Hagar et al. 13 antioxidant activity was unchanged during processing and storage despite the decrease in anthocyanin concentration. However, the authors assessed antioxidant activity using in vitro assays and thus suggested that further in vivo studies are necessary for the estimation of the bioavailability of the antioxidants present. Moreover, Metzner Ungueranu et al. 16 found that, despite the losses during processing, blackberry products and by products retain phenolics in a concentration sufficient to affect positively the human diet.
R. discolor is traditionally used as a remedy for nephritis, prostatitis, fertility problems and diarrhoea. 9 Those beneficial effects on human health could be explained by the presence of phenolics, which reduce oxidative stress and prevent its damaging effects. 9,14 Despite the many publications about blackberries, R. discolor fruits are still insufficiently explored in terms of their chemical composition and biological properties. Therefore, the aims of this study were to evaluate the total phenol, flavonoid and anthocyanin content of R. discolor fruit extracts originating from Serbia, to identify the main anthocyanin compounds, and to determine the in vitro antioxidant and antimicrobial activities of the extracts. Some authors previously obtained contradictory results concerning extraction with solvents of different polarity. For instance, Panizzi et al. 17 and Latha et al. 18 reported an increase in examined bioactivities with increased solvent polarity in contrast to George et al. 19 Thus, to understand better the nature of R. discolor bioactive compounds, as well as to obtain the highest yield of extraction, the aqueous, methanol, ethanol and acetone extracts were examined in the present study. Furthermore, the extract that was found to have the best antimicrobial activity was incorporated in yogurt to evaluate the antimicrobial and sensory properties of such a novel food product.
Results and Discussion
Extraction Yields
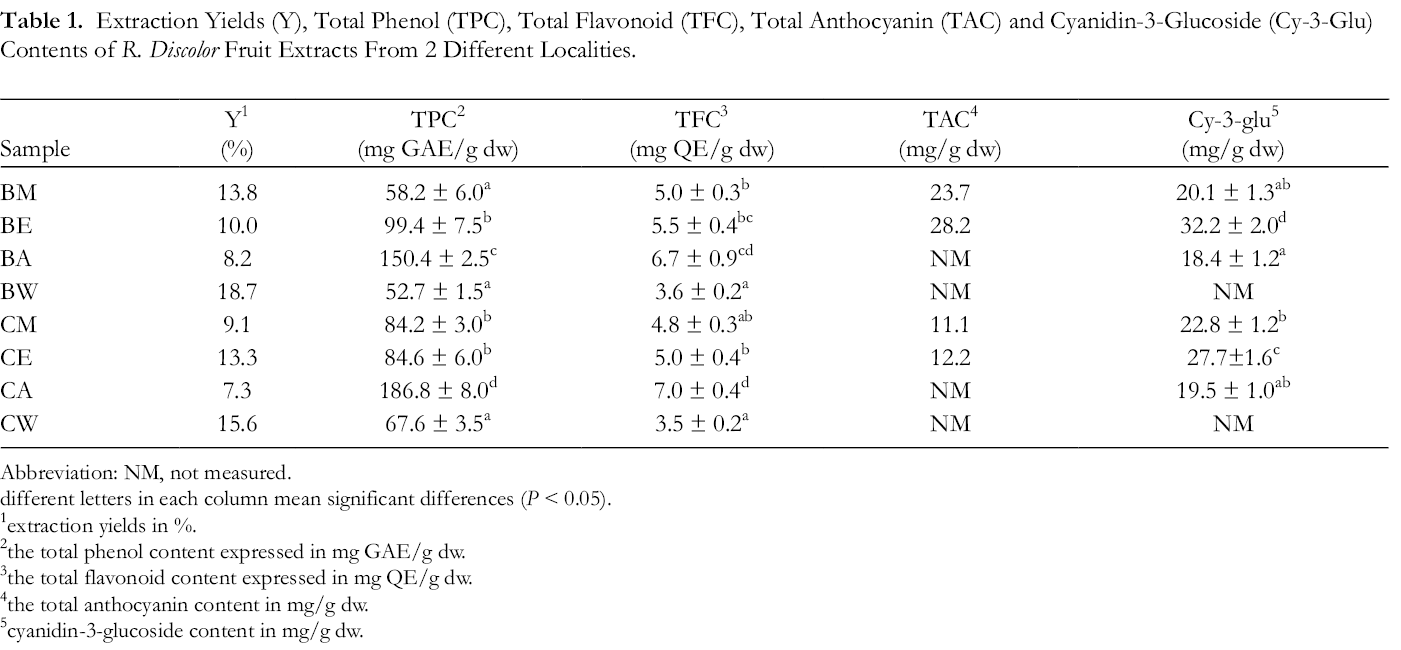
The yields of dry extracts of R. discolor fruits are given in Table 1. Aqueous extracts had the highest yield values of 18.7% and 15.6% in BW and CW, respectively, while the lowest was obtained for acetone extracts, 8.2% (BA) and 7.3% (CA). Similarly, Muniyandi et al. 3 reported yield values directly proportional to solvent polarity.
Extraction Yields (Y), Total Phenol (TPC), Total Flavonoid (TFC), Total Anthocyanin (TAC) and Cyanidin-3-Glucoside (Cy-3-Glu) Contents of R. Discolor Fruit Extracts From 2 Different Localities.
Abbreviation: NM, not measured.
different letters in each column mean significant differences (P < 0.05).
1extraction yields in %.
2the total phenol content expressed in mg GAE/g dw.
3the total flavonoid content expressed in mg QE/g dw.
4the total anthocyanin content in mg/g dw.
5cyanidin-3-glucoside content in mg/g dw.
Quantification of Total Phenols, Flavonoids and Anthocyanins
The total phenolic, flavonoid and anthocyanin contents in the tested samples are shown in Table 1. The TPC varied from 52.7 mg of gallic acid equivalents per g dw (mg GAE/g) in the BW sample to 186.8 mg GAE/g in the CA sample. Fruit extracts from both localities had the highest phenolic content in acetone (150.4 and 186.8 mg GAE/g in BA and CA, respectively) and the lowest in aqueous extracts (52.7 and 67.6 mg GAE/g in BW and CW, respectively). Keser et al. 20 examined TPC in ethanol and aqueous extracts of R. discolor leaves, flowers, unripe and ripe fruits, and it was between 70.0 and 152.0 mg of quercetin equivalents per g dw (mg QE/g), being higher in ethanol than in aqueous extracts, which is in accordance with this study. Additionally, the influence of solvent polarity on total phenol contents in R. niveus, R. ellipticus and R. fairholmianus fruit extracts were published recently by Muniyandi et al. 3 Besides solvent polarity, the phenol concentration in R. discolor, R. idaeus and R. fraxinifolius also depends on the plant organ used for extraction and plant phenophase. 8,20,21
The TFC was in the range between 3.5 mg QE/g in CW and 7.0 mg QE/g in the CA sample. The richest flavonoid content was determined in the acetone extract at 7.0 mg QE/g (CA), while the poorest was that of the aqueous extract with 3.5 mg QE/g (CW). These results were congruent with flavonoid concentrations found in the fruit extracts of R. idaeus 8 and R. fraxinifolius. 21 Conversely, a few authors reported higher flavonoid contents. 3,12 Such deviations are probably conditioned by differences in the environmental conditions of the examined Rubus species since they were collected from regions closer to the equator.
Anthocyanins are hydrosoluble, very reactive molecules that are usually extracted with water and organic solvents like ethanol and acetone, which were also used in the presented study. 10 TAC was in the range from 11.1 mg (CM) to 28.2 mg per g dw (BE). Higher amounts of anthocyanins were present in the ethanol extract than in the methanol extract, while they were completely absent in acetone extracts. This could be explained by the hydrophilic nature of anthocyanins and the inability of the method to detect them when present in smaller amounts. In aqueous extracts, the TAC was not determined due to the insolubility of aqueous extracts in methanol, which is used in the procedure for the quantification of TAC. Previous publications support our findings. 8,12,21
To determine anthocyanin compounds, HPLC-DAD analysis was used and results are presented in Table 1. Cy-3-Glu was the main compound identified in all tested samples, being the most abundant in ethanol extracts (32.2 mg/g and 27.7 mg/g in BE and CE samples, respectively). Statistical analysis showed that there were no significant differences in TPC and TFC among samples from the 2 different localities. However, samples differed more depending on the solvent polarity, which is supported by earlier publications. 3 Additionally, Reyes-Carmona et al. 22 showed that the phytochemical composition of various Rubus cultivars (‘Brazos’, ‘Tupi’, ‘Comanche’, ‘Evergreen’, ‘Marion’, ‘Siskiyou’) is influenced by climatic conditions and even more by genetic factors.
TAC in fruit extracts was previously reported in the blackberry cultivar “Čačanska Bestrna” and it was in the range from 11.5 to 13.8 mg/g dw, which was similar to our results. 23 Reyes-Carmona et al. 22 identified a few cyanidin- and malvidin-based anthocyanins as dominant compounds, such as cyanidin, cyanidin-3-O-glucoside, cyanidin-3-O-rutinoside, malvidin-3-O-acetylglucoside and malvidin-3-O-glucoside. The presence of cyanidin-based glycosides in blackberry extracts was also confirmed by several authors. 11,24 -26
Antioxidant Activity
In the present study, antioxidant activity was evaluated using several assays - FRAP, TRC and ß-carotene bleaching, and the results are shown in Table 2.
Antioxidant Properties of R. Discolor Fruit Extracts From 2 Different Localities.

Abbreviation: NM, not measured.
different letters in each column mean significant differences (P < 0.05).
1antioxidant activity expressed in µmol Fe+2 equivalents per mg dw.
2antioxidant activity expressed in RP50 values (µg/mL).
3antioxidant activity expressed in IC50 values (µg/mL).
FRAP and TRC, procedures based on the ferric-reducing potential of extracts, were used for the determination of the total antioxidant capacity of the examined samples. FRAP values varied between 0.12 µmol Fe+2/mg (CW) and 0.75 µmol Fe+2/mg dw (CA), thus establishing the strongest antioxidant potential of acetone extracts. However, L-ascorbic acid, as a standard, expressed a more powerful antioxidant potential than the tested samples (6.30 µmol Fe+2/mg of dw). Moreover, in the TRC test, acetone extracts showed the strongest antioxidant activity (RP50 values were 57 and 50.9 µg mL for BA and CA samples, respectively). Additionally, the acetone extracts (IC50 values 120.3 µg/mL and 258.4 µg/mL for BA and CA samples, respectively) were the most potent, while ethanol extracts were the least potent in preventing ß-carotene oxidation, which is assessed by the changes in discolouration.
Our results are in agreement with a few authors who previously examined the antioxidant activity of R. niveus, R. ellipticus, R. fairholmianus, 3 R. ulmifolius 11 , R. idaeus 8 and R. discolor, 20 but on the other hand, there are several reports about the higher antioxidant ability of R. glaucus 12 and R. fraxinifolius 21 extracts, which could be attributed to differences in presentation of results, but also to variations in the phytochemical composition among plants and plant organs.
In the present study, the contributions of TPC, TFC, TAC and Cy-3-Glu to antioxidant activity were also considered (Table 3). TPC and TFC were strongly correlated with FRAP, moderately with ß-carotene bleaching, and weakly with TRC values. On the other hand, TAC moderately correlated with FRAP and ß-carotene bleaching assays.
Correlation Between Total Phenol (TPC), Flavonoid (TFC), Anthocyanin (TAC) and Cyanidin-3-Glucoside Contents and Antioxidant Properties Examined Using 5 Different Procedures Expressed Through Pearson’s Coefficient of Correlation (R).

r ≤ 0.35 weak correlation; 0.36 < r < 0.67 moderate correlation; 0.68 < r < 1 strong correlation; (Taylor 27 ).
Muniyandi et al. 3 compared phenolic, flavonoid, tannin and anthocyanin contents in R. niveus, R. ellipticus and R. fairholmianus fruit extracts and their antioxidant and anticancer effects. According to established correlation and regression analysis, the authors suggested that the antioxidant activity of the examined blackberries could be ascribed to the listed phytochemicals. These results complied with subsequent publications. 9,11
The dominant anthocyanin, Cy-3-Glu, weakly correlated with the used antioxidant methods. Several authors who previously examined the contribution of cyanidin content to antioxidant activity found a strong correlation. 22,23 Schulz et al. 11 noticed that in contrast to other non-anthocyanins, the anthocyanin content in blackberries increases during the ripening process, as well as the antioxidant activity. Similar findings were recently reported by Samaniego et al. 12 On the other hand, there are also reports about a lower contribution of cyanidins to antioxidant activity. 8 Having in mind that among the tested samples the acetone extracts showed the most promising antioxidant ability and that they were the poorest in Cy-3-Glu, it is more likely that another group of polyphenols participated, maybe even more than anthocyanins, in the antioxidant properties of R. discolor fruit extracts. Additionally, several authors ascribed the antioxidant properties of R. ulmifolius and R. idaeus cultivars to tannins, particularly ellagitannins and their derivatives. 28,29
Antimicrobial Activity
According to available literature data, we assume that this is the first report on the antimicrobial activity of R. discolor fruit extracts. Results of antibacterial activity against Listeria monocytogenes NCTC 7973, Micrococcus flavus ATCC 10240, Escherichia coli ATCC 35210, Pseudomonas aeruginosa IBRS P001 and Salmonella typhimurium ATCC 13311 are presented in Table 4. The minimal inhibitory concentration (MIC) and minimal bactericidal concentration (MBC) values of the extracts varied from 1.2 mg/mL to 5.0 mg/mL, and between 0.2 and 1.2 mg/mL for ampicillin. All examined samples were more effective against Gram positive than against Gram negative bacteria, which was previously reported. 2,30 L. monocytogenes NCTC 7973 and S. typhimurium ATCC 13311 were the most sensitive among the Gram positive and Gram negative bacteria, respectively, particularly to the ethanol extracts (BE and CE). Radovanović et al. 30 examined the effects of polyphenol fruit extracts of R. fruticosus on 6 Gram positive and Gram negative bacterial strains and obtained MIC/MBC values close to ours. In this study, the most sensitive were S. enteridis and S. aureus, while Klebsiella pneumoniae was not affected. The lack of activity of R. ulmifolius fruit extracts on K. pneumoniae and P. aeruginosa was also noticed by Da Silva et al. 2 Nevertheless, the authors affirmed potential bacteriostatic effects on other tested bacteria, with Morganella morganii and E. coli being the most affected among Gram negative and Enterococcus faecalis and L. monocytogenes among Gram positive bacteria. The authors proposed synergism of identified polyphenols as a probable explanation of the antibacterial activity of R. ulmifolius. Additionally, the fruit extracts of R. idaeus, R. ulmifolius and R. rosifolius acted as antibacterial agents in experiments performed by some researchers. 8,17,31
Antimicrobial Activity of 2 Samples of R. Discolor and Their 3 Different Extracts.

different letters in each column mean significant differences (P < 0.05).
1minimal inhibitory concentrations expressed in mg/mL.
2minimal bactericidal concentrations expressed in mg/mL.
3minimal fungicidal concentrations expressed in mg/mL.
Anti-yeast activity against 3 Candida strains was also evaluated (Table 4). The MICs, as well as minimal fungicidal concentrations (MFCs), were in the range from 1.2 mg/mL to 5.0 mg/mL. The most resistant was C. albicans ATCC 10231, while C. glabrata MN12 was the most susceptible of the tested strains. BM, BE and CE samples were particularly effective against C. krusei MN13 (MFC were 1.2, 2.5 and 2.5 mg/mL, respectively), even more than fluconazole (the MFC was higher than 3 mg/mL), which was used as a positive control. Similar to the antibacterial activity, ethanol extracts (BE, CE) exhibited the highest antifungal activity (MFCs between 1.2 and 2.5 mg/mL). The influence of solvent polarity on the antimicrobial activity of R. ulmifolius extracts was previously observed by Panizzi et al. 17 They found that antimicrobial effectiveness increased with the polarity of solvents, which is in line with our results. In their study, the particularly high activity of methanol extracts was ascribed to phenolic acids (gallic, ferulic and perhaps caffeoylquinic acid) and tannins. On the other hand, weak fungistatic and a lack of fungicidal activity on C. albicans was observed recently. 2
However, the results presented herein indicate that the examined R. discolor fruit extracts exhibited antimicrobial activity towards the tested pathogen microbial strains. Particularly significant results were obtained for C. krusei since it is a pathogenic yeast that is one of the most common causes of nosocomial infections, which have an innate resistance to broad-spectrum antimycotics. 27
L.monocytogenes Growth Inhibition by R. Discolor Ethanolic Extracts in Yoghurt and Sensory Evaluation
The preserving properties in yogurt of the R. discolor ethanolic extract were shown to be promising. The BE extract was chosen for the experiment due to its best in vitro results on L. monocytogenes. The MIC (1.4 mg/mL) and MBC (2.8 mg/mL) values for L. monocytogenes were similar in the yogurt experiment when compared to the in vitro microdilution method (MIC = MBC 1.2 mg/mL). The higher MBC value in the yogurt experiment might be explained by the greater complexity of yogurt relative to the simple laboratory media. Eleven panelists rated the yogurt enriched with the BE extract of R. discolor. The average marks (on a scale from 1 to 5) for color, taste, texture, flavor and overall acceptance were 4.09 ± 0.7, 3.91 ± 0.94, 3.45 ± 1.29, 3.18 ± 0.4 and 3.73 ± 0.79, respectively. It could be said that our product was liked by the majority of panelists, which makes it a promising novel product for future industrial production.
Conclusions
R. discolor fruits abound in phenolic compounds, particularly from the flavonoid group. The main anthocyanin compound in all samples was cyanidin-3-glucoside. Based on our results, it could be concluded that phenols are associated with antioxidant activity as measured by FRAP and TRC tests. Values obtained for the ß-carotene bleaching test suggest that TPC is not the only contributor to antioxidant properties, but also compounds present in smaller amounts and their synergistic effects. Our results indicate that the antimicrobial activity of R. discolor fruit extracts has been unduly neglected so far. All examined samples were effective against bacterial and fungal strains. Taking into account that synthetic antibiotics and antimycotics cause resistance in microorganisms and the exhibited bioactivity of R. discolor fruit extracts, we consider the presented findings could serve as the first steps for further research into the implementation of R. discolor, primarily in the food, but also in the pharmaceutical industry.
Experimental
Plant Material
Fresh fruits of R. discolor were collected from 2 localities, one near Belgrade and the other, Čokešina (Mt. Cer, Serbia) during the summer of 2012, and stored in the fridge at −18 °C. Voucher specimens were deposited in the Herbarium of the Institute of Botany and Botanical Garden “Jevremovac,” Faculty of Biology, University of Belgrade, BEOU, voucher Nos. 17084 and 17081.
Chemicals and Instruments
All chemicals and reagents used in experiments were at least of analytical grade of purity. Organic solvents used for extraction and experimental procedures (methanol, ethanol, acetone, chloroform), as well as HCl (concentrated hydrochloric acid), CH3COOH (glacial acetic acid) and CCl3COOH (trichloroacetic acid) were purchased from Zorka Pharma, Šabac (Serbia). Gallic acid, iron (III) chloride (FeCl3 ×6H2O), iron (II) sulfate heptahydrate (FeSO4 ×7H2O), sodium acetate (CH3COONa × 3H2O) and ß–carotene were obtained from Sigma Chemicals Co., St. Louis, MO (USA). Folin-Ciocalteu phenol reagent was purchased from Merck, Darmstadt (Germany), sodium carbonate anhydrous (Na2CO3), potassium acetate (C2H3KO2) and L(+)-ascorbic acid (Vitamin C) from AnalaR Normapur, VWR, Geldenaaksebaan, Leuven (Belgium), aluminum nitrate nonahydrate [Al(NO3)3×9H2O] and 2,4,6-tris(2-pyridyl)-s-triazine (TPTZ) from Fluka Chemie AG, Buchs, (Switzerland), quercetin hydrate from TCI Europe NV, Boerenveldsweg (Belgium), and Tween 80 and linoleic acid (analytical grade) from Acros Organics, Fisher Scientific UK Ltd., Loughborough, Leicestershire, UK. The Buchi rotavapor R-114 was purchased from BÜCHI Labortechnik AG (Flawil, Switzerland), Vortex from VELP Scientifica Srl. (Usmate Velate MB, Italy), Compact Digital Rocker from Thermo Fisher Scientific (Massachusetts, USA) and Lambda Bio UV/Vis spectrophotometer from Perkin Elmer (Seer Green, UK).
Extraction
Extracts were obtained by individual ultrasonic extraction. Ten g of frozen fruits were macerated with 100 ml of methanol, ethanol, acetone and distilled water. The macerate was put in an ultrasonic bath for 1 hours before and after incubation in the dark for 24 hours. After sonication, the macerate was filtered through Whatman filter paper No. one and the solvent was removed by a rotatory vacuum evaporator (Buchi R-114 Rotavapor, BÜCHI, Switzerland). Acetone, ethanol and methanol were evaporated at a temperature up to 40 °C, while evaporation of water was performed at 60 °C. Crude extracts were kept in the fridge at 4 °C prior to use.
The samples were marked by initials indicating the place of origin (“B” for samples from Belgrade and “C” for samples from Cer) and the solvent used for extraction (“M,” “E,” “A,” and “W” for methanol, ethanol, acetone and water extracts, respectively).
Quantitative Analyses of Phenols, Flavonoids and Anthocyanins
The total phenol (TPC) and flavonoid (TFC) contents were evaluated spectrophotometrically as described Veličković et al., 32 while total anthocyanin content was determined according to Ivanović et al. 23
HPLC Analysis of Anthocyanins
Anthocyanin compounds were determined by comparing the retention time and absorption spectra of unknown peaks with reference standards. HPLC-DAD analysis was performed on an Agilent 1200 Series HPLC (Agilent Technologies, Palo Alto, CA, USA) equipped with a Licrospher® 100 RP column (5 µm, 250 × 4 mm). Mobile phase A was 10% formic acid and mobile phase B was acetonitrile using the gradient elution as follows: 1 to 7% B 0.5‐1 min, 7% B 1‐4 min, 7 to 10% B 4‐7.5 min, 10 to 14% B 7.5‐11.5 min, 14 to 25% B 11.5‐15.5 min, 25 to 40% B 15.5‐18.5 min, 40 to 75% B 18.5‐22 min, 75% B 22‐25 min, 75 to 1% B 25‐31 min. The injected volume was 10 µL and flow rate 1 mL/min. The detection wavelength was set at 520 nm.
Antioxidant Activity
The ferric reducing antioxidant power (FRAP) was evaluated as described by Benzie and Strain. 33 FRAP is a colorimetric procedure based on the capability of antioxidants to reduce ferric 2,4,6-tripyridyl-s-triazine complex (Fe3+-TPTZ) to the ferrous form (Fe2+-TPTZ), which is monitored by the increase in absorbance at 595 nm. The results were calculated from a calibration curve of FeSO4 ×7H2O aqueous solution and expressed as μmol Fe2+ equivalents per mg dw.
The total reducing capacity (TRC) was determined according to Ferreira et al. 34 and expressed as RP50 values µg/mL, extract concentrations that indicate 50% of its total reducing capacity.
The ß-carotene bleaching test was performed as described by Alam et al. 35 and results are expressed as the percentage of inhibition relative to the control by using Eq. 3:

where As and Ac are the absorbances of sample and control at the initial incubation time, respectively, and Ast and Act are the absorbances of the sample and control after incubation of 2 hours.
BHA and L ascorbic acid were used as positive controls.
Antimicrobial Activity
The antimicrobial assay was performed using a microdilution method. 36 Firstly, antibacterial activity was determined against Listeria monocytogenes NCTC 7973, Micrococcus flavus ATCC 10240, Escherichia coli ATCC 35210, Pseudomonas aeruginosa IBRS P001 and Salmonella typhimurium ATCC 13311, and antifungal activity against 3 Candida strains (C. glabrata MN12, C. albicans ATCC 10231, C. krusei MN13). Then, the minimal inhibitory (MIC), minimal bactericidal (MBC) and minimal fungicidal (MFC) concentrations were calculated.
Microplates inoculated with the yeasts, bacteria and test solutions of the extracts were incubated for 24 hours at 37 °C for bacteria and 48 hours at 37 °C for yeasts. The minimal concentration that provoked growth inhibition of the bacteria and yeasts was determined as the MIC.
MBC and MFC were determined by reinoculation of 2 µL of inoculum in 100 µL of liquid medium and incubation for 24 hours at 37 °C (bacteria) and for 48 hours at 37 °C (yeasts), after which growth was not detected. In order to visualize bacterial colonies, iodonitrotetrazolium chloride (INT) stain (2 mg/mL H2O) (Sigma-Aldrich, Munich, Germany) was used. The microorganism strains were applied to microplates, after which the stained colonies were incubated for 2 hours at 37 °C. The unstained chambers of the microplates indicated the presence of bactericidal effect, while a pale yellowish color indicated inhibition. DMSO was used as a negative control, and ampicillin (Panfarma, Belgrade, Serbia) and fluconazole (Hemofarm a.d., Vršac, Serbia) as positive controls.
Capacity of R. Discolor Ethanolic Extract to Inhibit Growth of L. Monocytogenes in Yoghurt Infusion
Yogurt. Low fat yogurt (2.8 g) produced from cow milk was purchased from a local supermarket and kept in the refrigerator at 4 °C until further analysis. All the samples were used before the expiration date of the product. The composition of the yogurt stated on the packaging was: energy 54 kcal; fat 2.8 g; proteins minimum 3.0 g and lactose minimum 3.6 g; expressed by 100 g. The packaging labeled Streptococcus thermophilus as the yogurt culture. Since this species does not produce spores, the yogurt infusion was filtered through a membrane filter (pore size 2 mm, Sigma) to remove the bacterium. The pH value of the yogurt was 4.6, and we adjusted it to 4.6 in the yogurt infusion with 0.1 n HCl. Inoculated malt agar (MA) and Mueller-Hinton agar (MHA) plates with yogurt diluted with phosphate buffered saline (PBS) at a ratio 1:10 and kept at 25°C and 37 °C for 48 hours, showed no bacterial or fungal contamination of the product.
R. discolor ethanolic extract in yogurt against L. monocytogenes. Briefly, 10 ml of yogurt was added to 90 ml of PBS in sterile flasks and homogenized for 2 minutes. Fruit ethanolic extract was added to the yogurt mixture by serial dilution. Prior to inoculation, L. monocytogenes was cultivated in TSB medium overnight and incubated for 24 hours at 37 °C. Appropriate dilutions of the culture were made after the incubation period. In order to investigate L. monocytogenes (NCTC 7973) growth, control samples containing all ingredients except R. discolor ethanolic extract were used.
The yogurt was inoculated with 104 colony-forming units (CFU) of L. monocytogenes in order to explore the activity of the extract. The experimental plate was incubated at 25 °C. The MIC and MBC were determined in the yogurt after 72 hours. The MIC of the samples was detected following the addition of 40 ml of INT (0.2 mg/mL) and incubation at 37 °C for 30 minutes. The MBC was determined by serial sub-cultivation of 10 ml into microplates containing 100 ml of TSB. The MBC was the lowest concentration that showed no growth after this sub-culturing.
Sensory evaluation. To evaluate possible changes in color, texture, flavor and overall acceptance of yogurt enriched with the ethanolic fruit extract of R. discolor at minimal inhibitory concentration, a sensory evaluation was performed. The yogurt was kept in liquid from the original packaging in order to provide adequate storing conditions as regards humidity. The group of 11 panelists was asked to read and sign informed consent before yogurt evaluation. Afterwards, the panelists were asked to evaluate changes in color, taste, texture, flavor and overall acceptance of the novel product, that is, yogurt incorporated with R. discolor fruit ethanolic extract, on a scale from 5 to 1. Acceptance was scored according to previous reports, where 1 = extremely dislike, 2 = dislike, 3 = neither like nor dislike, 4 = like; 5 = extremely like. Results were expressed as average grades given by the 11 panelists.
Statistical Analysis
All results were calculated from triplicate measurements and expressed as mean value ±standard deviation (SD). Differences between the group means and their significance were verified by one-way ANOVA using the software package STATISTICA v.7.0 program. The significance of differences was evaluated using Bonferroni’s test and statistical significance was set at P < 0.05. Correlation coefficients between total phenol, flavonoid and anthocyanin contents on the 1 side and comparative antioxidant methods on the other, were calculated using MS Office Excel 2010 and presented using Pearson’s coefficient of correlation according to Taylor. 37
Footnotes
Acknowledgments
The authors are grateful to the Serbian Ministry of Education, Science and Technological development (Project No 451‐03-68/2020-14/200178, 451‐03-68/2020-14/20000717 and 451-03-68/2020-14/ 200003).
Declaration of Conflicting Interests
The author(s) declared no potential conflicts of interest with respect to the research, authorship, and/or publication of this article.
Funding
The author(s) received no financial support for the research, authorship, and/or publication of this article.