
Abstract
Depression, a major worldwide mental disorder, leads to massive disability and can result in death. The PFC-NAc-VTA neuro circuit is related to emotional, neurovegetative, and cognitive functions, which emerge as a circuit-level framework for understanding reward deficits in depression. Neurotransmitters, which are widely distributed in different brain regions, are important detected targets for the evaluation of depression. Shuganheweitang (SGHWT) is a popular prescription in clinical therapy for depression. In order to investigate its possible pharmacodynamics and anti-depressive mechanism, the complex plant material was separated into different fractions. These in low and high doses, along with low and high doses of SGHWT were tested in animal behavior tests. The low and high doses of SGHWT were more effective than the various fractions, which indicate the importance of synergistic function in traditional Chinese medicine. Furthermore, amino acid (GABA, Glu) and monoamine neurotransmitters (DA, 5-HT, NA, 5-HIAA) in the PFC-NAc-VTA neuro circuit were investigated by UPLC-MS/MS. The level trend of DA and 5-HT were consistent in the PFC-NAc-VTA neuro circuit, whereas 5-HIAA was decreased in the PFC, Glu was decreased in the PFC and VTA, and NA and GABA were decreased in the NAc. The results indicate that the pathogenesis of depression is associated with dysfunction of the PFC-NAc-VTA neural circuit, mainly through the neural projection effects of neurotransmitters associated with various brain regions in the neural circuit. PCA and OPLS-DA score plots demonstrated the similarities of individuals within each group and the differences among the groups. In this study, SGHWT could regulate the concentration level of different neurotransmitters in the PFC-NAc-VTA neuro circuit to improve the depression, which benefitted from the recognition of the brain reward circuitry in mood disorders.
Keywords
Depression is a common chronic mental disorder, and is currently recognized by the World Health Organization (WHO) as the fourth highest contributor to the global burden of disease and is predicted to be in first place by 2030. 1 The behavior of depression can be broadly grouped into emotional, neurovegetative, and cognitive symptoms, but because they also commonly occur in other psychiatric disorders and medical diseases, detection of a depressive syndrome can be difficult. 2 The brain regions are the common site of lesion. Indeed, increasing evidence in humans and animals suggests that mood disorders and drug addiction are associated with major disruptions within the brain’s reward circuitry, which include the prefrontal cortex (PFC), the nucleus accumbens (NAc), and the ventral tegmental area (VTA). 3 Firstly, monoamine neurons have reciprocal connectivity with glutamate (Glu) neurons in the PFC, and thus the neurons of the PFC and those of the monoamines such as dopamine (DA), noradrenaline (NA) and serotonin (5-HT), are mutually inter regulatory. 4 Then, the NAc integrates limbic and cortical information that supports motivated behavior. 5 The NAc consists of 2 subregions, the core and the shell, and within these subregions, GABAergic medium spiny neurons (MSNs) predominate, making up approximately 90 to 95% of the total neuronal population and acting as the only projection neuron. 6 DA from the NAc and Glu from several brain nuclei converge in the NAc to drive motivated behaviors. Lately, although the VTA is mainly characterized by the presence of DA neurons, several other neuronal cell types and their input and output structures contribute to adaptive and pathological neurological processes related to motivation and reward. Identification of the different neuronal subpopulations is fundamental to understanding their role in the VTA circuitry and in specific aspects of behavior. 7 Briefly, the PFC-NAc-VTA neuro circuit displays an important position in mediating reward-related behaviors. Moreover, in a very simple view of brain function, it could be stated that the several neurotransmitters are necessary for the life of the brain, whereas the DA, NA and 5-HT are necessary for the quality of life.
Understanding of the pathophysiology of depression has progressed considerably, but no single model or mechanism can satisfactorily explain all aspects of the disease. The main hypotheses include the monoamine hypothesis, 8 hypothalamic–pituitary–adrenal axis (HPA) changes, 9 inflammation-peripheral cytokine, 10 neuroplasticity and neurogenesis, 11 structural and functional brain changes, 12 genes, 13 environmental factors, 14 and epigenetics. 15 At present, conventional antidepressants are used in the clinic based on the neurotransmitter hypothesis, 16,17 for instance, SSRIs (citalopram, escitalopram, fluoxetine, fluvoxamine, paroxetine, sertraline, vilazodone, vortioxetine), SNRIs (desvenlafaxine, duloxetine, levomilnacipran, venlafaxine), SARIs (nefazodone, trazodone), NDRIs (Buproprion), NaSSAs (mirtazapine), and NaRIs (reboxetine). 18 However, these drugs usually have different levels of side effects, such as headaches, nausea or vomiting, agitation, sedation, and sexual dysfunction. 19 Based on these, there has been little notable progress in the development of drugs to treat depression over the last few decades. 20 Therefore, researchers are always searching for new, alternative, improved therapeutic approaches to treat depression, and the intention to develop next-generation drugs with improved safety profiles has intensified.
In numerous studies, traditional Chinese Medicine (TCM) as a method for meeting the demands for higher remission rate, faster onset, persistent antidepressant action, and fewer adverse effects is attracting increasing attention from the whole world. 21 -23 TCM is one of the oldest medical systems in the world, which includes Chinese herbal medicine, acupuncture, and massage. In China, the population has taken advantage of TCM in medicine and daily life for centuries. Meanwhile, the modernization of TCM as a cultural treasure is necessary and important for the national strategy “the Belt and Road Initiative.” Compared with Western medicine, the ingredients of TCM are complex, as are the prescriptions. In recent decades, Chinese researchers have use advanced analytical methods and technologies to find useful drug leads, including the screening of crude herbal extracts, active fractions, and pure compounds for bioactivity. In reality, TCM has been widely used in the treatment of depression, achieving better therapeutic effects than placebo and having fewer side effects than conventional antidepressants.24 In this study, modified Sinisan is a clinical experience prescription for antidepression, which is based on Sinisan from Zhang Zhongjing’s “On Cold Damage.” In order to verify the efficacy by modern methods and investigate the material basis for the efficacy of SGHWT, different fractions have been prepared and several neurotransmitters in the PFC-NAc-VTA neural circuit that maybe related to the mechanism of depression have been detected.
Experimental
Chemicals and Reagents
SGHWT consist of 9 Chinese herbs: 10 g of Chai Hu (Bupleurum chinense DC), 10 g of Zhi Shi (Citrus aurantium L.), 10 g of Bai Shao (Paeonia lactiflora Pall), 10 g of Yu Jin (Curcuma wenyujin Y. H. Chenet C. Ling), 10 g of Sha Ren (Amomum villosum Lour.), 15 g of Bai Zhu (Atractylodes macrocephala Koidz.), 6 g of Huang Lian (Coptis chinensis Franch.), 6 g of Wu Zhu Yu (Euodia rutaecarpa (Juss.) Benth.), and 6 g of Gan Cao (Glycyrrhiza uralensis Fisch.). The herbs were purchased from Hubei Jointown Pharmaceutical Group Co., Ltd. (Hubei, China). Dopamine (DA), 5-hydroxy tryptamine (5-HT), γ-aminobutyric acid (GABA), glutamic acid (Glu), noradrenaline (NA), 5-hydroxyindole acetic acid (5-HIAA), and 3, 4-dihydroxybenzylamine (IS) were purchased from Sigma-Aldrich (St. Louis, MO, USA), Fluoxetine from Eli Lilly Pharmacy Co., Ltd. (Suzhou, China), and formic acid, light petroleum, dichloromethane, ethyl acetate, n-butanol, anhydrous ethanol, pentobarbital sodium and sodium hydroxide from Tianjin Fu Yu Fine Chemical Co., Ltd. (Tianjin, China). Polysorbate-80 and sucrose were supplied by Sinopharm Chemical Reagent Co., Ltd. (Shanghai, China), methanol by Sigma Chemicals (St. Louis, MO, USA), and LC-MS grade acetonitrile by Fisher Scientific (Fair Lawn, NJ, USA). Ultrapure water was obtained from a Milli-Q Gradient water system (Millipore, MA, USA).
Preparation of SGHWT and Different Fractions
SGHWT was obtained by normal water distillation, concentration and drying. The different fractions were prepared following the solvent extraction method based on the chemical structure. Firstly, the volatile oil fraction was extracted by steam distillation, with a yield of 0.52%. Then, ethanol was added to the water to obtain the polysaccharide fraction, with a yield of 9.21%. After filtration, the supernatant liquor was extracted with light petroleum, trichloromethane, ethyl acetate, and n-butanol in turn to obtain terpenoid, alkaloid, phenolic acid, and saponin fractions with yields of 0.09%, 0.35%, 0.83%, 4.01%, respectively. The whole preparation process is shown in Figure 1.

Preparation of the different fractions of SGHWT.
The dose for intragastric administration was calculated based on the clinical equivalent dose for an adult according to Experimental Methodology of Pharmacology. All the rats were treated by intragastric administration. Rats were administrated with 0.9% sodium chloride solution for the control and model groups; with doses of 3.67 and 14.68 g/kg for the SGHWT low and SGHWT high groups, respectively; with doses of 0.018 and 0.073 g/kg for the volatile oil low and high groups; with doses of 0.56 and 2.22 g/kg for the polysaccharide low and high groups; with doses of 0.0029 and 0.012 g/kg for the terpenoid low and high groups; with doses of 0.013 and 0.052 g/kg for the alkaloid low and high groups; with doses of 0.034 and 0.13 g/kg for the phenolic acid low and high groups; with doses of 0.15 and 0.59 g/kg for the saponin low and high groups; and with a dose of 1.58 mg/kg for the fluoxetine group. The time of intragastric administration for all treatment groups was 7 days after modeling for 3 weeks.
Rat Treatment
The animal care and all the experimental procedures abided by the National Institutes of Health Guide for Care and Use of Laboratory Animals. Sprague-Dawley male rats (120 ± 20 g) were obtained from the Experimental Animal Center of Hubei Province (License: SYXK (E) 2017‐0067, Wuhan, China). The rats were housed in cages for at least 1 week and fed with food and water simultaneously before experimentation.
Chronic unpredictable mild stress (CUMS), combined with social isolation, was applied to prepare a depression model for 3 weeks. Each rat (except in the control group) received different stimulation, including food deprivation for 24 hours, water deprivation for 24 hours, tail-squeezed for 1 minutes, swimming at 4 °C for 5 minutes, shaking for 10 minutes, illumination overnight and foot shock (10 times). Stressors were randomly chosen so as to be unpredictable. After the modeling was finished, behavioral experiments were used to investigate whether the depression model was successful. Later, rats were divided into the following groups (n = 10), including a control group, a model group and other treatment groups, as shown in Table 1.
Details of Treatment Groups.

UPLC-MS/MS Analysis
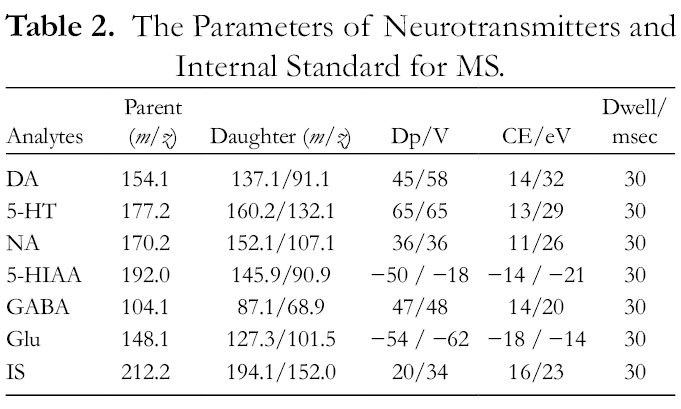
UPLC-MS/MS analysis was performed on an AB 4500 QTRAP Mass spectrometer (AB SCIEX, USA) equipped with an ESI source operated in positive and negative ionization modes and an LC-30 AD UPLC system with auto-sampler (Shimadzu, Japan). Chromatographic separation was achieved with an Agilent ZORBAX SB-C18 column (2.1 mm × 100 mm, 1.8 µm) at a temperature of 40 °C. Formic acid in water (0.1%) was used as the mobile phase A, and 0.1% formic acid in acetonitrile was used as mobile phase B. The gradients were 0‐2 min, 5% B; 2‐4.5 min, 5% to 90% B; 4.5‐6.5 min, 90% to 90% B; 6.5‐6.6 min, 90% to 5% B; 6.6‐8 min, 5% B with a flow rate of 0.4 mL/min. The temperature of the auto-sampler was maintained at 4 °C. The following parameters were employed: Ion Spray Voltage 5500 V (−4500 V), source temperature 550 °C, ion source gas 1 60 Psi, and ion source gas 2 65 Psi; the optimized multiple reaction monitoring parameters for the neurotransmitters and IS are shown in Table 2.
The Parameters of Neurotransmitters and Internal Standard for MS.
Calibration Curve Preparation
The standard stock solutions, except Glu, were prepared by dissolving the appropriate amount of the neurotransmitter in methanol. The standard stock solution of IS was prepared in the same way. For Glu, the standard stock solution was prepared in ultrapure water. The blank sample was homogenized in a four-fold volume with methanol. A series of working solutions of the blank sample for 5-TH, 5-HIAA, NA, and DA (0.01, 0.02, 0.05, 0.1, 0.2, 0.5, 1 µg/mL), for Glu (0.2, 0.4, 1, 2, 4, 10, 20 µg/mL), and GABA (0.1, 0.2, 0.5, 1, 2, 5, 10 µg/mL) were prepared with a 5% solution of acetonitrile in water. These standards were prepared by adding the appropriate amount of the standard stock solutions to the blank sample homogenates. Quality Control (QC) samples were prepared by the addition of 3 different levels of standards to the blank samples (n = 6/level). A working solution for the IS (100 ng/mL) was also prepared. The solutions were stored avoiding light.
Brain Sample Preparation
The rats were rapidly decapitated and their brains removed under anesthesia. Then the tissues of PFC, NAc, and VTA were obtained from the skull on an ice plate, frozen and stored at −80 °C until extraction. The brain tissue was homogenized in a four-fold volume of ice cold methanol. The homogenate was centrifuged at 12 000 rpm for 20 minutes at 4 °C. Then the supernatant was concentrated under a nitrogen stream. The residue was reconstituted in 400 µL ultrapure water (5% acetonitrile) and vortex-mixed for 30 s. The mixture was centrifuged in the above way. Then the supernatant with 20 µL IS (180:20, v/v) was injected into the UPLC-MS/MS system for analysis.
Sucrose Preference Test (SPT)
According to previous study, rats were trained to adapt to a 1% sucrose solution (w/v) before the test. After adaptation, the rats were deprived of food and of water for 24 hours, then 2 bottles containing 1% sucrose solution and tap water were placed on each cage (rats of the blank group were housed in individual cages at this time). After 1 hours, consumption of sucrose and water was measured and the sucrose preference was calculated as the ratio of 1% sucrose consumption and the total consumption of liquid.
Open Field Test (OFT)
This experiment was carried out in a quiet house. The apparatus consisted of a test container (40 cm × 60 cm × 50 cm) and computer tracking system. The container, equipped with a video camera, was divided into 16 equal squares. The rats were placed around the container. Then, each rat’s activity was monitored by computer, including total distance, zone crossing and rest duration. The container was cleaned thoroughly with 70% ethanol and dried between each test.
Forced Swimming Test (FST)
The rats were individually forced to swim in a glass cylinder (40 cm × 40 cm × 60 cm) filled with water at 25 ± 1 °C to a depth of 20 cm. Rats were allowed to swim for 6 minutes, and the immobility time was recorded during the last 4 minutes. Immobility was defined as floating motionless without struggling in the water and keeping head above water.
Method Validation
The method was validated in accordance with current acceptance criteria for bioanalytical method validation (Food and Drug Administration). Calibrations were performed using 7 standards. The linear calibration equation (Y = aX + b) was generated using the ratio of analyte peak area over IS peak area after quantitative integration with 1/x 2 weighting factor. The limit of detection (LOD, S/N = 3:1) was calculated from calibration curves (based on standard deviation of response and slope). The intra-day precision and accuracy were obtained by determining 3 different QC samples (n = 5) on the same day. The inter-day precision and accuracy were evaluated by determining 3 different QC samples (n = 15) over 3 consecutive days. The extraction recovery and matrix effect assay were carried out with low, medium and high QC samples. The area of QC samples was recorded as A. The area of standards in pure solvent was recorded as B. The area of blank tissue added with a known concentration of standards after extraction was recorded as C. The area of blank tissue was recorded as D. The value of (A-D)/B × 100% was considered as the matrix effect. The value of A/C × 100% was considered as the extraction recovery. All the results of the tested samples were within the acceptable criteria (RSD% not more than 15%; RE% within 15%), which indicated that the retention times have a good reproducibility.
Stability of the analytes during the sample storing and processing procedures was thoroughly evaluated by analyzing QC samples of 3 different concentration levels, and each concentration was prepared in 3 replicates. The measured concentration of the 6 analytes at each QC level only varied within ±15.0%, which demonstrated that they were stable in samples at room temperature for 24 hours, at 4 °C in the autosampler for 8 hours, and after 3 freeze-thaw cycles at under −80 °C.
Statistical Analysis
All data were expressed as mean ± SD. Statistical analysis was performed by one-way ANOVA using GraphPad Prism 7. A value of P < 0.05 was considered statistically significant for analysis.
Results and Discussion
Results of Rat Behavior Test
Effects of different groups on sucrose preference in the SPT
The results of the sucrose preference test are illustrated in Figure 2. The sucrose preference of rats in the model group was significantly reduced compared with the control group. On the contrary, SGHWT L significantly increased the sucrose preference (P < 0.01), while Fluoxetine, SGHWT H, volatile oil H, polysaccharide L, terpenoid H, and phenolic acid H also improved the sucrose preference (P < 0.05).
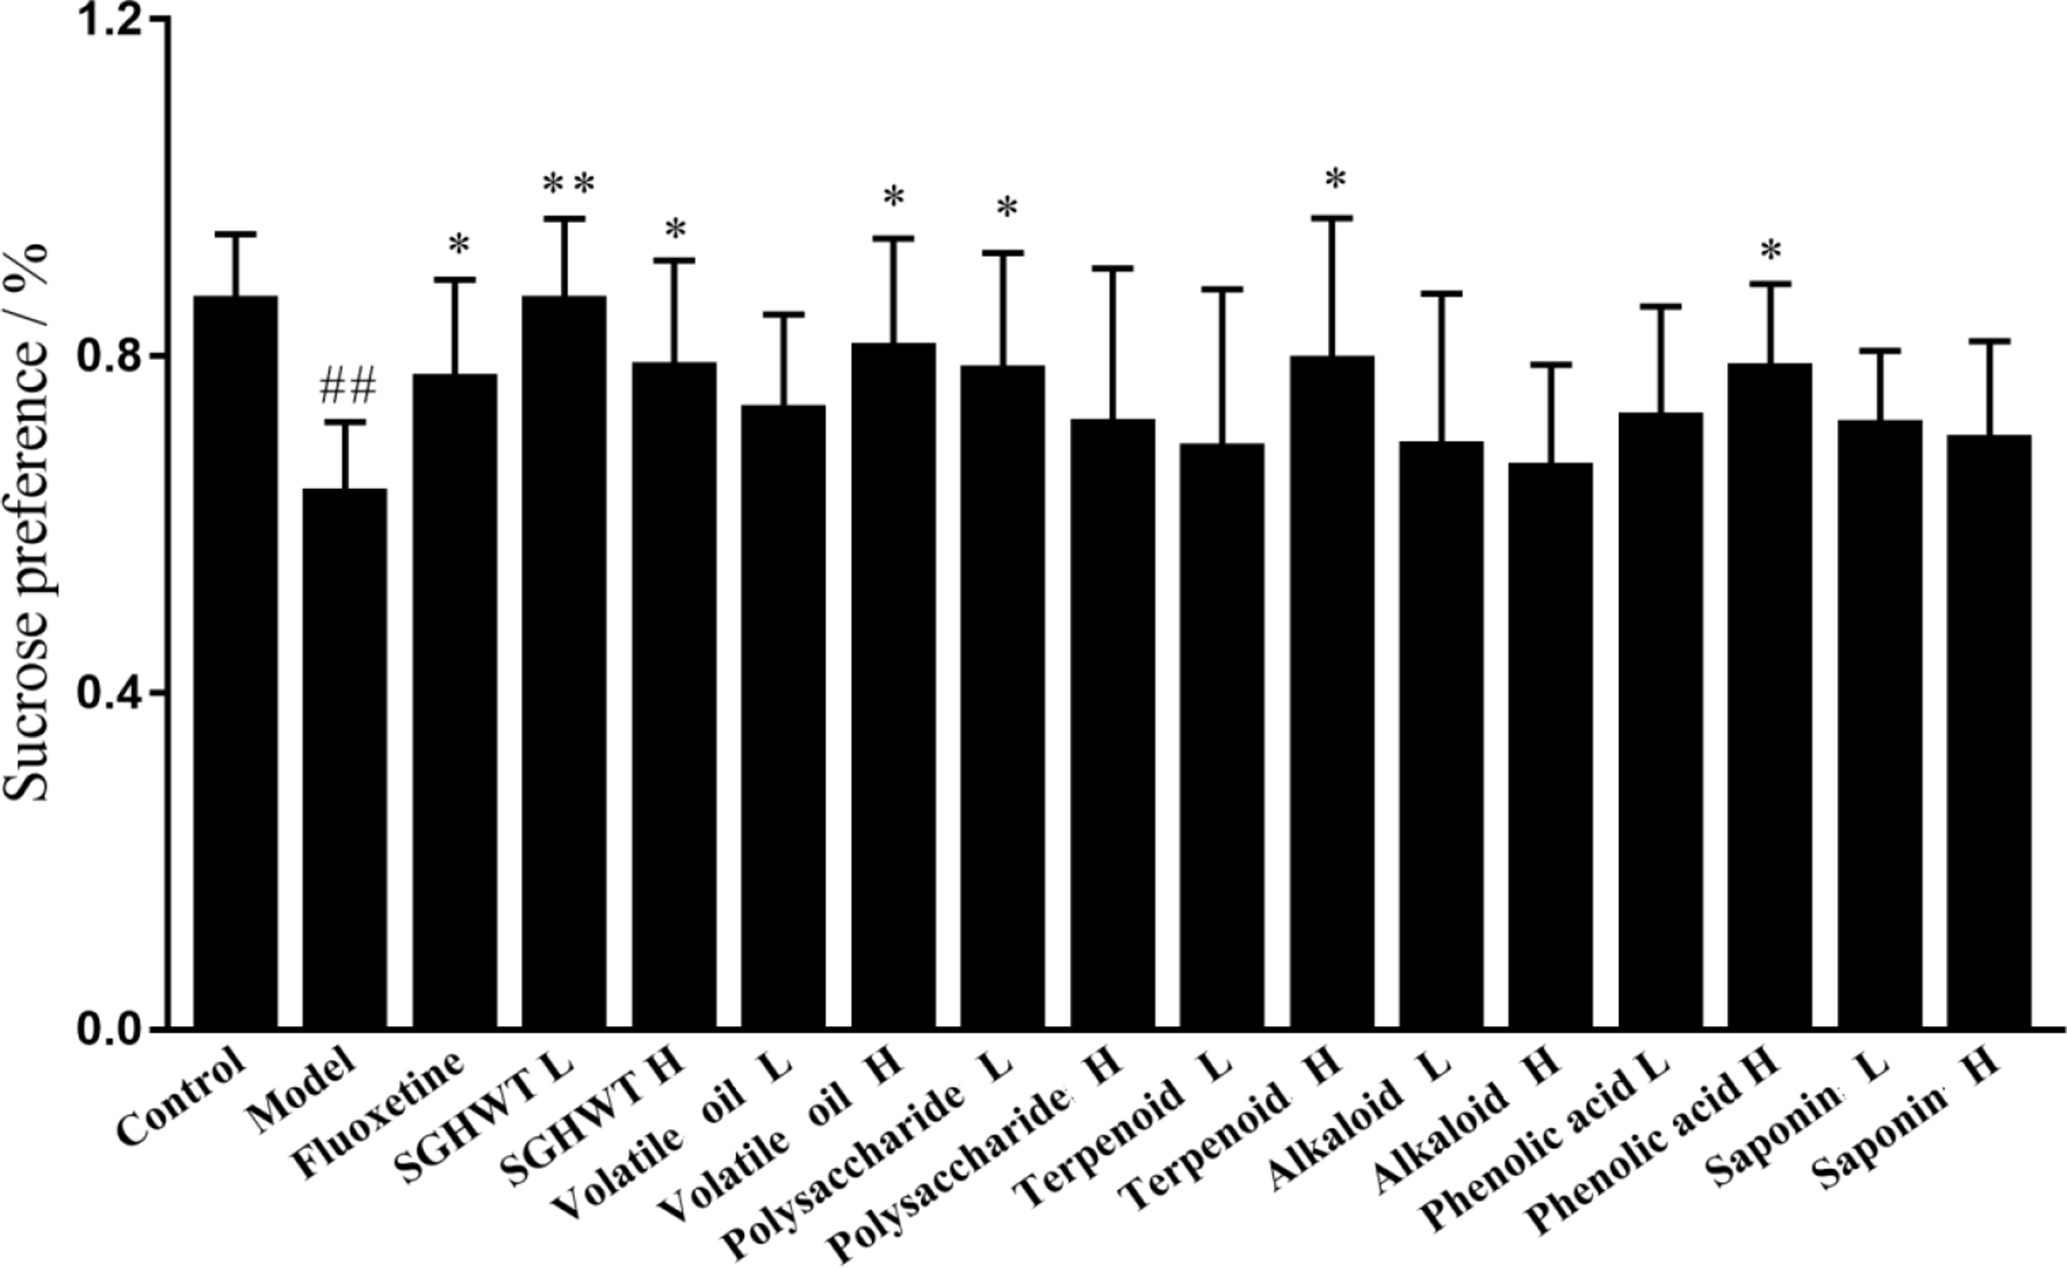
Effects of different groups on the sucrose preference in the SPT (n = 10). ## P < 0.01 vs control group; **P < 0.01, *P < 0.05 vs model group.
Effects of different groups on total distance and zone crossing in the OFT
The OFT was estimated after 1 week with treatment of each drug and the data are shown in Figure 3(A) and (B). The total distance and zone crossing in the model group were significantly increased in comparison with the control group (P < 0.01 or P < 0.05). The total distance and zone crossing in the Fluoxetine, SGHWT L, SGHWT H, polysaccharide L, and terpenoid H (P < 0.01 or P < 0.05) groups were obviously increased compared with the model group after intragastric administration.
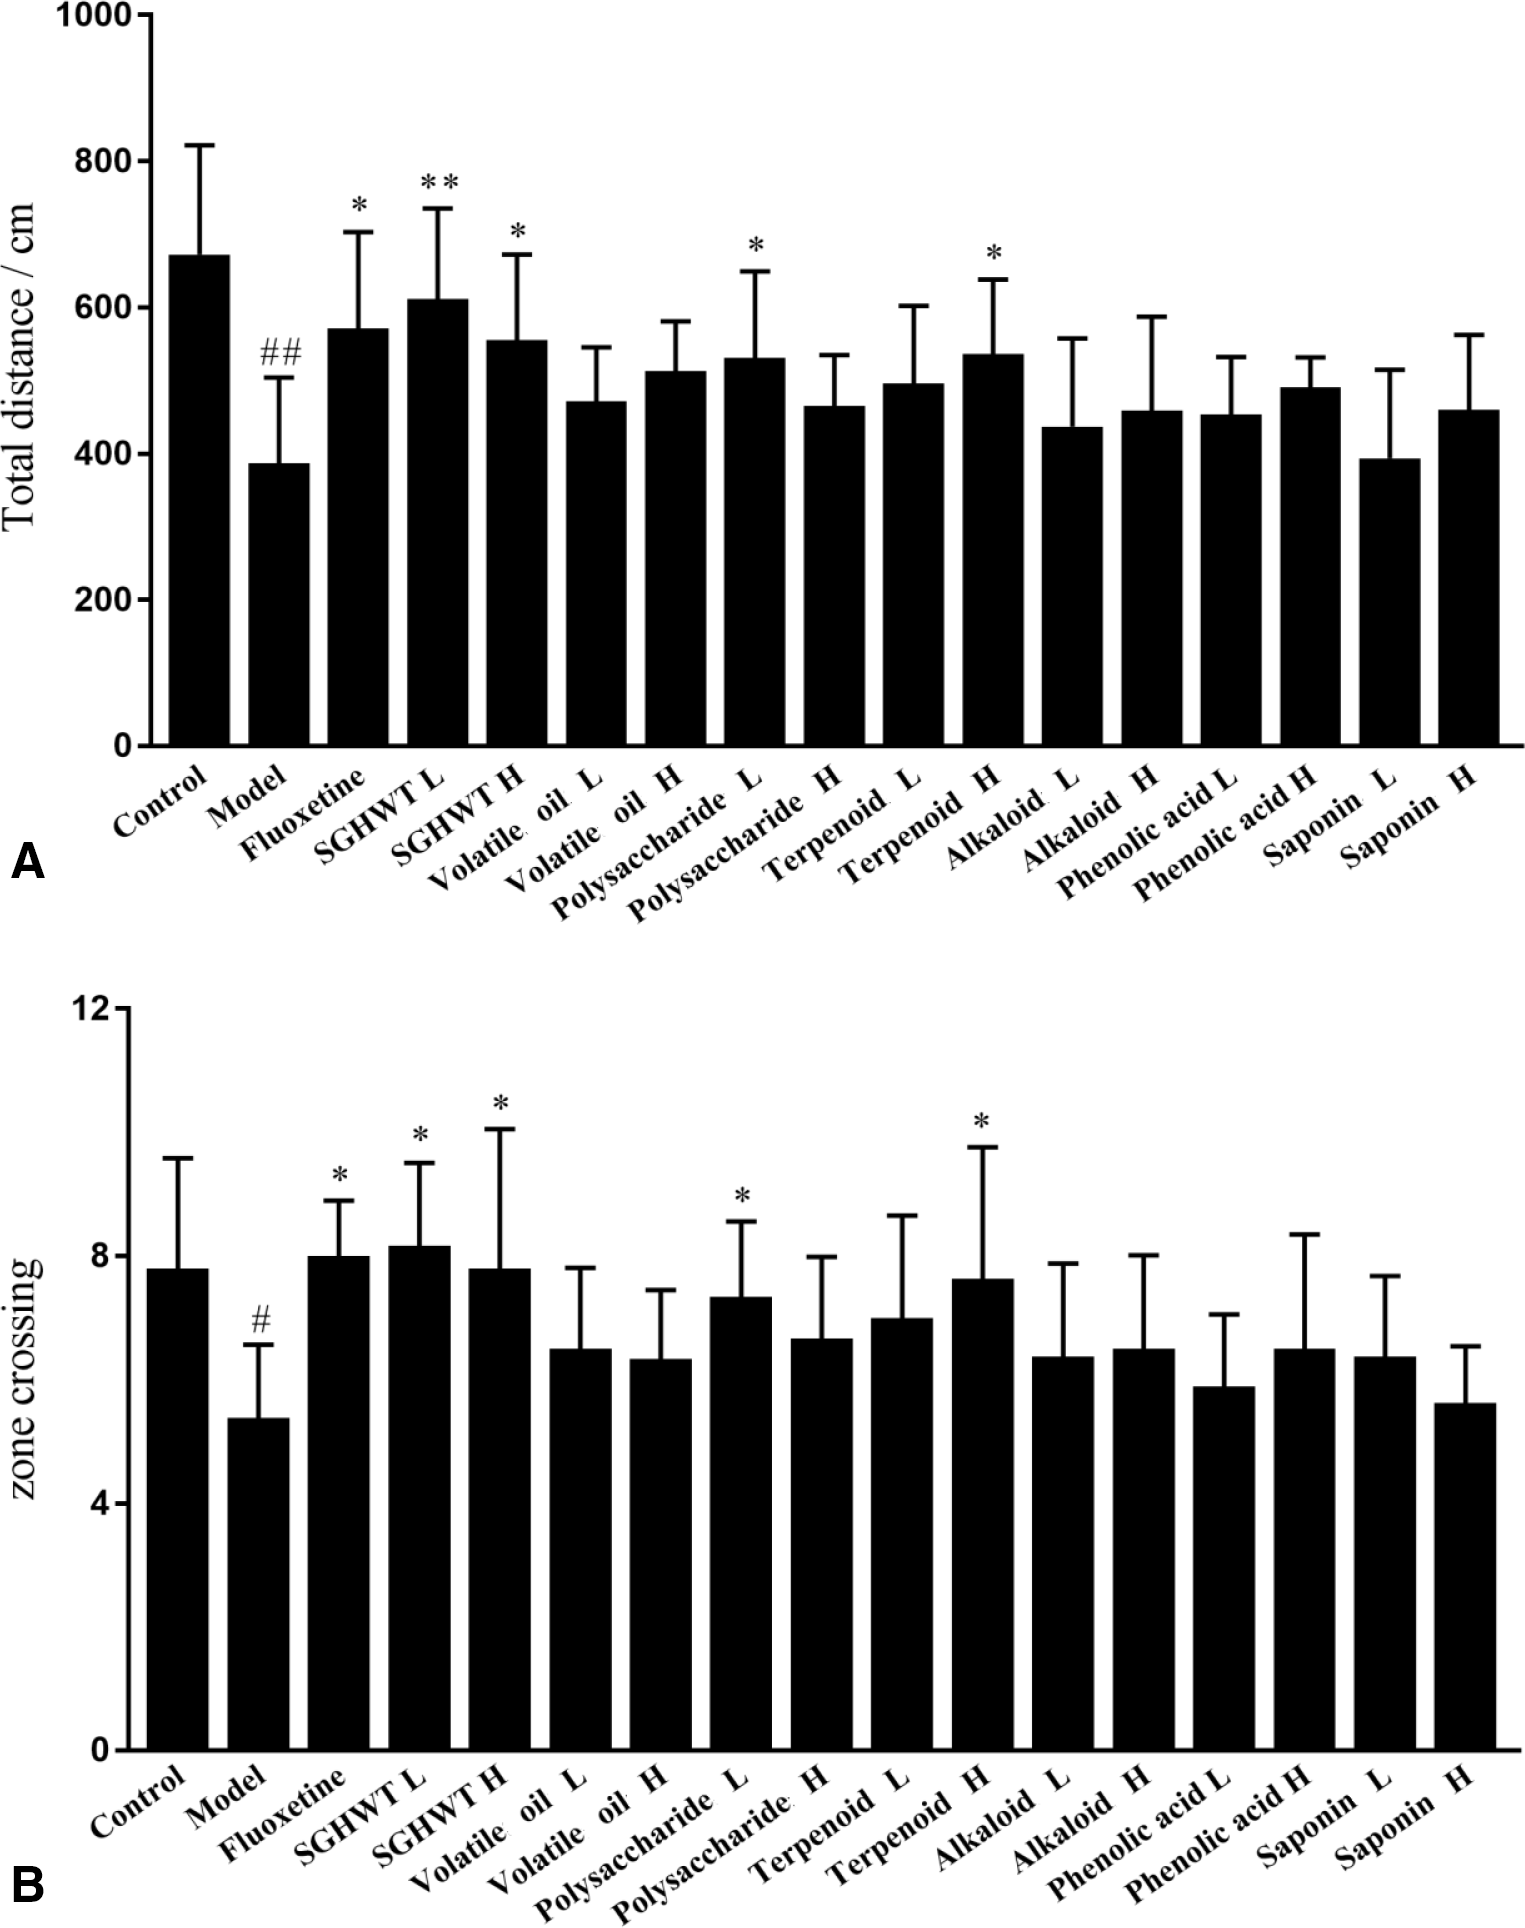
(A) Effects of different groups on total distance in the OFT (n = 10). ## P < 0.01 vs control group; **P < 0.01,*P < 0.05 vs model group. (B) Effects of different groups on zone crossing in the OFT (n = 10). ## P < 0.01 vs control group; **P < 0.01, *P < 0.05 vs model group.
Effects of different groups on immobility time in the FST
FST is the most commonly used behavioral test for evaluating antidepressants, and the data of FST are shown in Figure 4. Rats in the model group showed an increase in immobility time when compared with the control group. Meanwhile, SGHWT L (P < 0.01), Fluoxetine, SGHWT H, volatile oil L, polysaccharide L, and terpenoid H (P < 0.05) reduced the immobility time in the depression model rats.

Effects of different groups on immobility time in the FST (n = 10). ## P < 0.01 vs control group; **P < 0.01, *P < 0.05 vs model group.
Based on the results of the behavior test, the main effective fractions for anti-depression include SGHWT L, H, polysaccharide L, and terpenoid H (P < 0.01 or P < 0.05), which show the importance of synergistic effects in traditional Chinese medicine.
Method Development and Optimization
The chromatographic conditions were optimized to improve the peak shapes, increase the sensitivity, and to have short retention times. Different mobile phases were investigated and it was shown that acetonitrile and 0.1% formic acid was the best mobile phase. The flow rate and column temperature were also investigated. As a result, 0.4 mL/min was selected as the best flow rate, and 40 °C as the ideal column temperature. For the MS conditions, optimization was performed in both negative and positive ion mode to select the precursor ions, and through the software automatic tuning function to optimize cone voltage and collision. Because of the tendency to oxidation, the analysis time should be as short as possible. Although the retention times of some neurotransmitters were very close, MS/MS detection could analyze target compounds qualitatively and quantitatively from characteristic ion pairs.
Method Validation
The regression equation, correlation coefficient, linear range, and LOD of the analytes are shown in Table 3. All analytes exhibited good linearity over the concentration range of 0.01 ng/mL to 1 ng/mL for DA, 5-HT, NA and 5-HIAA; 0.1 ng/mL to 10 ng/mL for GABA; and 0.2 ng/mL to 20 ng/mL for Glu. The correlation coefficient (R) of all analytes was above 0.99.
The Linearity and LOD of Neurotransmitters.

The results for the precision and accuracy of the validation method are summarized in Table 4. The intra- and inter-day precisions ranged from 2.29% to 10.91% and 3.28% to 12.91%, respectively, while the accuracy ranged from -12.96 to 13.8% for all the QC levels, which indicated that the method has acceptable precision and accuracy.
Results of Precision, Accuracy, Recovery, Matrix Effect, and Stability.

The mean extraction recoveries of the 8 analytes were more than 87.4% at different concentration levels (Table 4), which is an acceptable value. The matrix effect of the analytes ranged from 91.5% to 109.0% at 3 concentration levels (Table 4). The results indicated that there was no significant matrix effect for the analytes.
The stabilities of all analytes under 3 conditions are shown in Table 4, which demonstrated that they were stable in the biosamples at room temperature for 24 hours, at −80 °C for 3 freeze-thaw cycles, and at 4 °C in the auto-sampler for 8 hours. This result is well within the acceptable limits.
Effects of different groups on the level of DA in PFC-NAc-VTA neural circuit
The results are shown in Table 5. The level of DA in the PFC-NAc-VTA neural circuit of the rats stimulated by CUMS was significantly decreased when compared to the control group (P < 0.01 or P < 0.05). However, when compared with the model group, the levels of DA in PFC of the Fluoxetine, SGWHT L (P < 0.01), SGHWT H, polysaccharide H, and terpenoid H groups were significantly improved (P < 0.05); the level of DA in the NAc of SGWHT L (P < 0.01), Fluoxetine, SGHWT H, polysaccharide H, and terpenoid H groups was significantly improved (P < 0.05), and the level of DA in VTA of the Fluoxetine, SGWHT L, volatile oil H, and terpenoid L groups was also increased (P < 0.05).
Effects on Different Groups After Administration on the Level of Monitored Neurotransmitters in PFC-NAc-VTA Neural Circuit (N = 8, Mean ± SD).

Note: ##P < 0.01, #P < 0.05 vs the control group; **P < 0.01, *P < 0.05 vs the model group.
The PFC at the central executive of the brain is crucially involved in functions that enable cognitive control, such as stimulus selection, working memory, rule switching, decision making, and others. These cognitive functions are heavily influenced by the neuromodulator DA. 24 The NAc is a small part of the brain that plays an important role in motivated behaviors, reinforcement learning, and reward processing. Sometimes called the brain’s “pleasure center,” this cluster of neurons modulates the effects of the neurotransmitter DA, on which many neural circuits depend. DA projections from the VTA to the NAc comprise the mesolimbic DA system. 25 Dysfunction of this system has been implicated in neuropsychiatric disorders such as substance abuse disorder and depression. 26,27 The VTA is a complex and heterogeneous midbrain area. The main neuronal type within the VTA is DA neurons, which represent 60% of all VTA neurons. Dopamine neurons of the VTA are most widely known for their role in reward processing. The activation of VTA’s DA neurons results in increments of DA release in the NAc and behavioral changes, such as increments in locomotor activity. 28 In this research, the DA level in the PFC-NAc-VTA neural circuit was decreased for the model group. After treatment, the level of DA increased to normal, which indicates that SGHWT and several effective fractions could update the DA concentration to improve the situation of depression.
Effects of different groups on the level of 5-HT in the PFC-NAc-VTA neural circuit
The results illustrated in Table 5 indicate that rats of the model group showed a significant decrease in the level of 5-HT in the PFC-NAc-VTA neural loop (P < 0.01 or P < 0.05). However, when compared with the model group, the level of 5-HT in the PFC of SGWHT L (P < 0.01), Fluoxetine, SGHWT H, volatile oil H, and polysaccharide H group was significantly improved (P < 0.05); the level of 5-HT in the NAc of SGWHT L, SGHWT H, and the terpenoid groups was improved (P < 0.05); and the levels of 5-HT in the SGWHT L and polysaccharide H groups were also improved (P < 0.05).
The central serotonin (5-HT) pathways are involved in many physiological functions such as sleep, sex, locomotion, food intake, pain modulation, mood, stress, and thermoregulation. 29 They can exert excitatory and/or inhibitory effects on PFC neurons via activating pre- and/or post-synaptic 5-HT receptors associated with glutamate/GABA transmissions. 30 The overall effects are contingent on the 5-HT receptor subtype(s) activated, the 5-HT concentration, and the cell type of the specific PFC neurons. 31 Primary research shows that dysfunction and/or manipulation of the 5-HT signaling system within the PFC is causally associated with the pathogenesis and treatment of psychological disorders (eg, depression, anxiety, and schizophrenia). 32,33 Serotonin-containing neurons make extensive connections to other neural systems in reward-related brain areas. 34 Innervation by clusters of serotonergic cell bodies is extensive, diffuse, and overlapping, and includes areas known to be involved in aversion- and reward-related regulation, such as the NAc, VTA, substantia nigra, hippocampus, amygdala, and PFC. 35 In addition to having reciprocal connections with many reward related brain areas, 5-HT regulates the transmission of all major neurotransmitters. 36 Moreover, the VTA is a key area for thermoregulation, and 5-HT, but neither DA nor NA, modulates the heat loss system through action in the VTA. 37 In this research, the variation between the model group and treatment group is similar to that of DA, which means that the concentration of 5-HT is also important to control the balance of the PFC-NAc-VTA neural circuit.
Effects of different groups on the level of NA in the PFC-NAc-VTA neural circuit
The results are summarized in Table 5. NA levels of the model group obviously decreased in the PFC and VTA (P < 0.01 or P < 0.05), and increased in the NAc (P < 0.05) compared with the control group. In the PFC and VTA, Fluoxetine, SGHWT L, and polysaccharide H (P < 0.01 or P < 0.05) improved the levels of NA, and SGHWT L and volatile oil H reduced the levels of NA in the NAc, when compared with the model group (P < 0.05).
Noradrenaline (NA) is released supraspinally, spinally and peripherally at sites expressing adrenoceptors, such as the neurons in the locus coeruleus, spinal cord and immune cells. NA is involved in the intrinsic control of pain-inducing pronociceptive effects in the primary afferent nociceptors. 38 It is widely thought that NA is released in PFC during salient behavioral phases such as memory encoding, 39 novelty detection, 40 attentional guidance, 41 and stressful experience. 42 The released NA is believed to modulate cognitive functions carried out by the PFC, and previous research found that NA can lastingly depress glutamatergic synapses in rat PFC neurons through mechanisms involving α-adrenoceptors, NMDA (N-methyl-D-aspartate) receptors, and the activation of postsynaptic ERK1/2. 43 Moreover, decreased NA and/or 5-HT may subsequently cause the augmentation of DA in NAC, a structure crucially involved in motivation circuits. 44 The NA system is well positioned to control the activity of distinct VTA neuronal populations both at the level of midbrain cell bodies and axon terminals innervating the VTA. 45 In addition, studies using both anterograde and retrograde tracing techniques have proven an anatomical connection between the NAergic brain nuclei. Both the area A1 and A2 cell groups, situated within the caudal part of the nucleus of the solitary tract and the locus coeruleus, the main source of NA in the central nervous system, have been shown to send projections to the VTA. 46 Accordingly, noradrenergic signaling in the VTA via α1-AR regulates formation and retrieval of fear memories, but no other behavioral responses to stressful environmental stimuli. It enhances the encoding of environmental stimuli by the VTA to form and retrieve conditioned fear memories and to predict future behavioral outcomes. 47 In this research, the concentration of NA was increased in the NAc, and decreased in PFC and VTA for the model group. After treatment, the level of NA can be dropped in the NAc to increase the concentration of DA, and the trend of NA in PFC and VTA is similar to DA and 5-HT.
Effects of different groups on the level of 5-HIAA in the PFC-NAc-VTA neural circuit
The concentrations of 5-HIAA in the PFC-NAc-VTA neural circuit are shown in Table 5. The level of 5-HIAA in the model group was significantly up-regulated in the PFC (P < 0.01), and down-regulated in the NAc and VTA (P < 0.05). Besides, when compared with the model group, the level of 5-HIAA in the PFC of the Fluoxetine, SGWHT L, volatile oil H, and terpenoid H groups was significantly lowered (P < 0.05); the level of 5-HIAA in the NAc and VTA of the SGWHT L and polysaccharide H groups was obviously increased (P < 0.05).
5-Hydroxyindolacetic acid (5-HIAA) is the metabolite of serotonin. Reduced serotonergic transmission is a well-known characteristic of the pathogenesis of depression. 48 As we know, selective serotonin reuptake inhibitors (SSRIs) constitute the first line of treatment in depressive disorders. 49 Typically, single dose administration of SSRIs results in a rapid increase in the mean extracellular levels of 5-HT, as well as in a decrease in 5-HIAA levels in the PFC. 50 In this research, the concentration of 5-HIAA was increased in the model group and decreased in the treatment group for PFC. The trend of 5-HIAA in the VTA and NAc is similar to that of DA and 5-HT.
Effects of different groups on the level of GABA in the PFC-NAc-VTA neural circuit
The concentrations of GABA in the PFC-NAc-VTA neural circuit are shown in Table 5. After CUMS induction, GABA levels of the model group in PFC and VTA were obviously decreased when compared with the control group, which was on the opposite side of NAC (P < 0.01 or P < 0.05). Compared with the model group, GABA levels in the PFC of the Fluoxetine, SGHWT L, SGHWT H, and polysaccharide L groups displayed a significant increase (P < 0.01 or P < 0.05); GABA levels in the NAc of the Fluoxetine, SGHWT L, SGHWT H, and volatile oil H groups were significantly decreased (P < 0.01 or P < 0.05), whereas treatment with Fluoxetine, SGHWT L, SGHWT H, polysaccharide H, and terpenoid H apparently elevated the level in the VTA (P < 0.01 or P < 0.05).
The inhibitory neurotransmitter GABA has been implicated as one of a number of neurotransmitter systems that regulate sociability. Indeed, wide spread reductions in GABA transmission decrease sociability in the social preference test. 51 Decreasing GABA transmission in PFC decreased sociability. Thus, changes in GABA signaling observed in conditions such as depression may mediate the social withdrawal characteristic of these conditions. 52 Furthermore, dysfunction of circuits involving GABAergic neurons in the PFC likely plays a role in the cognitive impairments, which possible mechanism involves endogenous kynurenic acid regulation of extracellular GABA levels in rat PFC. 53 For NAc, it provides one of the most prominent projections. 54 Thus, deciphering the architecture and the function of the NAc projections to the VTA would provide an invaluable insight into the rules governing the information flow in and out of the VTA. 55 Moreover, the NAc medial shell controls mesolimbic DA subtypes via distinct GABA receptor classes and the lateral shell is a central node of the reward system. 25 The VTA contains a mixture of DA (~65%), GABAergic (~30%), and glutamatergic neurons (~5%) that may act in concert to orchestrate reward-seeking behavior. In vivo, DA neurons are thought to be tonically inhibited by GABA neurons within the VTA and the rostromedial tegmental nucleus. 56 These midbrain GABA neurons display elevated basal firing rates and a lack of spike accommodation. In addition, VTA GABA neurons increase their firing during cues that predict appetitive rewards and also show a transient increase in activity following adverse stimuli. 57 Importantly, GABAergic neurotransmission in the VTA is drastically altered by exposure to drugs of abuse, 58 which may result in aberrant activity in DA neurons and could promote maladaptive behaviors. 59 In this research, the concentration of GABA was decreased in the model group, but increased in the treatment group for PFC and VTA, which is consistent with DA. The trend of GABA in NAc is similar to NA, but opposite to DA, 5-HT and 5-HIAA.
Effects in different groups on the level of Glu in the PFC-NAc-VTA neural circuit
The level of Glu was increased in the PFC and VTA, but reduced in the NAc of the model group compared with the control group (P < 0.01) (Table 5). When compared with the model group, the Fluoxetine, SGHWT L, volatile oil H, and polysaccharide H groups in the PFC, and the SGHWT L and terpenoid H groups in the VTA had reduced levels of Glu (P < 0.01 or P < 0.05). Conversely, the Fluoxetine, SGHWT L, SGHWT H, and volatile oil H groups in the NAc had increased levels of Glu (P < 0.05).
Glutamate neurotransmission is associated with abnormalities in mood and psychotic disorders. Meta-analyzes of 1H NMR spectroscopic studies indicated that major depressive disorder (MDD) was associated with lower glutamate and/or glutamine levels in the cortical and subcortical brain regions. 60 Previous studies have shown alterations in glutamate signaling with the PFC playing a role in addiction-like behaviors. Abnormalities in prefrontal functioning lead to compulsive drug taking and impairments in the executive function needed for a number of self-regulatory behaviors. 61 The NAc plays a primary role in opioid reward. The actions of glutamate (which is the most extensive excitatory neurotransmitter in the mammalian central nervous system) are mediated through the activation of the ionotropic and metabotropic glutamate receptors (mGluRs). Moreover, the extensive distributions of the different types of mGluRs, including mGluR7, in regions have been proved to be involved in opioid reward, such as NAc. 62 In VTA, glutamate neurons are important components of reward circuitry, and glutamatergic transmission in the VTA plays a critical role in nicotine dependence. Furthermore, early research indicated that the VTA glutamate neurons are modulated by cholinergic mechanisms and participate in the cascade of physiological responses to nicotine exposure. 63 In this research, the concentration of Glu was increased in the model group, but decreased in the treatment group for PFC and VTA, which is opposite to that of GABA. The trend of GABA in the NAc is similar to that of DA, 5-HT and 5-HIAA, and opposite to that of NA and GABA.
Multivariate data analysis for the PFC-NAc-VTA neural circuit
To obtain more information on the relationship between neurotransmitters and the PFC-NAc-VTA neural circuit, another data analysis method could be used for finding more subtle changes. Unsupervised PCA aims to find intrinsic variation in the data set, and obtain a general overview of the natural data grouping. OPLS-DA is a supervised method which focuses on finding variation in the data set. In this study, both PCA and OPLS-DA were used in the PFC-NAc-VTA neural circuit correlation analysis.
PCA was used first to investigate the general interrelation in the neural circuit. The PCA score plots for PFC are shown in Figure 5(A); the 4 groups were separated well from the model group, which is similar to the result of OPLS-DA. This indicated that the group differences were more remarkable compared with the individual differences. In the PCA score plots for NAc in Figure 5(B), the 4 groups had a certain separation from the model group, and the OPLS-DA score plots showed obvious separation. In the PCA score plots for VTA in Figure 5(C), the 4 groups did not show apparent separation from the model group, but the OPLS-DA score plots show obvious separation from the control, Fluoxetine, and SGHWT H groups, and absolute separation for the SGHWT L group. From the information, a successful depression model has been built; SGHWT was shown to have good therapeutic effects against depression, and the degree of influence of neurotransmitters to the PFC-NAc-VTA neural circuit is: PFC > NAc > VTA. Further research for the relationship between the brain region and neurotransmitters could be started for PFC. Moreover, multivariate data analysis has demonstrated the similarities of individuals within each group and the differences among the groups.

(A) PCA and OPLS-DA scores of neurotransmitter changes in PFC. (B) PCA and OPLS-DA scores of neurotransmitter changes in NAc. (C) PCA and OPLS-DA scores of neurotransmitter changes in VTA.
Conclusions
The PFC-NAc-VTA neuro circuit is bound up with depression by mediating reward-related behaviors. It is well known that neurotransmitters mainly consist of amino acid (GABA, Glu) and monoamine neurotransmitters (DA, 5-HT, NA, 5-HIAA), which are widely distributed in this circuit and play a key role in the pathophysiology of depression. For successful drug development, a consensus among researchers requires a concerted effort, embracing approaches based on both pharmacology and neuronal circuits. The possible mutual projection effect is summarized as: PFC projects Glu neurons to the NAc, acting on the N-methyl-D-aspartate (NMDA) receptor of NAc, and inhibiting GABA neuron activity through long term depression (LTD). NAc inhibits the DA neurons that project GABA neurons into the VTA region. The DA neurons of VTA regulate the sense of happiness by releasing DA and activating DA receptors in NAc neurons. This study found that when PFC is impaired in the LTD of NAc, it will cause the inhibition of the VTA region by GABA neurons of NAc, which leads to the inhibition of DA release in the NAc region in the VTA area, which leads to anhedonia and depressive behavior. Therefore, the PFC-NAc-VTA neural circuit is mutually projected by neurotransmitters secretion from Glu, GABA, and DA neurons, causing depression with the anhedonia. This knowledge can then be used to either identify new targets for treatment or to develop more-effective drugs that act on known targets. In this study, it was found that SGHTW can improve depression-like behaviors in CUMS mice, and revealed that the possible mechanism is regulation of the PFC-NAc-VTA neuro circuit neuroendocrine pathway, which can further adjust different neurotransmitter levels and finally ameliorate depressive moods. Therefore, the detailed mechanisms to investigate the relationship of different neurotransmitters in the PFC-NAc-VTA neuro circuit need to be studied further in future research. In summary, the results could provide more information to neurotransmitter research on depression.
Footnotes
Acknowledgments
This study was supported by National Natural Science Foundation of China (NO. 82004253, 81573960) and Hubei Provincial Colleges and Universities for outstanding young and middle-aged science and technology innovation team (T201808).
Statement of Human and Animal Rights
All of the experimental procedures involving animals were conducted in accordance with the Institutional Animal Care guidelines of Hubei University of Chinese Medicine, China and approved by the Administration Committee of Experimental Animals, Hubei Province, China.
Declaration of Conflicting Interests
The author(s) declared no potential conflicts of interest with respect to the research, authorship, and/or publication of this article.
Funding
The author(s) received no financial support for the research, authorship, and/or publication of this article.