
Abstract
Wheat bran, a by-product generated in large amounts during wheat processing, consists of 36.5% to 52.4% total dietary fiber. In this study, we investigated the effects of wheat bran intake on the intestinal tract immune system through the modulation of gut microbiota. Balb/c mice were fed with AIN-93G diets containing wheat bran with 2 different particle sizes (average particle size of 53 µm: powdered wheat bran; PWB, and 350 µm: granulated wheat bran; WB) as dietary fibers for 4 weeks. In the wheat bran intake groups, short chain fatty acids (SCFAs: acetic acid, propionic acid, and butyric acid) in the feces were increased after the intake of both particle-size diets, especially in the PWB group, in which the increase occurred immediately. 16S rRNA-based metagenomics of the fecal microbiota revealed that the Shannon Index (α-diversity) and weighted UniFrac distances (β-diversity) in wheat bran intake groups were significantly higher than those in the Control group, and the ratio of the certain family within the order Clostridiales in the fecal microbiota was increased after wheat bran intake, probably some including SCFA-producing bacteria. CXCR5, which is a key surface marker expressed on T follicular helper (Tfh) cells, tended to increase at the expression level in wheat bran intake groups. In addition, the amounts of secretory immunoglobulin A (IgA) and the proportion of IgA-binding bacteria in the feces from wheat bran intake groups were significantly higher than those from the Control group. These findings suggest that wheat bran may enhance Tfh-mediated IgA production in the intestine by SCFA increment through the modulation of gut microbiota and is expected to maintain and improve a healthy intestinal environment.
Wheat bran refers to the shell part of wheat grains. Although about 90 million tons are produced annually in the world, it is currently not been used effectively. 1 However, wheat bran contains 36.5% to 52.4% of dietary fiber, which is probably useful as a nutrient source for intestinal bacteria. 2,3 Some intestinal bacteria produce short chain fatty acids (SCFAs) when decomposing dietary fiber. Short chain fatty acids such as acetic acid, propionic acid, and butyric acid are the most important microbial metabolites. It is known that SCFAs produce weak acidity in the intestine, inhibit the growth of pathogenic bacteria, and promote peristaltic movement. 4,5 Recently, it has been clarified that intestinal bacteria play an important role in the immune system. 6 For example, butyric acid-producing intestinal bacteria induce the differentiation into regulatory T cells (Treg). Treg is essential for the suppression of self-reactive T cells, and is known to be effective for the suppression of inflammation and cancer besides autoimmune reactions. 7 -9 It has been reported that intestinal bacterial-derived butyric acid induces the differentiation of colonic Treg by promoting the expression of the forkhead boxprotein P3 (Foxp3) gene, which is a master gene for a transcriptional factor of Treg. 10,11 In addition, it has also been reported that intestinal bacteria play an important role in the production of immunoglobulin A (IgA). 12,13 Immunoglobulin A is considered to eliminate the pathogenic bacteria that enter the gut. 14 However, recent studies have revealed that commensal bacteria bind to IgA, resulting in the promotion of the colonization of intestinal bacteria. 15,16 Dietary fiber is expected to improve intestinal flora and the intestinal environment. 17 -21 Although wheat bran is rich in dietary fiber, there are few reports on the effects of wheat bran on gut microbiota and the intestinal tract immune system. In a previous study, we investigated the effects of short-term intake (twice-repeated feeding cycles during a 4 weeks period) of wheat bran on the intestinal environment in a murine model. 22 However, the benefits of long-term intake of wheat bran and the in vivo effects of particle-size differences remain unclear. In this study, we investigated the effects of wheat bran with 2 different particle sizes on intestinal microbiota composition, SCFA production, and IgA secretion in long-term intake (4 weeks continuous feeding) in mice.
During 4 weeks of the experimental period, there was no significant difference in food consumption among PWB, WB, and Control groups, as shown in Figure 1(a). Although there was no significant difference in the body weight change rate among 3 groups, wheat bran intake groups (PWB and WB groups) had a tendency to decrease the body weight gain compared with the Control group, as shown in Figure 1(b).

Food consumption (a) and body weight change rate (b) in mice. Control, Control group (n = 5); PWB, powdered wheat bran group (n = 6); WB, granulated wheat bran group (n = 5).
The amounts of SCFAs in feces were measured using gas chromatography - mass spectrometry (GC/MS). In the PWB and WB groups, the fecal contents of acetic acid and propionic acid throughout the experiment period were higher than those of the Control group, as shown in Figure 2(a) and (b). Although the PWB group immediately produced acetic acid and propionic acid, the WB group gradually produced them. There was a significant difference in the amount of butyric acid between the PWB and Control groups after 4 weeks, and the WB group showed an increasing tendency, as shown in Figure 2(c). These results suggest that wheat bran intake increased the amount of such SCFAs in feces. Since wheat bran is rich in nonstarch polysaccharides, such as arabinoxylan, 23,24 it is considered that wheat bran may be more efficiently fermented than cellulose as a dietary fiber contained in the control diet. In addition, the intake of PWB with smaller particle size (average particle size of 53 µm) immediately produced SCFAs, unlike that of WB (average particle size of 350 µm). These results suggest that the particle size of wheat bran may influence the colonic fermentation due to the intestinal bacteria.
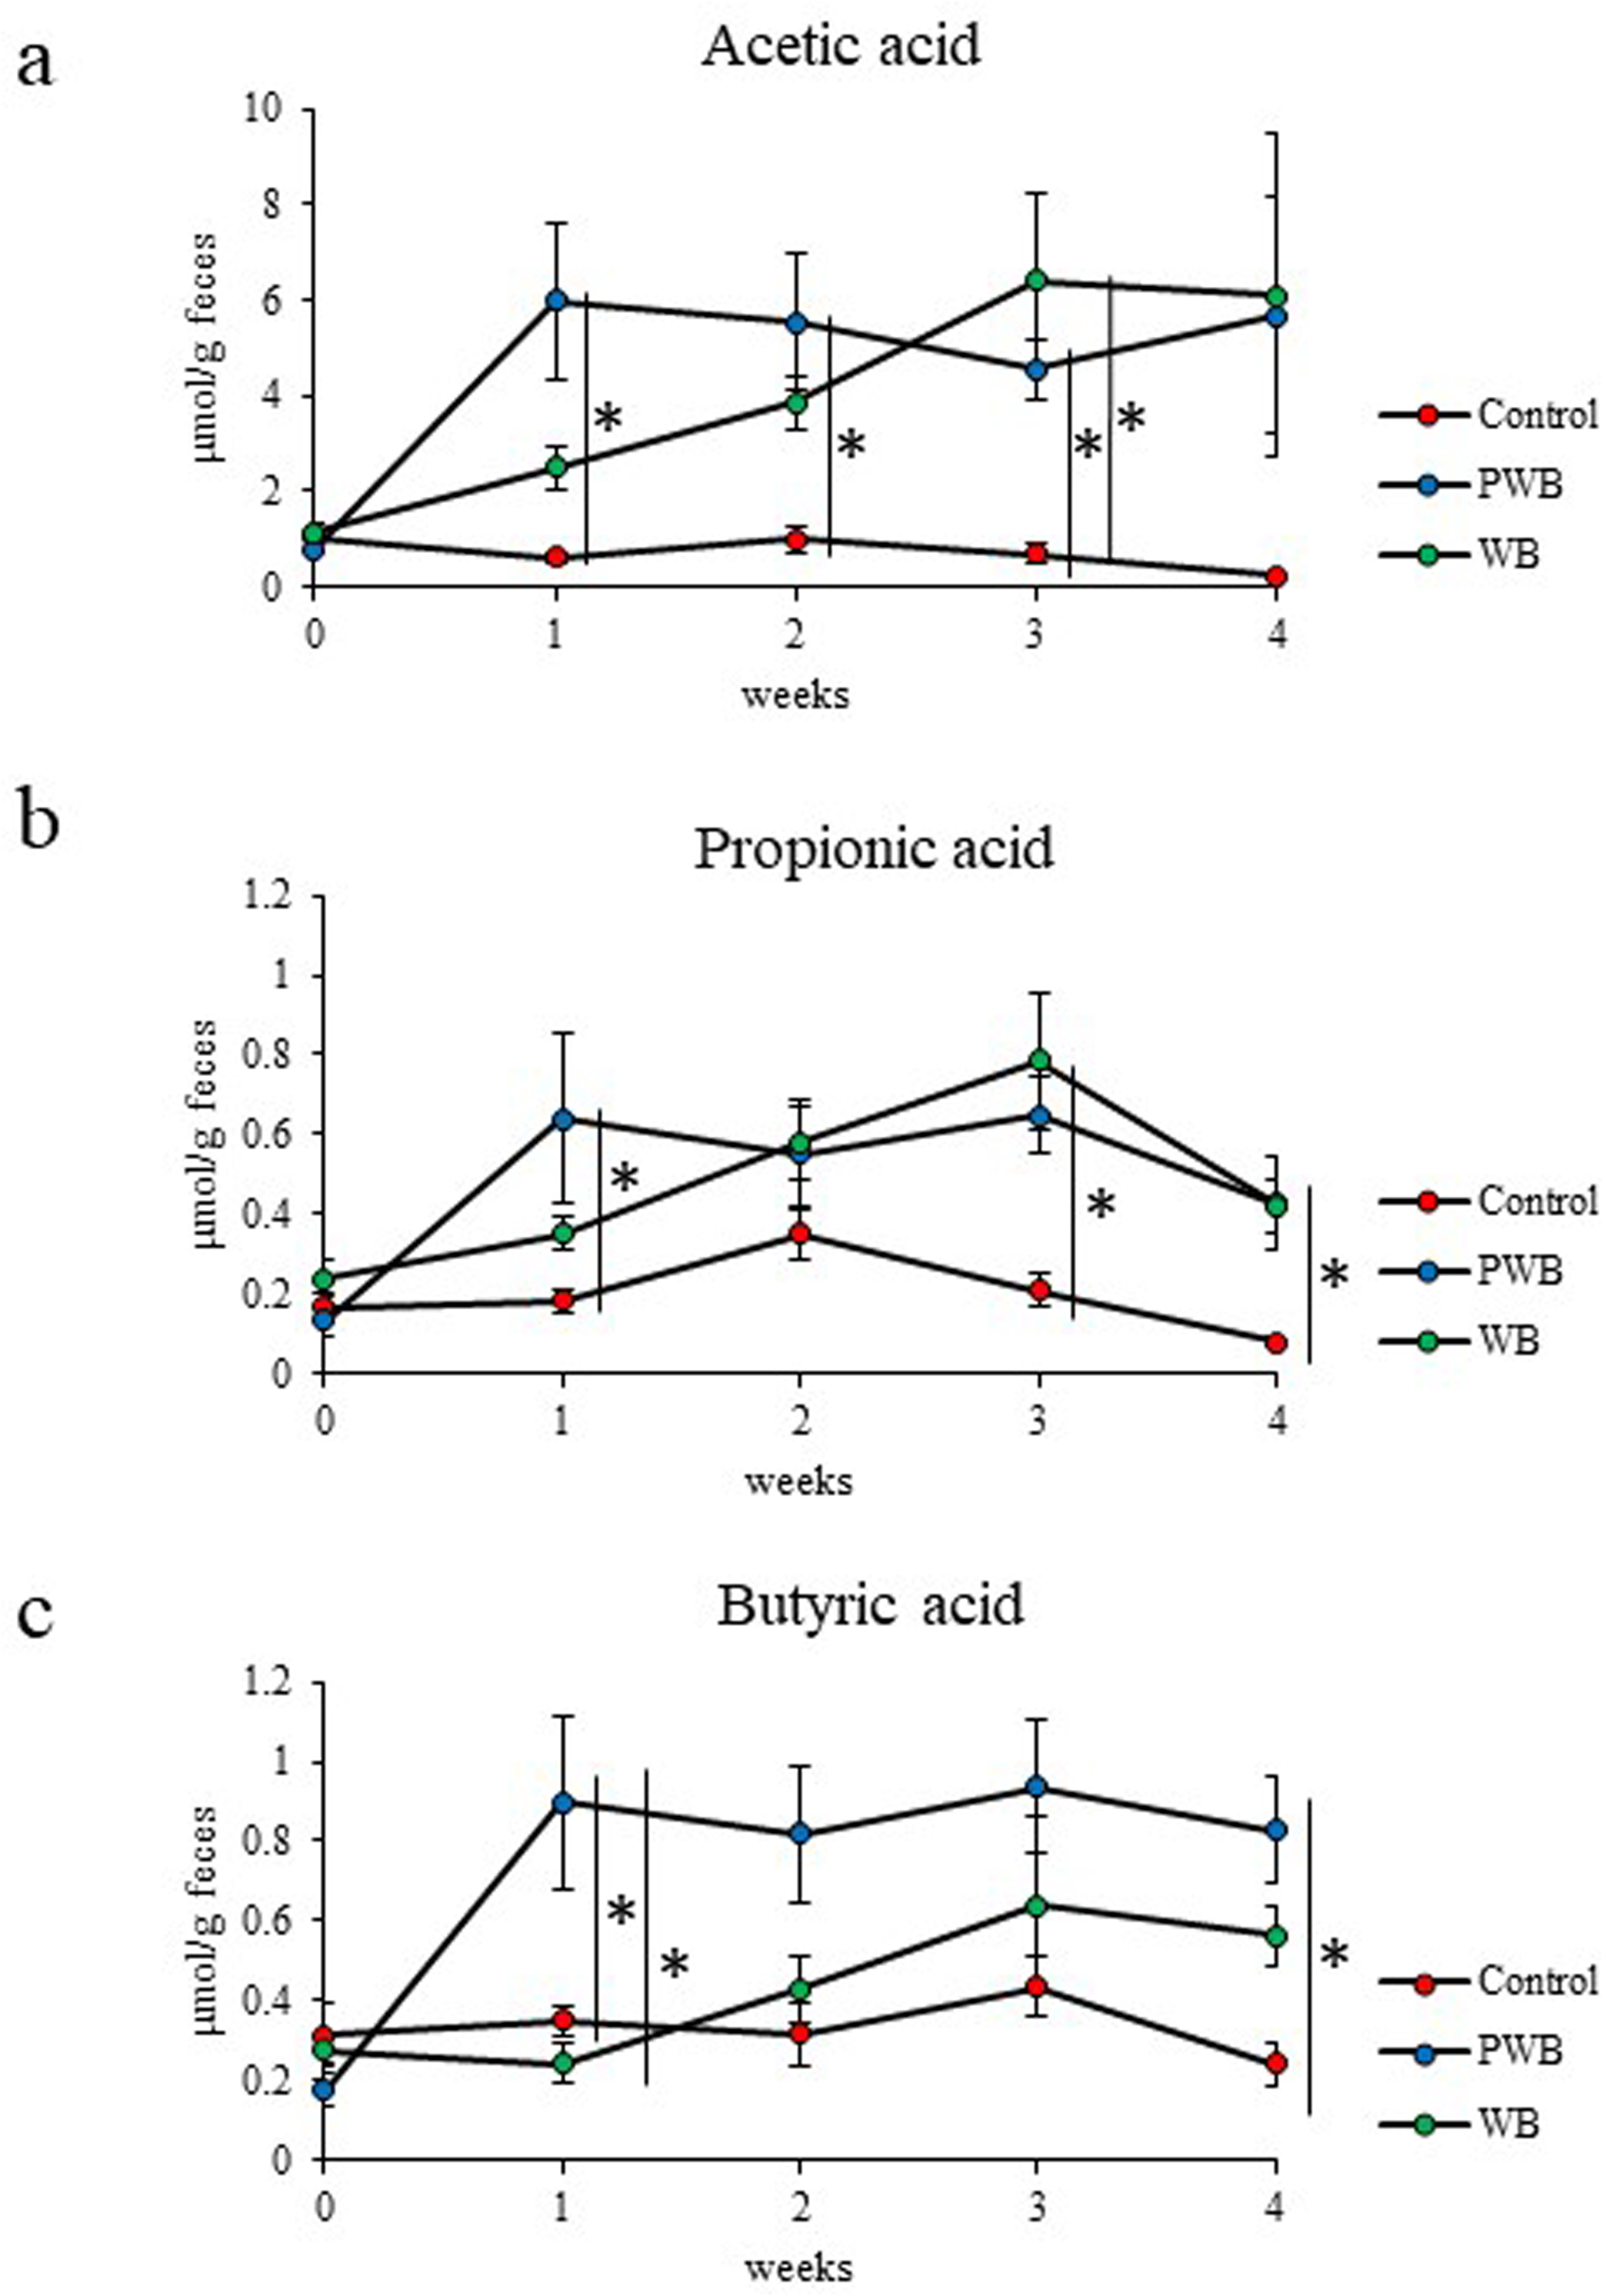
The amount of short chain fatty acids in murine feces. (a) Acetic acid, (b) propionic acid, and (c) butyric acid. Data are expressed as means ± standard error. Statistical analysis was performed using one-way analysis of variance (ANOVA) followed by Tukey’s multiple comparison test (*P < .05). Control, Control group (n = 5); PWB, powdered wheat bran group (n = 6); WB, granulated wheat bran group (n = 5).
Analysis of bacterial differences induced by wheat bran intake was determined by 16S rRNA-based metagenomics presented in the murine fecal pellets. The α-diversity (Shannon Index) and the β-diversity (UniFrac analysis) were performed based on the sequence data after wheat bran intake (week 4). The Shannon Index in the wheat bran intake groups was significantly higher than that in the Control group, as shown in Figure 3. By UniFrac analysis, the similarity of each sample was visualized by principal coordinate analysis, as shown in Figure 4(a) and (b). Furthermore, to characterize the global changes in microbial community structures, we obtained UniFrac distance in each group and statistical analysis was performed, as shown in Figure 4(c) and (d). As a result, there was no clustering among 3 samples by unweighted algorithms, as shown in Figure 4(c). In the weighted UniFrac analysis, which considers the bacterial species and its ratio, the clusters between wheat bran intake groups and the Control group were separated, and the weighted UniFrac distances in wheat bran intake groups were significantly higher than those in the Control group. These results suggest that wheat bran intake affects the diversity of gut microbiota.

The α-diversity analysis of fecal microbiota based on the 16S rRNA-based metagenomic data. Rare fraction in sequences per sample and Shannon Index are shown in graphs at the top and bottom, respectively, in PWB, WB, and Control groups. Statistical analysis was performed using Kruskal-Wallis nonparametric test (*P < .05). Control, Control group (n = 5); PWB, powdered wheat bran group (n = 6); WB, granulated wheat bran group (n = 5).

The β-diversity analysis of fecal microbiota based on the 16S rRNA-based metagenomic data. Principal coordinate analysis of bacterial community structures using the unweighted (a) and weighted (b) UniFrac distances. Box and whisker plots showing mean and variance of average pair-wise unweighted (c) and weighted (d) UniFrac distances between Control group and wheat bran intake groups (PWB and WB groups). Statistical analysis was performed using Kruskal-Wallis nonparametric test (*P < .05). Control, Control group (n = 5); PWB, powdered wheat bran group (n = 6); WB, granulated wheat bran group (n = 5).
Next, the composition ratio of gut microbiota in mice of each group at weeks 0, 2, and 4 was analyzed at the family level of bacteria (Figure 5). In the Control group, there was mostly no change in the ratio of the fecal bacteria. In the PWB and WB groups, the ratio of the family Clostridiales_f (unknown family) tended to be increased at either week 2 or week 4. These changes are caused more rapidly by the intake of wheat bran with small particle size (PWB, week 2). The results obtained were similar to the change in fecal SCFAs. It has been reported that the order Clostridiales seems to contain the bacteria associated with polysaccharide degradation and SCFA production. 10,25 -28 The findings in this study suggest that bacteria in the family Clostridiales_f (unknown family) probably contain SCFA-producing bacteria and such bacteria were increased by wheat bran intake, the SCFAs and SCFA-producing bacteria in feces, and caused these changes more rapidly with wheat bran with smaller particle size.

Effect of wheat bran intake for 4 weeks on microbiota composition in murine feces. Control group was fed with AIN-93G for 4 weeks. PWB and GWB groups were fed with experimental diets for 4 weeks. Fecal samples were collected on the final day of each week. The ratio of fecal microbiota was estimated by 16S rRNA-based metagenomic analysis. Relative abundance of taxa at the family level of bacteria. Control, Control group (n = 5); PWB, powdered wheat bran group (n = 6); WB, granulated wheat bran group (n = 5).
Clostridia, a dominant class of commensal bacteria, have been reported to induce the differentiation of Treg, which have a central role in the suppression of inflammatory and allergic responses in the intestinal tract via production of SCFAs. 10 Short chain fatty acids have an inhibitory action on histone deacetylase and induce the expression of the Foxp3 gene, a master transcription factor of Treg, by promoting histone acetylation in the Foxp3 gene region. 29 Since the proportion of SCFAs increased by wheat bran intake in this study, Treg differentiation induction was also examined. The mRNA expression level of Foxp3 was measured using real-time PCR. As shown in Figure 6(a), there was no significant difference in the expression level of Foxp3 mRNA between 3 groups. However, it has been reported that Treg loses Foxp3 expression, which moves to follicles of Peyer’s patches by expressing CXCR5, and differentiates into T follicular helper cells (Tfh cells). 30 Therefore, the expression level of CXCR5 was measured as well. As shown in Figure 6(b), the expression level of CXCR5 showed an increasing trend in the PWB and WB groups compared with the Control group. The results suggest that Treg induced by SCFA production due to the population change of gut microbiota may further differentiate into Tfh cells.

The expression level of Foxp3 and CXCR5 mRNA. The expression level of Foxp3 (a) and CXCR5 (b) mRNA was measured using reverse transcription (RT)-real-time polymerase chain reaction (real-time PCR). Data are expressed as means ± standard error. Statistical analysis was performed using one-way ANOVA followed by Tukey’s multiple comparison test (*P < .05).
T follicular helper cells induce a class switch to IgA-producing B cells by changing the structure of the constant C region of IgM expressed on the surface of B cells through the production of interleukin (IL)-4 and IL-21. 31 -35 IgA is an important antibody for maintaining a balance in intestinal bacterial flora. 15,36 It was reported that most IgA secreted into the intestinal tract is produced in a Tfh cell-dependent manner. 37 Therefore, we examined the secretion of IgA in the intestinal tract via induction of differentiation into immune cells by wheat bran intake. The amounts of fecal IgA in the PWB and WB groups were significantly higher than in the Control group, as shown in Figure 7. It is assumed that the increase in the amount of fecal IgA after the wheat bran intake is associated with the differentiation into Tfh cells, because the expression level of CXCR5 tended to be increased in the mouse ileum mucous layer. Several animal studies have demonstrated that the intake of dietary fibers increases intestinal secretory IgA production. 38,39 It has been reported that mice fed with wheat bran soluble arabinoxylan-enriched wheat bran for 4 weeks increased the mucosal and luminal secretory IgA levels in the distal small intestine. 40 These reports support our results. The increase in secretory IgA level by wheat bran intake may contribute to the prevention of intestinal inflammatory disease. These results suggest that wheat bran can be developed as an immunoenhancing functional food.
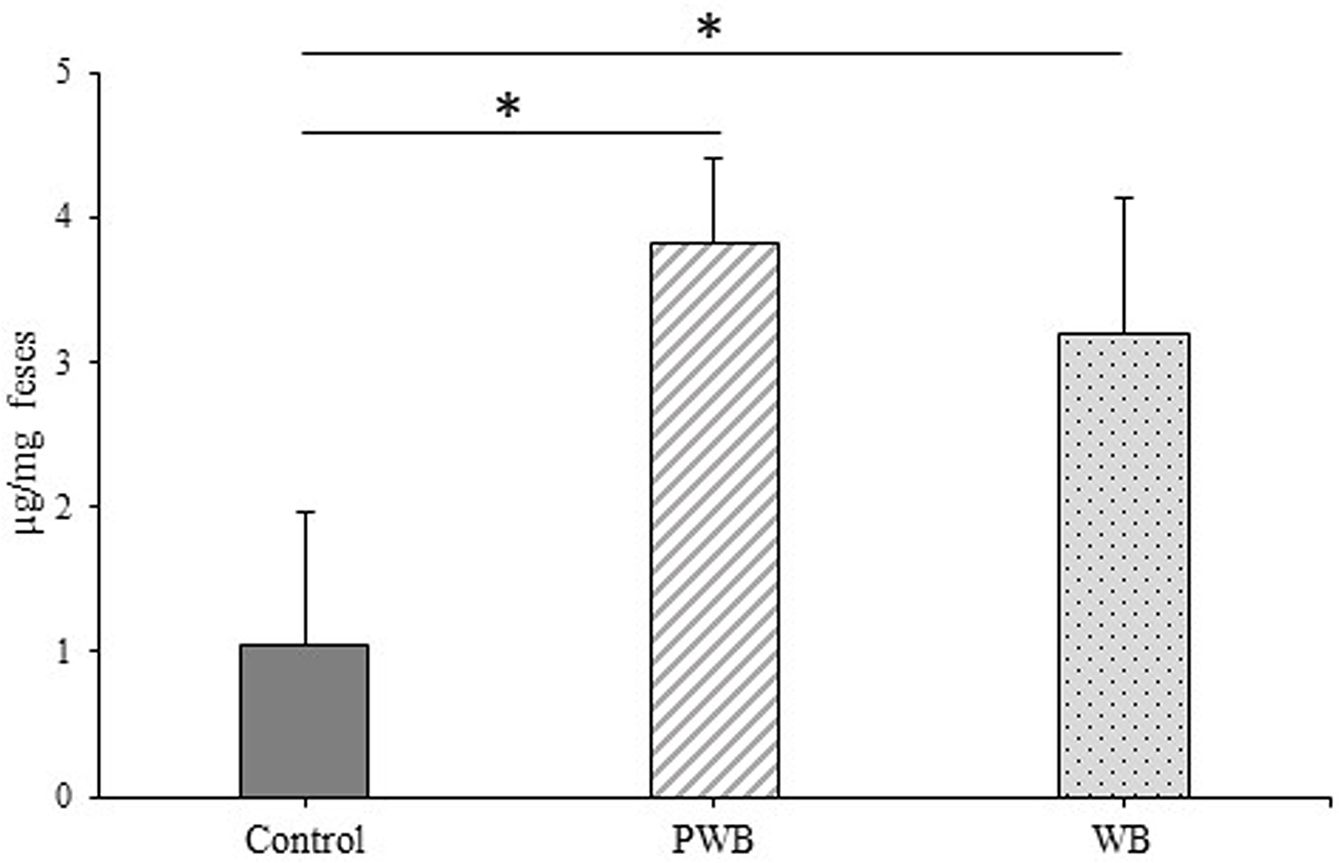
Determination of secretory immunoglobulin A level in feces. Fecal samples were collected from each mouse on the final day of the experimental period (4 weeks). Secretary immunoglobulin A level was measured by enzyme-linked immuno sorbent assay (ELISA). Data are expressed as means ± standard error. Statistical analysis was performed using one-way ANOVA followed by Tukey’s multiple comparison test (*P < .05).
Since the amount of secretory IgA in murine feces increased in the wheat bran intake group, it is anticipated that the excretion of a specific bacterial group recognized by these IgA may be promoted. Therefore, the ratio of the bacteria bound to IgA contained in feces of mice collected at the end of the test was investigated by flow cytometry. In flow cytometric analysis, the bacteria labeled without anti-mouse IgA R-phycoerythrin (PE) were examined as a negative control, as shown in the left panel of Figure 8(a), and then PE-labeled bacteria were analyzed, as shown in the right panel of Figure 8(a). The ratio of fecal IgA-coated bacteria in the PWB and WB groups was significantly increased in comparison with the Control group, as shown in Figure 8(b). In recent years, it has been reported that dysbiosis of the intestinal microbiota is related not only to inflammatory bowel disease but also to the development of many diseases, and the improvement of gut microbiota is important for maintaining health. Intestinal microbiota are shown to be recognized and controlled by IgA antibody secreted into the intestinal tract. 41 Further study is desired to identify IgA-coated bacterial species increased by wheat bran intake.

Flow cytometric analysis of immunoglobulin A coated bacteria in fecal samples. The frequency of immunoglobulin A coated bacteria in feces (a). Representative fluorescence-activated cell sorting (FACS) profiles are shown of immunoglobulin A staining from mice on the final day of the experimental period (4 weeks). Numbers in the frames indicate the frequency of cells within the defined area. The ratio of immunoglobulin A coated bacteria in feces (b). Data are expressed as means ± standard error. Statistical analysis was performed using one-way ANOVA followed by Tukey’s multiple comparison test (*P < .05).
In conclusion, the present study has demonstrated that long-term wheat bran intake (4 weeks continuous feeding) increased the bacterial diversity in fecal microbiota, induced SCFAs production, and increased the amount of IgA in murine feces. In addition, Treg induced by SCFA production through the modulation of gut microbiota probably differentiates into Tfh cells. These findings are summarized as shown in the possible schematic representation of Figure 9. These results suggest that continuous intake of wheat bran leads to maintenance and improvement of a healthy intestinal environment.

Possible schematic representation of immunoglobulin A secretion by short chain fatty acid production through modulation of gut microbiota. Wheat bran intake increases the bacterial diversity in fecal microbiota, especially the family Clostridiales_f (unknown family), probably including short chain fatty acid producing bacteria, and short chain fatty acids are released by such bacteria into the intestine. Short chain fatty acid production induces the differentiation of Treg to T follicular helper cells. The T follicular helper cells probably stimulate B cells, and the B cells secrete bacteria-binding immunoglobulin A into a lumen of the intestinal tract. Then, some immunoglobulin A bound bacteria may be eliminated from the intestine with feces. Thus, wheat bran intake may have a benefit for the maintenance and improvement of a healthy intestinal environment by such a pathway.
Experimental
Wheat Bran Sample
Sample preparation of wheat bran (particle sizes D 50 = 53 µm [powdered] and D 50 = 350 µm [granulated]) was performed according to our reported method. 22 The dietary fiber contained in AIN-93G was replaced by powdered wheat bran (PWB group) and granulated wheat bran (WB group) containing the same amount of fibers. The composition of diets is shown in Table 1.
Composition of Test Diets and Nutritional Composition of Wheat Bran.

PWB, powdered wheat bran.
Animals and Experimental Design
Eight-week-old male Balb/c mice were purchased from CLEA Japan (Tokyo, Japan). The mice, housed in plastic cages, were placed in a room with controlled temperature (23°C ± 2°C) and relative humidity (50% ± 10%) under a 12-hour/12-hour light/dark cycle. All animal experiments conformed to the guidelines of the Animal Research Committee of the University of Shizuoka (approval # 155088), and all efforts were made to minimize animal suffering.
The experimental design is shown in Figure 10. Mice were acclimatized for 1 week while being fed an AIN-93G commercial rodent diet (CLEA Japan) and given tap water. All mice were kept separately, with free access to water and food. After 1 week of acclimatization, mice were divided into 3 groups according to body weight (3-11 mice per group). One group was given a normal AIN-93G diet (control diet; n = 5), while the other 2 groups were given either a powdered wheat bran diet (PWB diet; n = 6) or a granulated wheat bran diet (WB diet; n = 5) for 4 weeks. The dietary consumption and body weight of each mouse were measured every 3 and 4 days, respectively, during the experimental period. Feces of individual mice were collected immediately after defecation on the final day of each week (week 1-week 4). Fresh feces were used for the analysis of SCFA production. The remaining fecal samples from individual mice were frozen at −80°C for the analysis of microbiota composition. After the experimental period, the ascending colon and ileum (2 cm of each) were obtained by dissection and kept in RNAlater at −80°C for RT-real-time PCR.
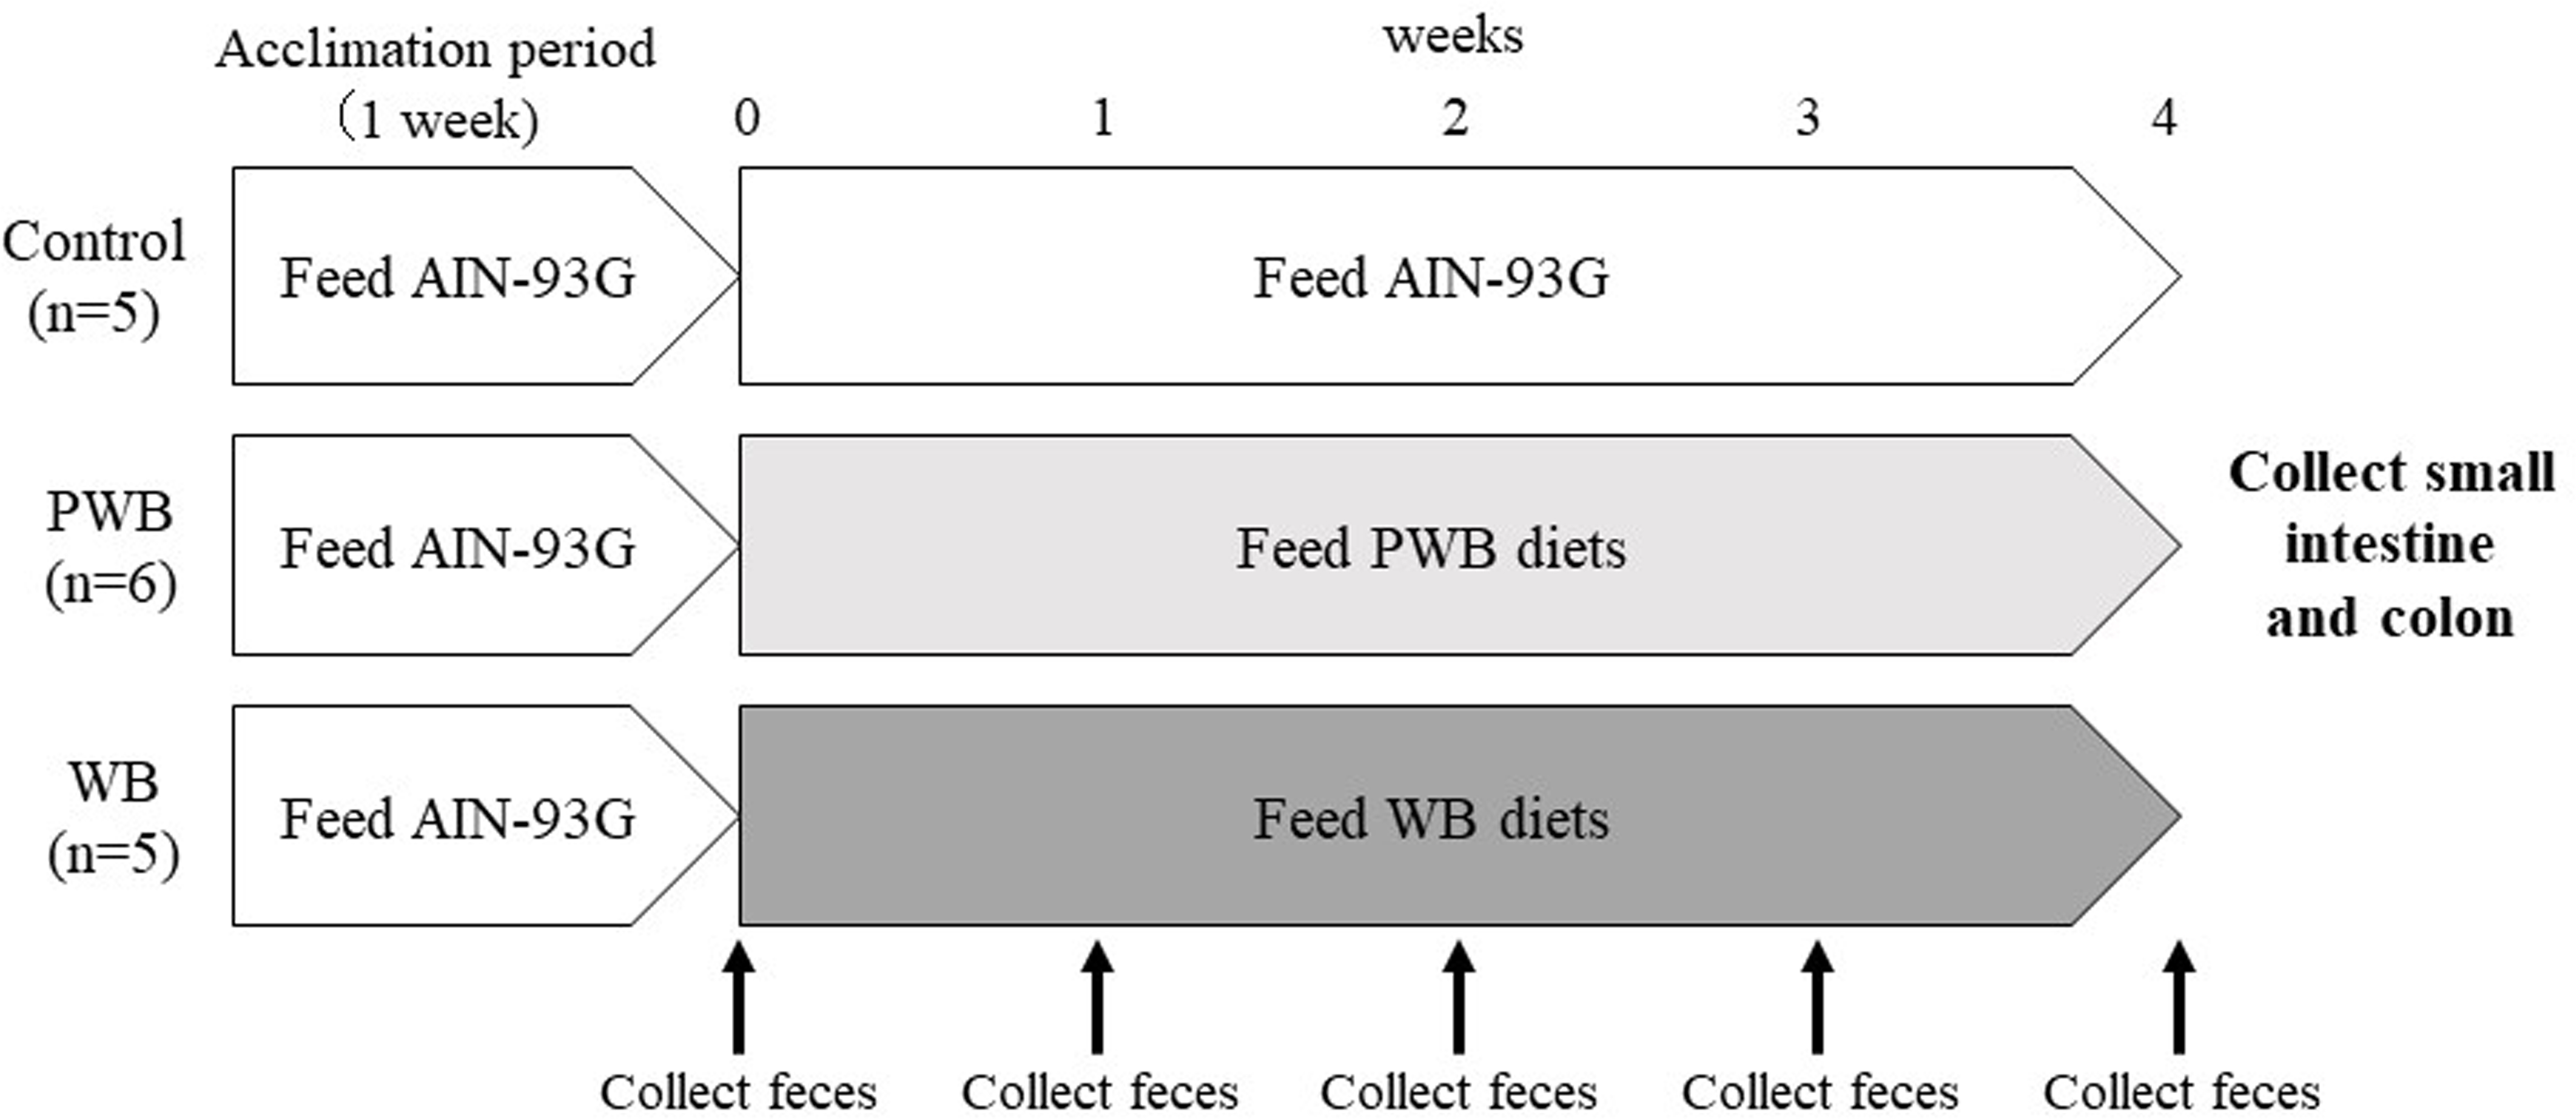
Experimental design. Sixteen male Balb/c mice (CLEA Japan, Tokyo) of 8 weeks of age were used and the experiments were conducted after an acclimation period of 1 week. Control, Control group (n = 5); PWB, powdered wheat bran group (n = 6); WB, granulated wheat bran group (n = 5).
DNA Extraction From Murine Feces
A fecal sample (50 mg) from each mouse was dissolved in 1.4 µL of Inhibit EX buffer (Qiagen) and homogenized at 4000 rpm for 1 minute using Micro Smash MS-100 (TOMY Seiko, Tokyo, Japan), and then incubated at 70°C for 1 minute. DNA was extracted from the homogenized feces using a QIAamp Fast DNA Stool Mini Kit (Qiagen).
16S rDNA Amplification
The primers for 16S rDNA amplification were prepared based on sequences according to the Ion Xpress barcode adapters (Thermo Fisher Scientific) (Table 2). These primers include either of the two adaptor sequences at their 5′ end. The forward adaptors further link to unique Tag barcodes consisting of 10 bases to distinguish multiple samples. A partial 16S rDNA (V1-V2 region) using a specific primer pair was amplified from fecal DNA.
Primers for 16S rRNA-Based Metagenomic Analysis.

The PCR conditions used were 5 minutes at 94°C followed by 40 cycles of 30 seconds at 94°C, 30 seconds at 50°C, and 30 seconds at 68°C. The amplified V1 to V2 fragments of 16S rDNA were purified using the Wizard SV Gel and PCR Clean-Up System (Promega, Madison, WI, United States).
Ion Torrent Personal Genome Machine (PGM) Sequencing
Each of the extracted DNA solutions was mixed and adjusted so that the concentration of the library was 60 pM. The prepared library of 25 µL was added to a dedicated tube of Ion PGM Hi-Q Chef reagents (Thermo Fisher Scientific) and attached to Ion Chef with Ion PGM Hi-Q Chef Supplies and Ion 314 Chip v 2 BC (Thermo Fisher Scientific). After that, the sequencing was started, and after completion, the sequence data were acquired from Torrent Browser in the FASTQ file format, and the analysis was performed using QIIME (1.9.1). After the quality check of the acquired FASTQ file, the low-quality leads were removed, and then, the leads with sequence similarity of 97% to create operational taxonomic units (OTUs) were clustered. Representative sequences were extracted from the created OTUs, each cluster was classified, and an OTU table was created. Based on these data, the diversity and similarity of the microbiota composition were analyzed.
Measurement of SCFAs Using GC/MS
Feces were collected on the last day of each week from weeks 0 to 4. Fresh feces samples (50 mg) were immediately added to headspace crimp vials. The amounts of SCFAs (acetic acid, propionic acid, and butyric acid) in the feces were measured by an Agilent headspace gas chromatograph-mass spectrometer. The system consisted of an Agilent 7697A headspace sampler, a 6850 gas chromatograph, and a 5975C mass selective detector (Agilent Technologies, Santa, Clara, CA, United States). The sample in the headspace crimp vial was heated in a headspace autosampler at 100°C for 60 minutes and then 1 µL of gas phase was injected into a DB-WAK column (Agilent Technologies). The initial oven temperature was held at 35°C for 5 minutes and then programmed to 250°C/min. Peaks of each SCFA were detected from the obtained mass spectrum, and the concentration of SCFAs was calculated by comparing their peak areas with standards (Wako, Osaka, Japan).
RT-real-time PCR
Total RNA from mice ascending colon and ileum were extracted using a Nucleo Spin RNA (Takara Bio, Otsu, Japan), and converted into cDNA by reverse-transcriptional reaction using Prime Script RT Master Mix (Takara Bio) according to the manufacturer’s instructions. Real-time PCR was then performed with SYBR Premix Ex Taq II (Takara Bio) and a real-time PCR system (Thermal Cycler Dice real-time system, Takara Bio) and specific primers (Table 3). Each sample was normalized to β-actin, and relative quantification was conducted at mRNA levels.
Primers for Real-Time PCR.

ELISA
Phosphate buffered saline (PBS) supplemented with protease inhibitor was added to 50 mg of feces (25% (w/v)) collected on the last day, and the fecal solution was vortexed to obtain homogeneity. The suspension was centrifuged at 16,000 × g for 10 minutes at 4°C, and the supernatant was collected. The IgA concentration in the resulting supernatant was measured using a Mouse IgA ELISA quantitation kit (Bethyl Laboratories, Montgomery, TX, United States) according to the manufacturer’s instructions. Absorbance at 450 nm of the microtiter wells was measured using Flex Station and Soft Max Pro (Molecular Devices Japan, Tokyo, Japan).
Analysis of IgA-Coated Bacteria in Feces by Flow Cytometry
Each 200 mg of feces sample was homogenized in 1.5 mL of staining buffer (PBS containing 1% (w/v) bovine serum albumin) and centrifuged at 100 × g for 10 minutes to remove large particles. Fecal bacteria in the supernatant were washed with 1 mL of staining buffer and centrifuged at 8000 × g for 5 minutes and resuspended in 100 µL of staining buffer. The resuspension was passed through a Falcon Cell Strainer (40 µm mesh). The bacterial solution (92 µL) was mixed with 8 µL of anti-mouse IgA R-phycoerythrin (PE, Affymetrix, Santa, Clara, CA, United States) and incubated for 30 minutes on ice. The incubated samples were then washed with 1 mL of staining buffer before flow cytometric analysis (FACS Cant II flow cytometer, BD Bioscience). The bacterial solution before fluorescent labeling with PE was analyzed as a negative control. The gate was set to be 1% or less in the detection of unlabeled bacteria as background, as shown in Figure 8(a).
Statistical Analysis
Statistical processing was performed using IBM SPSS statistics ver. 20 software (IBM Corporation Armonk, NY, United States). Shapiro-Wilk’s normality test was performed on all average values. Statistical significance was determined by one-way ANOVA, followed by Tukey’s multiple comparison test. Differences among 3 groups (PWB, WB, and Control) were tested using a Kruskal-Wallis test followed by a Games-Howell test as a post hoc for pair-wise comparisons. Differences were considered significant at P < .05. Data are expressed as means ± standard error .
Footnotes
Declaration of Conflicting Interests
The author(s) declared the following potential conflicts of interest with respect to the research, authorship, and/or publication of this article: This study was performed based on collaboration between the Health Care Research Center in Nissin Pharma Inc. and the University of Shizuoka with the sponsorship and supply of tested wheat bran from Nissin Pharma Inc.
Funding
The author(s) received no financial support for the research, authorship, and/or publication of this article.