
Abstract
Inosine differs from the guanosine nucleoside only by the absence of the N2 amino group. Both nucleosides also have similar electrostatic potentials. Therefore, substituting I for G has been used to probe various properties of nucleic acids and to facilitate the interpretation of binding studies. In particular, the absence of the amino group permits the assessment of its importance in the binding of ligands to the minor groove of duplex DNA. It has been known for some time that an I-C base pair is of lower stability than a regular G-C base pair, which needs to be considered when making DNA constructs containing inosine. However, it is generally assumed that both base pairs are structurally highly similar. To test this assumption in an identical sequence environment, we have determined the fine structure of two hairpin DNA substrates that differ only in the substitution of an I-C base pair for a G-C base pair. The structures have been solved using nuclear magnetic resonance (NMR) restraints in conjunction with Mardigras and molecular dynamics. The structural data are complemented with thermodynamic and dynamic data to get a comprehensive evaluation of the consequences of G-C vs I-C base pair substitutions. Our data show a strong similarity in the structures of the hairpins, but a significant difference in the melting temperatures, T m. This difference is also reflected in the drastically decreased base pair lifetime of 7.4 milliseconds compared to the G-C base pair lifetime of 155 milliseconds. The substitution of I-C for G-C is to probe for specific effect due to the amino group is satisfactory, as long as the lowered thermal stability and the drastically increased local dynamics are considered.
The ability of inosine to act as a universal base makes it useful for designing polymerase chain reaction primer sets and as a DNA structural probe. However, the stability of the various combinations with natural bases varies greatly, with the I-C pairing being the most stable. 1 Inosine is chemically identical to guanosine with the exception of the absence of the amino group attached to C2 (Figure 1). Moreover, both bases have similar electrostatic potentials. 2 Inosine is, therefore, a unique replacement for G. This allows for the comparison of duplex DNA structures that differ only by the absence of an amino group in the minor groove. For minor groove targeting drugs is relevant to address potential interactions with the amino group, which will guide drug design strategies. In contrast, to a G-C base pair, an I-C base pair only forms 2 hydrogen bonds. It is also well established that an I-C base pair in a DNA duplex is significantly less stable than a G-C base pair. 3 Despite this, it is generally assumed that an I for G substitution is well tolerated and has little impact on the local helical structure.

(a) Sequences of DNA hairpins studied. The hairpins differ only in the nucleotide at position 4 (I vs G); everything else, including the base pairing partner, residue 15, (C) is identical. (b) Structure of the nucleobases for G (guanine, left) and I (hypoxanthine, right).
To obtain more detailed insight into the consequences of an inosine-for-a-guanosine substitution, we investigated two 18-mer DNA hairpins that differ only in the substitution of inosine for guanosine. The sequence of the hairpins mimics the U5 terminus of the HIV genome. Thermal stability, nuclear magnetic resonance (NMR) structure, free MD simulation, as well as NMR base pair dynamics studies were carried out to obtain a more complete picture on the impact of a G→I substitution.
Thermal Stability
The substitution of an I for a G in the DNA hairpin results in a remarkable and expected decrease in the thermal stability of the hairpin structure as evident from the 11.1°C lower T m for the HIV-I hairpin (Table 1). Similar reductions in stability have been reported previously. For example, Sun et al. showed that the replacement of a G-C base pair with an I-C pair lowered the T m by 7.4°C. 3 Interestingly the substitution does not appear to significantly alter the enthalpy of the thermal denaturation. This is also supported by literature data obtained for other DNA constructs. 4
Thermal Stability of DNA Hairpins.
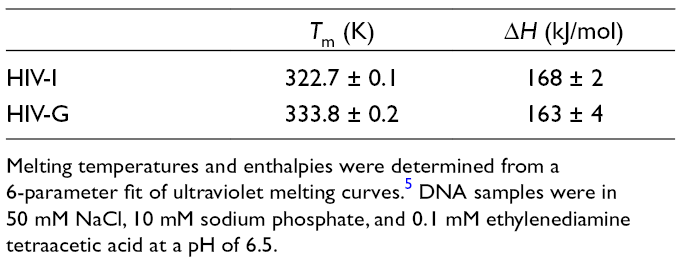
Melting temperatures and enthalpies were determined from a 6-parameter fit of ultraviolet melting curves. 5 DNA samples were in 50 mM NaCl, 10 mM sodium phosphate, and 0.1 mM ethylenediamine tetraacetic acid at a pH of 6.5.
Base Pairing
The base pairing present in the DNA hairpins is readily assessed from the imino proton NMR (Figure 2a). Both hairpins are fully base-paired. The major difference is the downfield shifted resonance of I4 at ~15 ppm compared to the G4 imino proton near 12.6 ppm and this is due to the different electronic structures of hypoxanthine vs guanine base.

(a) Imino proton spectra of HIV-G and HIV-I hairpins from 283 to 308K. (b) 31P nuclear magnetic resonance spectrum of the HIV-I hairpin on the left and 31P chemical shift difference plot (HIV-G-HIV-I) on the right.
Backbone and Sugar Conformation
The phosphodiester backbone conformation in nucleic acids can be probed from 31P NMR (Figure 2b). The resonances were assigned from proton phosphorus correlation (HPCOR) experiments. Resonances at 0.1 and −0.2 ppm arise from the hairpin loop while those from the hairpin stem are between −0.4 and −0.8 ppm. The 31P spectra of both hairpins are highly similar as is shown in the difference plot, which shows only small differences, localized at residues 4 and 5 near the G/I substitution and residues 15 and 16 on the opposite side. Full 31P assignments are provided in supplementary material (SM Table S1).
The highly similar backbone conformation is also supported from the experimentally determined ε torsion angles, which are nearly identical. The biggest change (10°-11°) are again seen for residues 4 and 16, which are the location with the variation in 31P chemical shifts. In addition, all deoxyribose sugar conformations, estimated from experimental coupling constants, indicate a high preference of the southern conformation for both hairpin structures (Table 2, SM Table 2).
E- Torsion and Sugar Puckering.

Nuclear magnetic resonance determined epsilon torsion angles using constant-time nuclear Overhauser effect spectra. Sugar puckering is determined from low-flip angle correlated spectroscopy spectra and assesses from the measured coupling constants and expressed in fraction south conformation. >70% = S, >50% = s. Dashes indicate lack of data due to spectral overlap.
NMR Solution Structure
The NMR solution structure of the 2 hairpins was determined using an array of NMR experiments for peak assignment and determination of coupling constants and NOESY cross peak volumes as detailed in the methods section. NMR structures were obtained using an iterative RANDMARDI/rMD process. The final structures each had a total CORMA Rx values lower than 5%, indicating a strong agreement with the experimental NMR data. The AMBER penalties were negligible for torsions and angle violation. The distance penalty for the I-HP was 75.0 kcal/mol with no individual penalty greater than 3.5 kcal/mol. The G-HP had a total distance penalty 65.0 kcal/mol with no individual penalty greater than 6.3 kcal/mol. Both structures were obtained with a large number of restraints, and details are listed in Table 3 and SM Table 3.
NMR Restraints.

The final structures of the hairpin stem are shown as an overlay in Figure 3(a) and (b). Relevant structural sections are shown in Figure 4(a) and (b) for the HIV-I and HIV-G hairpin, respectively.

(a) Nuclear magnetic resonance structure overlay of the HIV-G (blue) and HIV-I (red) hairpins, minor groove view. The location of the substitution is marked. For simplicity, the hairpin loop was omitted. The all-atom root mean square deviation for residues 2, 3, 5, 6, 13, 14, 15 16, and 17 is 1.18 Å. (b) Expanded view into the major groove.
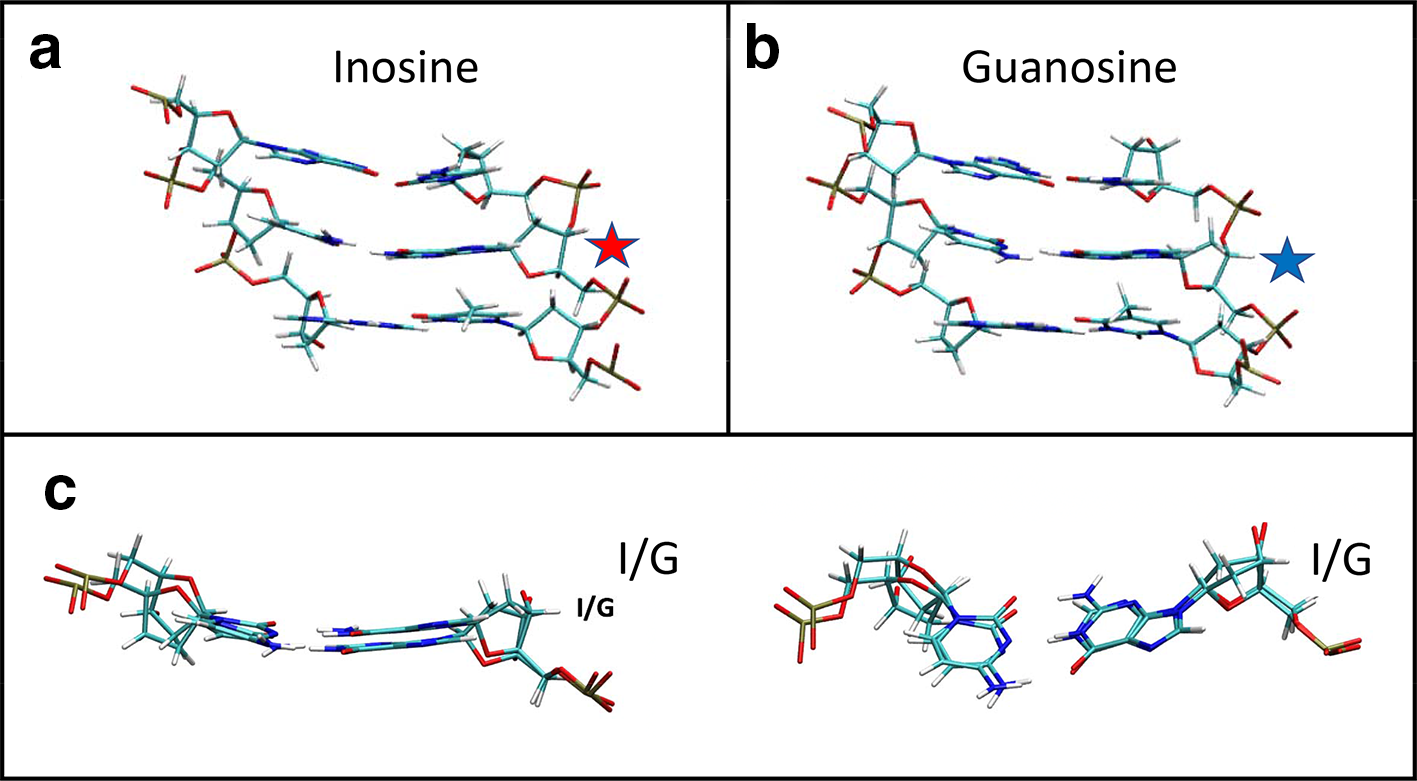
(a and b) Local nuclear magnetic resonance structure of HIV-G and HIV-I hairpins, the location of the substitution is marked with a star. (c) Overlay of G-C and I-C base pairs of the hairpins in top and side views. The all-atom root mean square deviation of residues 3, 5, 14, 15, and 16 is 0.86 Å.
Clearly, the structures are highly similar as is also evident from the low root mean square deviation (RMSD) of 0.86 Å of the hexanucleotide core. The high similarity of the I-C and G-C base pairs is highlighted in the superposition in Figure 4(c). More detailed analysis was carried out using Curves +, which provided base pair parameters and backbone torsion angles (SM Table S4). Overall the differences between the hairpins are unremarkable. The largest difference in the base pair parameters for the duplex stem portion of the hairpins was detected in the shear values of the I-C vs the G-C base pairs with 1.1 Å. For the backbone, the delta torsion angles for residues 3 and 4 differ by 23° and 22°. The same residues also show differences in epsilon and zeta torsion angles (SM Table S5). The final NMR structures were then used to explore and compare the dynamic behavior of I-C and G-C base pairs (Figure 5). As evident from the 1000 ns free molecular dynamic simulation, the RMS fluctuation of both pairs again highly similar in this time frame.

Root mean square fluctuation (RMSF) (Å) of the I-C base pair (a) and G-C base pair (b) over 1 μs free molecular dynamics simulation. I-C pairs RMSF: 0.154 Å, minimum 0.09, maximum 0.26. G-C base pair RMSF: 0.150 Å, minimum 0.09, maximum 0.23.
Base Pair Lifetimes
Determining the base pair lifetimes permits insight into the millisecond time regime of DNA dynamics. Base pairs exist both in closed and open forms. In the open form the imino protons of G, I, and T residues are no longer base paired and can, therefore, exchange with water. This exchange in duplex DNA is normally quite slow; however, it can be accelerated with a catalyst. Analysis of the exchange rates, in the presence of catalyst, obtained via T 1 relaxation data, permits the assessment of the base pair opening rate. The results shown in Figure 6(a) show a large difference in base pair lifetimes. The lifetime of the I-C base pair is with 7.4 milliseconds, a remarkable 21 times shorter than a G-C base pair in the identical sequence environment (Table 4). The destabilization is, however, highly localized since the G-C base pair adjacent to the I-C pair is with 68 milliseconds nearly as stable as the analogous pair in the HIV-G hairpin control. Comparison to literature data is difficult since base pair lifetimes depend on sequence environment, placement in a duplex, and experimental conditions. However, a comparison of an I-C vs and A-T base pair showed that the I-C pair also has a significantly shorter life time (58%) than a comparable A-T base pair. 6 The slope of the exchange rate curves is inversely proportional to the K d of the open and closed base pair equilibrium. Since the slope of the curve for the I-C base pair is 3.9 times lower than the for the G-C pair, this signifies that the K d for the I-C pair is 3.9 times larger than that of the G-C base pair in Figure 6(a) (K d-HIV-I =3.9 K d-HIV-G). For the neighboring G-C base pair, the dissociation constants are of the HIV-I and HIV-G hairpin nearly equal (K d-HIV-I =1.1 K d-HIV-G).

Imino proton exchange rates as a function of the catalyst concentration. (a) Base pair of residues 4-15, I-C (red) and G-C (blue). (b) Base pair of residues 5-14 of HIV-I (red) and HIV-G (blue) hairpins.
Base Pair Opening Times.
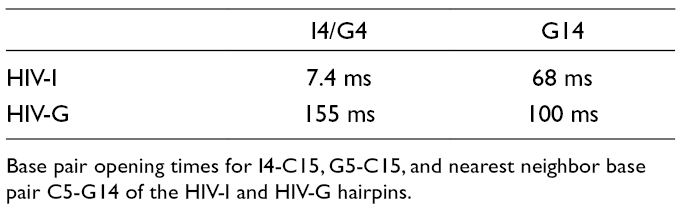
Base pair opening times for I4-C15, G5-C15, and nearest neighbor base pair C5-G14 of the HIV-I and HIV-G hairpins.
Conclusions
Structurally the I-C base pair is highly similar to the G-C base pair in the sequence environment studied. The observed small changes in base pair parameters and backbone torsions are confined to the region of the substitution. A hint of this can be gleaned from the 31P NMR spectra. Despite the structural similarity, the HIV-I hairpin has a significantly lower T m than the corresponding HIV-G hairpin, and the only difference between these two hairpins is the absence of the exocyclic amino group in the I-C base pair. On the microsecond time scale, we do not observe a significantly different behavior between the I-C and the G-C base pairs. On a much longer timescale it emerges that the lifetime of an I-C pair is markedly reduced, and in addition, the I-C base pair exists in a much higher fraction of the open state as the comparable G-C base pair of the control DNA. This effect is, however, highly local as a neighboring G-C base pair is much less affected. The substitution of I-C for G-C is, therefore, a valid substitution as long as the local dynamics together with the higher fraction of open state of the I-C base pair and lower thermal stability of constructs are taken into account.
Experimental
Synthesis and Purification of DNA Substrates
Standard and altered DNA phosphoramidites were purchased from Glen Research. The sequence mimics the U5 terminus of the HIV genome and the hairpins are named HIV-G and HIV-I hairpin. DNA substrates were synthesized using a 391 DNA synthesizer by Applied Biosystems. Standard synthesis protocols were used. 7 Deprotected oligonucleotides were purified by ion exchange using a Pharmacia 15Q PE column and then desalted using a GE HiTrap desalting column. Oligonucleotide concentrations were determined under denaturing conditions using extinction coefficients calculated from the sum of their mononucleotides. 5
Tm Thermal Melting Data
Ultraviolet melting curves were recorded at 260 nm in 1 cm cells on a Cary 100 Spectrophotometer using a temperature ramp of 0.5°C/min and analyzed as described previously. 8
NMR Spectroscopy
All NMR experiments were performed using a Bruker Avance 600 spectrometer with IDTG triple resonance and QXI probe heads. Samples in D2O were in 50 mM NaCl, 10 mM sodium phosphate, 0.1 mM ethylenediamine tetraacetic acid (EDTA), at a pH* of 6.86 (meter reading). NOESY data were collected at 298 K using mixing times of 75, 150, and 250 milliseconds. Lowflip angle COSY, DQF COSY, TOCSY, and 31P-1H HPCOR and constant-time NOESY (CT-NOESY) were recorded as described previously. 9,10 For samples in water (90% H2O:10% D2O), imino proton spectra were obtained from samples in 50 mM NaCl, 10 mM sodium phosphate, and 0.1 mM EDTA at a pH of 6.6. Assignment and integration of two-dimensional spectra were done using SPARKY. 11 1H spectra were referenced to internal DSS and 31P spectra were referenced to 85% H3PO4 in a capillary and recorded at 298K.
Basepair Lifetimes
The base pair lifetime for the HIV-I and HIV-G hairpins was determined from the T 1 relaxation time of the imino protons in the presence of an ammonia catalyst. 12-14 The base pair exchange rate, τ ex, can be calculated from the following:
1/T 1 = 1/τ ex + 1/T 1 °
The T 1 experiments were performed at 278 and 298 K. T 1 ° is the relaxation time in the absence of any added catalyst. 13 The DNA samples of ~1 mM were prepared in a buffer of 50 mM NaCl, 10 mM NaP, 0.1 mM EDTA at a pH of 7.8. The pH was measured each time after catalyst was added. The NH4OH had a 6 M concentration and the concentration of the ammonia catalyst was calculated from the following:
[NH3] = [NH4OH] × 10(-pKa) / (10(−pH) + 10(−pKa))
The HIV-G-hairpin was titrated with the catalyst using catalyst concentrations of 2, 2.5, 3.5, 5, 10, 20, 40, and 100 mM. The HIV-I hairpin was titrated with the catalyst at catalyst concentrations of 5, 10, 15, 30, and 60 mM. The base pair lifetime at an infinite catalyst concentration can be estimated by the plot of 1/[cat] vs τ ex:
τ ex = τ open +1/(K d α[B]k i)
where α is a correction factor for the accessibility difference of imino protons between a mononucleotide and the open state of an oligonucleotide (α
Model Generation
The initial models for the hairpin structures were generated in the NAB module in AMBER as detailed previously, except that PARMBSC0 was used. 9 Briefly, LEaP was employed to generate topology and starting structure files. The DNA hairpins were then solvated in an octahedral box (10 Å from the solute) with 3453 TIP3P water molecules. Seventeen Na+ ions were added for electroneutrality and the system was then minimized with the DNA held rigid, force constant 500, prior to minimization of the entire system.
Structure Calculations
NMR assignments, restraint generation, restraint implementation, and structure calculation followed established protocols. 9,15 Briefly, 1H resonances were assigned via 2D 1H NOESY pathways with the assistance of TOCSY spectra. 31P resonances were assigned based on HPCOR experiments. NOESY cross peak volumes were integrated in SPARKY using a Gaussian or Sum Over Box method. 16 A percentage error was manually assigned based on visual inspection of a projected cross slice overlaid with the integral trace. For unresolved peaks, a Sum Over Box integration method was used and a higher percentage error was assigned. Quantitative distance restraints were derived using an iterative RANDMARDI procedure using CORMA, MARDIGRAS, and AMBER cycles as described previously. 9,15,17 R x values were calculated in CORMA using a correlation time (τ C) of 3.5 nanoseconds for base and sugar protons. DNA sugar pucker and pseudorotation angles were assessed using the Altona graphical method. 18,19 3JH1′- H2′1, 3JH1′-H2′2, 3JH1′-H3′, ∑ H1′, and ∑ JH3′ were measured from 31P decoupled low-flip angle COSY and DQF COSY experiments. Pseudorotation angles were derived for the dominant form of each deoxyribose and converted to torsion angle NMR restraints using the PUCKER script from AMBER. Backbone ε torsion restraints were calculated based on the ratio of peak heights from CT NOESY experiments as described in Tjandra and Bax. 10 Broad backbone torsion angle restraints for α, β, γ, and ζ were generated for nucleotides with typical Btype helix 31P chemical shifts using standard values for a B-type DNA helix. 20 Fully restrained solvated molecular dynamic simulations were run for 10 nanoseconds using a parmbsc0 force field at 300 K. Final ensembles were generated by sampling 10 structures at the end of the simulation followed by individual fully restrained minimization. The final structure was selected based on having the lowest overall CORMA R x score while maintaining a low level of restraint violations.
Structure Analysis
Helical analysis was performed on each final structure using Curves + in order to obtain intra-basepair and backbone parameters. 21 The output file will not include base opening parameters if the hairpins are run as a single strand of DNA so the hairpin loop was first removed from each structure file and the residue names were made contiguous so that Curves + would read the nucleotides in the correct order. RMSF calculations were done for the final trajectories (10 nanoseconds) using VMD. 11 The trajectory tool was used for the RMSF calculations for residues 4 and 15. For residue 4 the H2 on the inosine and the N2 and its hydrogens on the guanosine were purposefully excluded from the atom selection. Final structures were aligned according to the atom selection in each case prior to an all atom RMSD calculations.
Free MD Simulation
Each structure also underwent free MD (no restraints) at 300 K. 9 The final NMR derived hairpin structures were loaded into LEaP and solvated as already described under Model Generation but using PARMBSC1. System equilibration and fMD were carried out in the following order: initial minimization, then 200 picosecond isochoric isothermal MD to bring the temperature to 300 K, minimization, then four 125 picosecond isobaric isothermal MD (isothermal–isobaric) runs, with force constants of 5, 3, 2, and 1, each followed by minimization and finally a production MD (no constraints) for 1 microsecond with a 2 femtosecond time step. The resulting trajectories were loaded into VMD and RMSD calculations were performed as described in the Structure Analysis section.
Footnotes
Declaration of Conflicting Interests
The author(s) declared no potential conflicts of interest with respect to the research, authorship, and/or publication of this article.
Funding
The author(s) disclosed receipt of the following financial support for the research, authorship, and/or publication of this article: Part of this work was supported by the Georgia Cancer Coalition and a Brains and Behavior seed grant. Part of this work was supported by the Georgia Cancer Coalition and a Brains and Behavior seed grant.
Supplemental Material
References
Supplementary Material
Please find the following supplemental material available below.
For Open Access articles published under a Creative Commons License, all supplemental material carries the same license as the article it is associated with.
For non-Open Access articles published, all supplemental material carries a non-exclusive license, and permission requests for re-use of supplemental material or any part of supplemental material shall be sent directly to the copyright owner as specified in the copyright notice associated with the article.