
Abstract
The water soluble organic carbon of the prevalent atmospheric aerosol sources (traffic exhausts, paved road dust, agricultural soil, native soil, wood combustion, epicuticular waxes from pine and broad-leaved trees, and pollen) has been characterized using 1H (1-dimensional), 1H-1H-correlation spectroscopy and 1H-13C-heteronuclear single quantum correlation 2-dimensional (2D) nuclear magnetic resonance (NMR) spectroscopy. Traffic exhaust particles were mainly constituted of primary alcohols, carbohydrates, functionalized olefins, C3 and C4 oxy- and hydroxyl-carboxylic acids, and short-chain alkanes. Road dust was a mixture of soil particles and traffic components. Agricultural, natural, road dust, and traffic particles contained broad signals that were attributed to poly-carboxylic compounds typically found in humic compounds and humic-like substances. Traces of traffic particles (ie, peaks in the 7.3-7.5 ppm [phthalic acid derivatives] and signals found in the 0.5-3 ppm originating from functionalized carboxylic acids) were also found in natural soil dust. Long-chain (>C3) fatty acids and amino acids were found in road dust, natural soil, pine trees waxes, pollen, and woodburning. The aromatic region mainly constituted of lignin derivatives and cellulose/hemicellulose pyrolysis products (signals in 2D-NMR) in woodburning. Primary biogenic and woodburning particles were uniquely clustered as compared to traffic exhausts, road, agricultural, and natural dust based on the relative ratio of hydro-oxygenated functional groups (H-C-O and H-C-C=O) to the sum of aliphatics. Overall, source-specific NMR spectrometric fingerprints, functional composition profiles, and several organic compounds were identified allowing for the reconciliation of ambient organic aerosol sources including the degree of atmospheric aging.
The chemical composition of organic aerosol (OA) is of scientific interest due to its importance in climate, environmental chemistry, and human health impacts. 1,2 Sources of primary (ie, directly emitted in the atmosphere) OA include natural terrestrial plant epicuticular waxes and resin residues, windblown or mechanically resuspended soil dust, traffic exhausts, oil residues, and biomass burning. 3,4 Secondary OA (SOA, ie, formed in the atmosphere) are generated from the condensation of low-vapor pressure mono- and poly-functional organic compounds formed from the photo-oxidation of biogenic and anthropogenic volatile organic compounds. 5,6 Organic aerosol may add up to 90% of fine particle mass (PM2.5; particles with a diameter less than 2.5 μm); yet, no more than approximately 20% has been structurally identified mostly due to a large number of chemical species in variable concentrations and limitations of chromatography-based protocols. 3,7
One-dimensional (1D) proton nuclear magnetic resonance (1H-NMR) spectroscopy has been used to determine the compositional features of OA’s water-soluble fraction. 8 Two-dimensional (2D) homo- (1H-1H) and hetero (1H-13C) NMR has also been applied in an attempt to resolve the complex resonances and deduce structural information. Carboxylic acids (aliphatic, aromatic, ketoacids, and α,ω-diacids), methyl esters, phenols and methoxyphenols, phthalate, terephthalate, levoglucosan, methylsulfonate, ethanolamines, and polyhydroxy-ketones have been identified. 9–11 Furthermore, biomass burning, SOA, traffic exhausts, and pollen were reconciled through positive matrix factorization analysis of spectral fingerprints and δ13C isotopic ratios. 12
In this paper, we present the NMR spectral fingerprints of the water soluble fraction of major primary OA sources/types (ie, WSOC: water soluble organic carbon), namely traffic exhausts, paved road dust, agricultural dust, soil dust, pollen, epicuticular waxes from pine and broad-leaved trees, and woodburning 3,12 with the aim of characterizing their functional and molecular composition. Table 1 lists the TWSE (total water soluble extract) and functional group concentrations for the 8 OA types.
Total Water Soluble Extract (mg/g) and Functional Non-Exchangeable Organic Hydrogen (mmol/g) Concentrations (±Uncertainty) for Each Organic A Source/type.

The highest TWSE concentrations were observed for woodburning, pine waxes, and traffic accounting for 48.8%, 29.1%, and 16.8% of extracted particle mass, respectively. On the other hand, the lowest TWSE extracts were measured for agricultural and soil dust (0.6% and 1.4%, respectively). This may be attributed to the depletion of soil organic matter in agricultural soil and/or the presence of water insoluble soil organic matter (SOM, ie, humin). 13
Figure 1 shows the 1H-NMR spectra of the water soluble extract for each of the eight primary OA types. The predominant organic hydrogen type was [H-C-O]; its concentration ranged from 0.8 ± 0.1 to 24.6 ± 0.5 mmolH/g, followed by aliphatic hydrogen ([H-C] and [H-C-C=]). The saturated aliphatic hydrogen concentrations ([H-C]) (from 0.69 ± 0.1 to 13.1 ± 0.1 mmolH/g) exceeded those of the unsaturated ([H-C-C=]) (from 0.6 ± 0.1 to 8.1 ± 0.3 mmolH/g) in traffic exhausts, road, and agricultural dust but they were comparable or lower in soil dust and biogenic samples. For epicuticular waxes of pine needles and wood combustion, aromatic hydrogen levels (2.5 ± 0.1 and 1.7 ± 0.1 mmolH/g, respectively) comparable to those of R-H as compared to the remaining OA types, in which [H-Ar] levels were about 20% or lower of those measured for [H-C].

600 MHz 1H-NMR spectra of water soluble organic carbon (WSOC) of the 8 organic aerosol (OA) types in D2O (TSP-d4: internal standard, *: acetone, A: acetate, Ala: alanine, B: butyrate, Iso-B: isobutyrate, E: ethanol, Fo: formate, Fu: fumarate, F: fructose, G: glucose, GABA: gamma amino-butyrate, His: histidine, L: levoglucosan, La: lactate, P:propionate, PA: phthalate, PEG: polyethylene glycol, Py: pyruvate, S: sucrose, Q: quinine, Su:succinate, T: trigonelline, TPA: terephthalate, Tr: trehalose, Tyr: tyrosine, V: vanillin.
Furthermore, the relative distribution of the different types of non-exchangeable organic hydrogen has been applied to obtain information on the origin of OA. 14 Figure 2(a) shows the functional distribution diagram ([H-C-O]/sum(aliphatic) vs [HC-C = O]/ sum(aliphatics) concentration ratios, where sum(aliphatics) was the sum of [H-C], [H-C-C=], [H-C-O], and (aliphatic [C = O])) for the 8 OA types including the boundaries of ambient biomass burning, marine OA, SOA, urban, and rural aerosol obtained in previous field studies. 14–18 Unique and distinct functional patterns were observed for the 8 OA types. None of the OA samples of this study were within the previously determined regions for OA. This may be attributed to the atmospheric aging of ambient aerosol samples collected for long periods of time (12 hours or longer); thus, inherently subjected them to physicochemical transformations. We have recently showed distinct spectral profiles for fresh and aged biomass burning OA. 19 The 3 types of dust were in the same region with road dust being closer to primary traffic emissions. The latter was due to the extensive contamination of soil particles by traffic exhausts. The three OA samples of biological origin were associated with high [H-C-O]/sum(aliphatic) and low [HC-C = O]/sum(aliphatics) mostly for epicuticular waxes from pine and broad-leaved trees. Pollen and woodburning were very close. Dust and biogenic particles are larger in size, released into the atmosphere by mechanical processes (ie, wind and tire friction during driving) and are present in lower ambient levels as compared to traffic exhausts and biomass burning smoke, yet, they are involved in atmospheric chemical processes through the catalysis of heterogeneous reactions and nucleation, and have very important biogeochemical implications on regions located far away from their source areas. 20–22
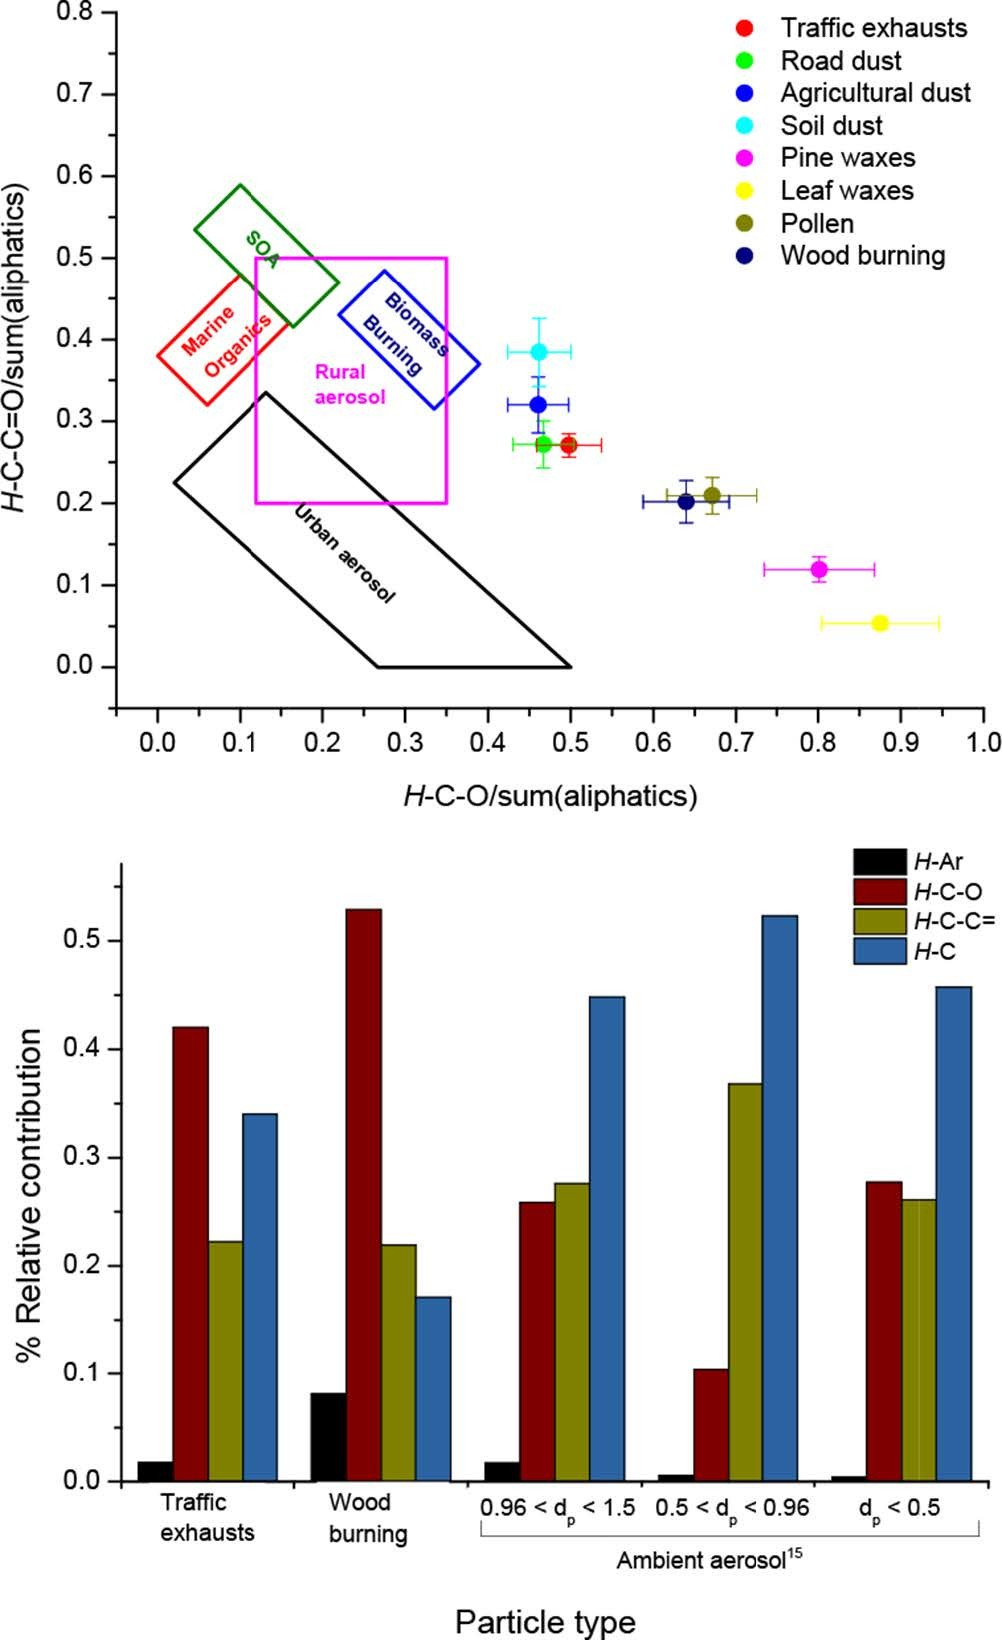
(a) Functional group distribution of WSOC for each OA type. The boundaries of biomass burning, marine and secondary aerosols, rural and urban, and (b) contribution of organic hydrogen in traffic exhausts, woodburning and ambient size distributed fine OAs.
Figure 2(b) shows the relative distribution of [H-C], [H-C-C=], [H-C-O], and [H-Ar] in traffic exhausts, woodburning, and ambient fine and ultrafine particles collected in the same region. The functional distribution diagram were within the biomass burning and SOA ranges. 19 Woodburning emissions were composed of 53% [H-C-O], 22% [H-C-C=], and 17% [H-C], while traffic exhausts consisted of 42% [H-C-O], 31% [H-C], and 22% [H-C-C=]. A stronger aliphatic component was computed for fine and ultrafine ambient aerosol samples (dominated by [H-C] (44-52%), followed by [H-C-C=] (23-36%)). The enrichment in saturated and unsaturated aliphatic carbon may be associated with several pathways including gas-to-particle partitioning of hot vapors, SOA formation and/or transformation of oxygen-containing organic compounds to aliphatic compounds. Most of the compounds that partition to the aerosol phase have oxygenated functional groups (eg, COOH and OH) that may not be observed by 1H-NMR in D2O due to H/D exchange but also have a strong aliphatic chain. Oxygen-containing organic compounds may react with OH radicals and the loss of oxygen atoms in the form of CO2. 3,23,24
A subset of chemical compounds were identified by means of reference NMR spectra and 2D 1H-1H correlation spectroscopy (COSY) and total correlation spectroscopy (TCOSY), and 1H-13C heteronuclear single quantum correlation (HSQC), NMR spectra (shown in Supplemental Information). The 1H-NMR spectra of traffic exhausts and road dust demonstrated multiple similarities including comparable resonance patterns in the aliphatic (δH ~ 0.9 – 1.3 ppm) region, previously attributed to humic-like substances. Phthalate and terephthalate were also observed in traffic exhausts and road dust in the δH ~ 6.5–8.0 ppm. Acetate (δH = 1.92 ppm) and formate (δH = 8.48 ppm) were identified in all dust samples (road, agricultural, and soil), which was consistent with previous studies. 19 Lactate (δH = 1.33 and 4.12 ppm) was identified in the 1D 1H NMR of road dust samples, but was also present in the HSQC of agricultural dust and COSY of soil dust, wood combustion, and pollen. Lactate is commonly found in soil dissolved organic matter, aerosols, and rain water. The agricultural and soil dust NMR spectra were described by broad envelopes of convoluted resonances in the aliphatic range (H-C) that may be attributed to the presence of large polyfunctional molecules in humin. On the other hand, the 1H-NMR spectral pattern of biogenic WSOC samples and woodburning were composed of convoluted but sharp resonances, with most of them in the carbohydrate (H-C-O), vinylic/acetalic (O-CH-O/H-C=), and aromatic (H-Ar) ranges. This indicated the mixture of methoxy (-OCH3) derivatives, alcohols, saccharides and anhydrides including levoglucosan. 19 The H-C-O region of traffic and biogenic particles were constituted of fructose, glucose, sucrose, and mycose (trehalose) that are commonly found in atmospheric and soil samples. 25
Pollen, pine, and leaf waxes were mainly constituted of glucose and fructose, sucrose signals were found in low intensity compared to other sugars. Shikimic (tri-hydroxy cyclohexene carboxylic acid) was found in pine waxes and quinic acid (1,3,4,5-tetrahydroxycyclohexane-1-carboxylic acid) was found in both pine and leaves waxes (and confirmed by the 2D NMR spectroscopy). Leaves and pine waxes resonances in the aromatic region were tentatively attributed to polyphenols substituted with alkene carboxylic acids such as p-coumaric acid, gallic, and caffeic acids. A mixture of maleic acid (cis-butene-dioic acid) and fumaric acid (trans-butene-dioic acid) were identified in pollen, while maleic acid only was found in leaf waxes, soil, and road dust, fumaric acid only in pine waxes and woodburning. A strong signal in the olefinic region from an alkene carboxylic acid at 5.8 ppm has been tentatively identified as another marker of agricultural, road and soil dust.
Figure 3 shows the 2D 1H-1H COSY NMR spectra for traffic exhausts, road dust, agricultural dust, soil dust, and pine waxes, leaf waxes, pollen and biomass burning. Cross peak regions labeled from A to I are drawn for clarity and comparison within the different sources. The molecular structures and the hydrogen assignments using 2D 1H-1H COSY and 1H-13C HSQC NMR spectra are shown in Figures S1 and S2, respectively. The region A (F2: 0.8–2.5 ppm/F1: 0.8–2.5 ppm) contained cross peaks corresponding to intra-aliphatic chain couplings between -CH3, -CH2-, and –CH- groups in aliphatic, α,ω-dicarboxylic acids, and neutral amino acids. 10

Two-dimensional correlation spectroscopy NMR spectra for traffic exhausts, road dust, agricultural dust, soil dust, and pine waxes, leaf waxes, pollen and biomass burning, respectively, and cross peak regions.
This region was particularly enriched in woodburning emissions and biogenic aerosol while the abundance of cross peaks in the region was minimal for agricultural dust. A characteristic signature of intra-aliphatic side chain couplings of neutral amino acids (leucine, isoleucine, and valine) were found in pollen, pine needles as well as in road dust and soil dust. Coupling between methylene groups in α- and β-positions to a carboxylic acid were present in road dust, soil, and to a lesser extent in traffic exhausts. 26 Differences were found in functionalized aliphatic compounds between traffic exhausts and road dust in this region. Cross peaks originating from terminal methyl and methylene groups in β-position or higher of branched aliphatic alcohol, ether, or ester compounds (F2/F1: δH 0.89/1.33 ppm, δH 1.55/0.86 ppm, δH 1.33/1.54 ppm, δH 1.79/1.29 ppm, and δH 1.97/1.33 ppm) were found in traffic exhausts. Cross peaks at F2/F1: δH 2.56/0.99 and δH 2.56/1.55 corresponding to resonance of aliphatic amines were observed in traffic particles. Ethylamine or methylamine derivatives are commonly found in polluted regions of mixed urban/agricultural settings. 27 Adipic acid (hexanedioic acid) was tentatively identified in soil, road dust, biomass combustion, pollen, and leaf waxes. Short-chain monocarboxylic acids, such as butyrate, valerate, propionic acid, and isobutyric acid (2-methylpropionic acid), were reported in WSOC of urban air particles. 28 Those compounds were found in road dust and soil dust but not in traffic exhausts.
Cross peaks in region B (δH F2/F1 2.4-3.2 ppm/0.9-1.4 ppm) were found only in woodburning and were attributed to branched methyl groups in α-position of aliphatic or aromatic carboxylic acids. This group of compounds was first characterized in COSY spectra of aerosols and water soluble hydrophobic acids during the winter season impacted by biomass burning. 10 Cross peaks in region C (δH F2/F1 1.8-3.3 ppm/1.8-3.3 ppm) include resonances present in road dust and traffic but not in soil dust (Gla, glutaric acid), indicating the contribution of traffic combustion compounds in this region. Cross peaks in woodburning and pine waxes were also abundant. Levulinic acid (4-oxopentanoic acid; C5H9O3), an acetyl derivative of succinic acid commonly measured in urban aerosols, was tentatively identified in this region.
The region D (F2: 2.9-4.5 ppm/F1:0.9-2.5 ppm) contains cross peaks between -CH2- or -CH3 of an aliphatic chain and a -CH- group adjacent to a heteroatom. The type of compounds in this region are attributed to alcohols, de-oxy sugars, ethers, and esters with the OH-CH2-CH2-CH(OH)-R structure, amino acids, hydroxyl-carboxylic acid (HOOC-CH(OH)-CH2-R), or acetate derivative (R-CO-O-CH2-CH3). The abundance of resonances in this region was high in woodburning and biogenic aerosol, followed by traffic exhausts, road dust, and soil particles. These resonances were previously observed in humic-like macromolecules. 13 2-Hydroxyglutaric acid has been identified in biomass burning particles and was observed in traffic exhaust, road dust, and biogenic particles. 29 Correlation between methyl and methylene in α-position of hydroxyl-carboxylic acid such as lactic acid was found in this region in road dust. Short-chain alkyl alcohols contributed to signals in this region and showed cross peak between the methylene groups closest to the hydroxyl group. Traffic particles had a large proportion of alcohol and amines. In agricultural dust, ethanol (F2/F1 1.20/3.61 ppm) was identified while other alcohol compounds might be present, such as 2,3-butanediol (1.15/3.61 and 1.15/3.72). This region also contains amino acid signals mainly found in pollen such as threonine, glutamic acid, proline, lysine, arginine, and valine. Other functionalized plant amino acids (ornithine) or (γ-aminobutyric acid) metabolites are also found in this region. 30
The region E (F2: 3.2-4.7 ppm/F1: 3.2-4.7 ppm) contains couplings between CH2 groups in polyols compounds. The signals in this region are complex and originate from a mixture of carbohydrates, sugar alcohols, and anhydrosugars due to microbial activity in soil particles and deposition of combustion products. On the contrary, agricultural and natural soil presented very few peaks in the polyols region probably due to the depletion of these compounds. Agricultural dust contained polyols with a mannitol signature at F2/F2 δH 3.85/3.75 and 3.78/3.67, polyethylene glycol at 3.74/3.64, and 1,2-dimethoxyethane (or monoglyme) at 3.71/3.40 ppm. In pine waxes, additional cross peaks probably originating from polyfunctionalized aliphatic chain linked to aromatic group in lignin compounds were present. 31 Signals in woodburning samples included couplings from intra-carbohydrate protons emitted from cellulose/hemicellulose combustion. Signals may also arise from poly-hydroxylated carboxylic acids (HOOC-(CHOH) n -CH2OH such as threonic acid (n = 2), glyceric (n = 1), glycolic (n = 0), or HOOC-(CHOH) n -COOH) identified in biomass burning aerosols tartaric (n = 2) and tartronic acids (n = 1). 29 Those compounds show a shift of -CH- group at lower field (from 3.7 to >4 ppm) while in α-position of a carboxylic acid and hydroxyl group as compared to an intra-chain hydroxyl group.
The region F (F2: 4.9-5.4 ppm/F1: 3.3-4.3 ppm) contains coupling between CH2 and CH in the anomeric position of cyclic carbohydrates found in sucrose, glucose, and trehalose. Glucose cross peaks in this region were abundant in road dust, pollen, and biogenic waxes, while very few peaks were found in woodburning and soil. Trehalose, main carbohydrate found in soil particles 32 was found in soil particles but not in road dust, indicating a difference of microbial environment in the two samples. Sucrose was found to be the major carbohydrate in traffic samples. The region G contains the couplings between CH2 and CH in the anomeric position of cyclic anydrosugars found in levoglucosan, Its stereoisomers and other anhydrosugars issued from the combustion of hemicellulose. The abundance of signals in this region was the highest in woodburning, followed by traffic and pine waxes. No peaks in this region were found in dust samples and leaf waxes. The region H (F2: 6.5-9.2 ppm/F1: 6.5-9.2 ppm) contains signals from between CH groups of aromatic rings. This region was highly populated in the biomass burning and pine waxes due to the presence of lignin derivatives, followed by pollen that contains aromatic amino acids and their precursors. Most of the cross peaks in the aromatic region of woodburning involved protons from vanillyl and guaiacyl compounds (4-hydroxy 3-methoxy phenyl compounds) emitted by the combustion of conifer woods. Other aromatic signals may arise from water soluble hydroxybenzoic acid, phenyl rings with aliphatic carboxylic acids (phenylbutyric acid and benzaldehyde). The 9.4 to 9.9 ppm range shows signals from aldehyde protons from cinnamaldehyde or benzaldehyde aromatic units (Supplemental data).
In traffic particles, cross peaks were identified corresponding to phthalates and a monobasic derivative. Cross peaks characteristic of para-substituted phenol aromatic ring (eg, tyrosine) were identified in road and natural dust. Resonances in leaf waxes were tentatively attributed to polyphenol with coupling from Hs in the 6.80 and 7.30 ppm and substituted phenyl with couplings from Hs in the 7.40-7.68 ppm region. Aromatic compounds substituted with unsaturated functionalized aliphatic chains such as phenylpropanoids and terpenoid indole alkanoids are found in plants. 33 Other alkaloids may contain olefinic protons resonating in the 5.75-6.14 ppm range, 34 polyols or carbohydrate moieties that could explain the variety of signals in the olefinic, allylic, and polyol regions of biogenic particles. The region I (F2: 5.7-7.3 ppm/F1: 1.6-6.2 ppm) contained couplings in functionalized unsaturated aliphatic chains. Protons in the F2 δH 5.5-6.2 ppm were coupled with protons in the F1 δH 1.8-5.5 ppm in pine waxes and F1 δH 5.05-5.30 pm in leaves. This indicated a clear difference in biomarkers extracted from deciduous and coniferous trees. Shikimate, an important secondary metabolite in plants was identified in pine waxes with characteristic signals both in both 1D and 2D NMR. It has been measured in biomass burning aerosols, but was not detected in this study for woodburning samples. 24
Figure 4 shows the 1H-13C HSQC of human and biogenic-activity-related OA types. Regions A through E show C (in the F2 dimension)-H (in the F1 dimension) connections in the aliphatic region. Region F shows the connections between ethylic carbon and ethylic and aromatic hydrogen, and region G show connections between aromatic carbons and hydrogens. Expansion of the COSY and HSQC spectra showing in detail each functional group regions are provided in the supplemental information. They represent coupling in the aromatics (H-Ar), saturated aliphatics (H-C), unsaturated aliphatics (H-C-C=), saturated aliphatics coupled to oxygenated compounds (H-C-O).

Two-dimensional heteronuclear single quantum correlation NMR spectra for traffic exhausts, road dust, agricultural dust, soil dust, and pine waxes, leaf waxes, pollen, and biomass burning, respectively, showing cross peak regions.
In the aliphatic region A (F2 10-50 ppm/F1: 0.8-1.8 ppm) and B (F2 15-55 ppm/F1: 1.8-3.2 ppm), terminal methyl (CH3-), methylene (CH2), and methine (CH) groups adjacent to oxygen or nitrogen heteroatoms have been observed as carbons signals arising at chemical shifts >15 ppm were mainly found, suggesting a high prevalence of fatty acids, amines, and polyols. In pine and leaf waxes, signals of methylene adjacent to -CHOH group of quinic acid was identified. Trimethylamine, dimethylamine (F2/F1 1H/13C, 2.73/37.35), and monomethylamine could be identified by C-H coupling. High intensity cross peaks in the F2/F1 1H/13C ranging from 1.25-1.35/20-37.35 ppm were observed in traffic and road dust. In the human-activity-related aerosols, the abundance of peaks was the highest for road dust. The HSQC of agricultural and soil dust shows higher intensity of lactic acid and acetate cross peaks than other compounds. The differences between dust samples allows to separate the contributions of traffic emissions to soil dust chemical composition. F2/F1 1.31/19.71 and 1.31/31.55 cross peaks were tentatively attributed to tert-butanol or long-chain fatty acid compounds (caprylic acid, palmitic acid). Signature of long-chain fatty acids were like those found in standard compounds. Cross peaks of dicarboxylic acid were attributed to butyric acid (C4) and valeric acid (C5) and adipic acid (C6) in soil and road dust. The region C (F2 40-60 ppm/F1: 3.0-4.4 ppm) show Cα-H of amino acids and contained most cross peaks in the pollen aerosols.
The region D (F2 60-90 ppm/F1: 3.0-4.6 ppm) contains resonances of oxygenated groups (H-C-O). Cross peaks allowed for assignment of a complex mixture of O- and N-alkyl groups from lignin and metabolites of microorganisms such as choline, as well as amino acids and carbohydrates/polyols. Those groups were predominant in all OA samples. In soil and agricultural soil, high intensity signals in the carbohydrate region (region D) was attributed to ethylene glycol derivatives and sugar-alcohol compounds such as threitol that does not have anomeric carbons. Threitol contains terminal -CH2OH groups with C-H signal appeared at about 65 ppm, and secondary alcohol -CH(OH)- signal appeared at 75 ppm (Supplemental data). Region E contained anomeric carbons and pyrolysis oils. In soil and agricultural dust, the anomeric C-H bonds of glucose was identified and couplings between C and H of anomeric pentose such as erythrose are found with C signals between 100 and 110 ppm in carbohydrate.
The region F (F2 100-130 ppm/F1: 4.8-7.8) ppm contains cross peaks of allylic compounds (-CH = CH-) from oxygenated allylic compounds. Shikimic acid derivatives are used in agriculture as herbicides and antibacterial agents because of ability to inhibit the shikimate pathway in plants. 35 Shikimic acid is a precursor of aromatic amino acids (tyrosine, phenylalanine, and tryptophan). Heteronuclear single quantum correlation spectra showed cross peaks of these amino acids. Those compounds constitute most of the peaks in the G region (F2 115-150 ppm/F1: 6.5-8.5) as this region showed most peaks in biogenic samples, including biomass burning. Allylic (region F) and aromatic (region G) groups were dominant in biogenic aerosols, particularly pollen and pine waxes. Lignins present in biomass mainly consists of p-hydroxyphenyl, guaiacyl, and syringyl units that are linked through different side-chain linkages with several types of carbon-carbon and ether bonds. The HSQC of biomass burning shows signature of lignin pyrolysis products involving different side-chain linkages and aromatic units: β-O-4 linkage. The aromatic section also shows the predominance of vanillin (4-hydroxy-3-methoxybenzaldehyde) and vanillic acids (4-hydroxy-3-methoxybenzoic acid) C-H connections.
Overall, the analysis of major types of primary OA by 1D 1H and 2D homonuclear and heteronuclear NMR spectroscopy demonstrated unique spectral fingerprints and relative functional composition. In addition, a series of organic compounds have been identified for each OA type. These results will enable further research on apportioning the sources of ambient OA by chemical mass balance. Moreover, the effect of atmospheric aging on the composition of OA may be identified by direct comparison of spectral fingerprints obtained in this study and ambient aerosol.
Experimental
Sample Collection and Processing
Aerosol samples of traffic exhausts, paved road dust, agricultural dust, soil dust, pollen, pine, and broad-leaved trees and wood combustion particles were obtained by adapting protocols previously developed for the chromatographic analysis of OA 36–39 as follows: (i) Traffic exhausts were collected at the lowest level of an underground 5-floor parking lot at the University of Arkansas for Medical Sciences from 6 am to 6 pm during weekdays. Samples were obtained on a prefired quartz fiber filter mounted on a high volume sampler; (ii) woodburning samples were collected by burning 2 kg of commercially available wood logs in a traditional brick fireplace using a PM10 aerosol sampler operating at 10 L/min for 30 minutes; (iii) road dust samples were collected by sweeping with the dustpan and brush from a variety of surface streets in Little Rock, Arkansas. For each sample, the width of the collection area was approximately 3 m and it was located at least 10 m away from the nearest intersection. The sweep method may result in an underestimation of fine particles compared to the total mass; however, the effect on our analysis was negligible because of subsequent sieving and resuspension prior to the analysis; (iv) the top 1 cm grab samples of native and agricultural soils were obtained from bare surfaces and agricultural fields in central Arkansas; (v) equal quantities of needles from pines, oak trees, and hickory trees were obtained and placed in a Teflon bag. Flowers and conifer seeds were also obtained from the same plants during the pollination season (March-April). Surface epicuticular waxes and pollen particles (separately) were removed by agitation. Note the objective was to obtain samples of OA sources that were representative in the region for subsequent comparison with spectral profiles of ambient OA samples in the same region. Road, agricultural, and native dust, lipids of evergreen and deciduous terrestrial plants and pollen were sieved to separate the <35 µm particles, aerosolized in an in-house resuspension chamber 40 and collected on quartz filters. Filters were extracted with 5 mL of ultrapure H2O in an ultrasound bath for 1 hour. The aqueous extract was filtered on 0.45 µm polypropylene filter (Target2, Thermo Scientific), transferred into a preweighted vial (for the gravimetric determination of the total soluble extract, dried using the SpeedVac apparatus and re-dissolved in 500 µL of D2O containing 0.248 μmol/mL trimethylsilyl-propionic acid-d4 sodium salt (TSP-d4) as the internal standard. One hundred µL of a buffer solution (0.2 M Na2HPO4/0.2 M NaH2PO4, pH 7.4) and 100 µL of NaN2 (1% w/w) was added in the sample to control for sample pH and suspend microbial degradation.
Nuclear Magnetic Resonance Spectroscopy
The 1H-NMR spectra were obtained on a Bruker Avance 600 MHz instrument equipped with a 5 mm CP TCI600S3 H-C/N-D-05 Z cryogenic probe fitted with an actively-shielded single axis z-gradient. Acquisitions were done with Digital Quadrature Detection (DQD, 10 µs prescan delay). 1H-NMR spectra were recorded at 298K with a gradient-based zgesgp pulse sequence and solvent suppression with 1D excitation sculpting using 180 water-selective pulses (ES element), 1.7 s acquisition time, 7 μs 90° excitation pulses (p1), 1 s relaxation delay (d1), 8192 scans, total data (TD) point 32K. Spectra were processed with a 0.3 Hz exponential line broadening and zero filling is applied to obtain final data point of 64K. The baseline was corrected and spectra integrated using the Advanced Chemistry Development NMR prediction suite 2017. The determination of chemical shifts (δ1H) is done relative to that of TSP-d4 (set at 0.0 ppm). Phase sensitive 2D double quantum filter DQF-COSY (1H-1H homonuclear shift correlation spectroscopy) experiments were acquired with the pulse program cosydfesgpph. The pulse program includes solvent suppression using 1D excitation sculpting (ES element) and gradient pulses. DQF-COSY were recorded using acquisition times of 0.1420 s in F2 and 0.0355 s in F1, 10.5 μs 90° excitation pulses (p1), 2 s relaxation delay (d1), 32 scans over 512 experiments, TD point 2048 and F1 States-TPPI acquisition mode. Spectra were then computed to a 2048 × 1024 matrix with 1 Hz (F2) and 0.3 Hz (F1) exponential multiplication and squared shifted sine bell in both dimensions (Π/9). Phase-sensitive 1H-13C correlation HSQC spectra (heteronuclear single quantum correlation; hsqcetgp) were acquired using echo-antiecho gradient selection in the F1 detection mode with decoupling during acquisition and conditions as follows: 64 scans in the F2 dimension over 256 experiments in the F1 dimension, 1024 data points (TD, F2), 1J CH coupling constant of 145 Hz (CNST2), 16 dummy scans; F2 (1H) parameters: spectral width (SW) of 7812 Hz (13.02 ppm), frequency offset (O1) of 2821 Hz (O1P 4.7 ppm), acquisition time (aq) 65.5 ms, 7 μs 90° excitation pulses (p1), 1.5 s relaxation delay (d1); F1 (13C) parameters: SW = 165 ppm, O1 = 75.0 ppm, acquisition time 5.1 ms, garp composite pulse 13C decoupling program (60 µs PCPD2). The integration of 1H-MR spectra was done in 5 predefined ranges were integrated as follows: (i) H-C (δH 0.6-1.8 ppm) that included R-CH3, R-CH2, and R-CH protons; (ii) H-C-C= (δH 1.8-3.2 ppm) included protons adjacent to a double bond and amines (H-C-NR2); (iii) H-C-O (δH 3.2-4.4 ppm) contained alcohols, ethers and esters; (v) O-CH-O and H-C= (δH 5.0-6.4 ppm) included anomeric protons of carbohydrates and olefins; and (iv) H-Ar (δH 6.5- δ 8.3 ppm) contained aromatic protons. The detection limits were, 0.03, 0.03, 0.02, 0.01, and 0.10 μmol/g for the 5 ranges.
Footnotes
Acknowledgements
The NMR experiments were performed at the UAB Cancer Center High-Field NMR Facility supported by the National Institutes of Health (NIH) (Grant # 1P30 CA-13148).
Declaration of Conflicting Interests
The author(s) declared no potential conflicts of interest with respect to the research, authorship, and/or publication of this article.
Funding
The author(s) declared no financial support for the research, authorship, and/or publication of this article.
Supplemental Material
References
Supplementary Material
Please find the following supplemental material available below.
For Open Access articles published under a Creative Commons License, all supplemental material carries the same license as the article it is associated with.
For non-Open Access articles published, all supplemental material carries a non-exclusive license, and permission requests for re-use of supplemental material or any part of supplemental material shall be sent directly to the copyright owner as specified in the copyright notice associated with the article.