
Abstract
Background:
As type 2 diabetes mellitus (T2DM) becomes an increasingly urgent global health concern, interest has grown in how screen-based behaviors contribute to its risk. Excessive screen exposure is often associated with sedentary lifestyles, poor sleep quality, and circadian disruption—all potential contributors to T2DM. Yet, how screen time interacts with specific sleep characteristics in shaping diabetes risk remains underexplored.
Objective:
This study investigates the relationship between screen exposure and T2DM risk, with particular focus on sleep duration and diagnosed sleep disorders as potential effect modifiers. We also explored variation by age, sex, and racial/ethnic groups.
Methods:
We analyzed data from 23 023 US adults in the 2007 to 2016 National Health and Nutrition Examination Survey. Screen exposure was dichotomized using age-specific thresholds (≥2 vs <2 hours/day for ages 3 to 18; ≥3 vs <3 hours/day for adults). Type 2 diabetes mellitus was defined by self-reported physician diagnosis. Sleep duration and diagnosed sleep disorders were examined as modifiers. Missing data were handled using multiple imputation by chained equations, and survey-weighted multinomial logistic regression was applied.
Results:
High screen exposure was associated with increased odds of T2DM in fully adjusted models (odds ratio [OR] = 3.47, 95% confidence interval [CI]: 2.74, 4.36). Sleep duration was not independently associated with T2DM, whereas sleep disorders were linked to approximately twofold higher odds (OR = 2.21, 95% CI: 1.17, 4.18). The screen-T2DM association was stronger among females than males, with variation observed across sleep and racial/ethnic subgroups.
Conclusion:
Excessive screen time is linked to elevated T2DM risk, particularly among females and individuals with sleep disorders. Longitudinal research is needed to assess causality and inform targeted interventions.
Keywords
Background and Problem Statement
Type 2 diabetes mellitus (T2DM) continues to pose a major challenge to global public health, with over 537 million adults affected and projections reaching 783 million by 2045. 1 While genetics play a role, lifestyle factors, such as poor diet, physical inactivity, and sedentary behaviors, are major drivers of this epidemic. Screen exposure, including television watching, smartphone usage, and computer time, is contributing to the metabolic dysregulation. Prolonged screen time is associated with reduced physical activity, disrupted sleep patterns, and increased exposure to artificial light, all of which may influence glucose metabolism. Circadian rhythm disruptions due to excessive screen exposure at night have been linked to insulin resistance and increased diabetes risk. However, while studies have demonstrated associations between screen exposure and adverse metabolic outcomes, the biological and behavioral pathways underlying these associations remain unclear.
Biological Plausibility and Exposure Pathway Mechanism (Pathogenesis)
A growing body of experimental literature provides biological pathways that may explain how prolonged sedentary screen time contributes to impaired glucose metabolism. Prolonged sitting has been shown to reduce skeletal-muscle glucose uptake through downregulation of GLUT4 translocation, thereby diminishing insulin-stimulated glucose disposal. Exposure to artificial light at night suppresses melatonin, a hormone involved in nocturnal glucose regulation, leading to reduced insulin sensitivity and impaired β-cell function. Laboratory studies of sleep restriction demonstrate elevations in evening cortisol, decreased leptin, increased sympathetic activation, and measurable reductions in glucose tolerance,2,3 indicating that circadian misalignment and autonomic imbalance play key roles in metabolic dysregulation. Together, these pathways provide biological plausibility for the observed association between high screen exposure—particularly in evening hours—and elevated T2DM risk.
Evidence Gap
Despite growing interest in this topic, research findings on the screen time-T2DM relationship have been inconsistent. Some studies report a strong association between high screen exposure and increased diabetes risk, 4 while others suggest no significant connection.5,6 These conflicting results may stem from differences in population characteristics, study design, or analytical methods. In addition, limited evidence has focused on how sleep—especially sleep disorders—might mediate or modify the effects of screen exposure on diabetes risk. This gap highlights the need for more comprehensive research that accounts for both behavioral exposures and sleep health. Therefore, the study addresses the following objectives to evaluate the association between 30-day averaged daily screen exposure and the risk of T2DM status as measured by the self-reported physician diagnosis.
Study Objectives
To examine whether higher levels of screen exposure—including time spent watching television, using computers, and mobile phone use—are associated with an increased T2DM risk, while accounting for demographic, socioeconomic, and sleep-related covariates.
To explore the relationship between sleep characteristics, including sleep duration and self-reported sleep disorders (disturbances), and T2DM risk.
To investigate whether sleep functions as a potential mediators or effect modifiers in the association between screen exposure and T2DM.
To assess whether this association differs by sex and age, and to identify high-risk subgroups within the population.
Methods
Study Design and Data Source
We conducted a cross-sectional analysis using data from the 2007 to 2016 US National Health and Nutrition Examination Survey (NHANES), a nationally representative survey of the civilian, non-institutionalized population conducted by the National Center for Health Statistics (NCHS) in two-year cycles. The NHANES employs a complex, stratified, multistage clustered probability sampling design to ensure national representativeness. It integrates household interviews and physical examinations in mobile examination centers (MECs) for laboratory sample collection. Primary sampling units (PSUs), secondary sampling units, and individuals within households are selected using unequal probabilities. To account for this complex design, all analyses incorporated MEC-specific sample weights, strata, and PSUs, which allow population-level inferences.
This study analyzed publicly available, de-identified NHANES data, adhering to ethical guidelines. The NHANES data collection procedures were approved by the NCHS Ethics Review Board, and written informed consent was obtained from all participants. As this study involved secondary analysis of anonymized data, no formal ethics review was required.
Study Population
Participants aged 2 to 79 years were eligible. Those aged ≥80 were excluded due to top-coded age. For 2007 to 2010 cycles, only children aged 2 to 11 were included due to screen time data availability. Individuals missing exposure or outcome data were excluded given the randomness of these variables cannot be accurately predicted, resulting in an analytic sample of 23 023 participants.
Exposure Assessment
Screen time was dichotomized as ≥2 hours/day versus <2 hours/day among the sample aged 3 to 18 years, and ≥3 hours/day versus <3 hours/day among the sample aged 18 years or above, derived from self-reported responses in the NHANES physical activity and sedentary behavior questionnaires. Participants were asked how many hours per day they usually spent sitting and watching TV, videos, or using a computer outside of work. These responses were cleaned and categorized into to reflect low and high levels of screen exposure. Responses, such as “Refused” or “Don’t know,” were coded as missing values (NA). For individuals with daily screen exposure below the age-specific thresholds (<2 hours/day for those aged 3 to 18 years and <3 hours/day for adults), we refer to them as the “low-exposure” group, which served as the reference category.
Specifically, screen exposure time was dichotomized using a two-hour cutoff in children, aligning with the public health guidelines from the American Academy of Pediatrics. 7 The guideline recommends that children and adolescents limit screen use to no more than one to two hours per day of high-quality content. While the World Health Organization 8 recommends less than one hour of daily screen time for children aged two to four years, a two-hour threshold remains a pragmatic cutoff in youth screen exposure research, aligning with national movement behavior guidelines for children and youth in Canada. 9 For adults aged 18-64 and older adults aged 65 years and above, we applied a three-hour cutoff, informed by the Canadian Society for Exercise Physiology adult (18-64 years) and older adult (65+ years) movement guidelines, which emphasize minimizing prolonged sedentary behaviors and reducing extended sitting time.10,11 This age-specific categorization avoids applying pediatric thresholds to adults and provides a more realistic contrast for adult screen-time distributions.
Outcome Definition
The outcome variable was the T2DM, assessed through self-reported physician diagnosis (DIQ010), excluding gestational diabetes. Those who answered “Yes” were categorized as having T2DM and those with “Borderline” were categorized as a distinct borderline category. Answers to “No” articulate the reference category. Individuals who responded “Refused” or “Don’t know” were treated as missing unless further biomarker data (eg, HbA1c, fasting glucose) confirmed diabetes status.
Covariates
Confounders were identified based on a systematic review, using directed acyclic graph (DAG) to construct minimally sufficient adjustment set (Figure 1). Categorical responses, such as “Refused” or “Don’t know,” were coded as missing.
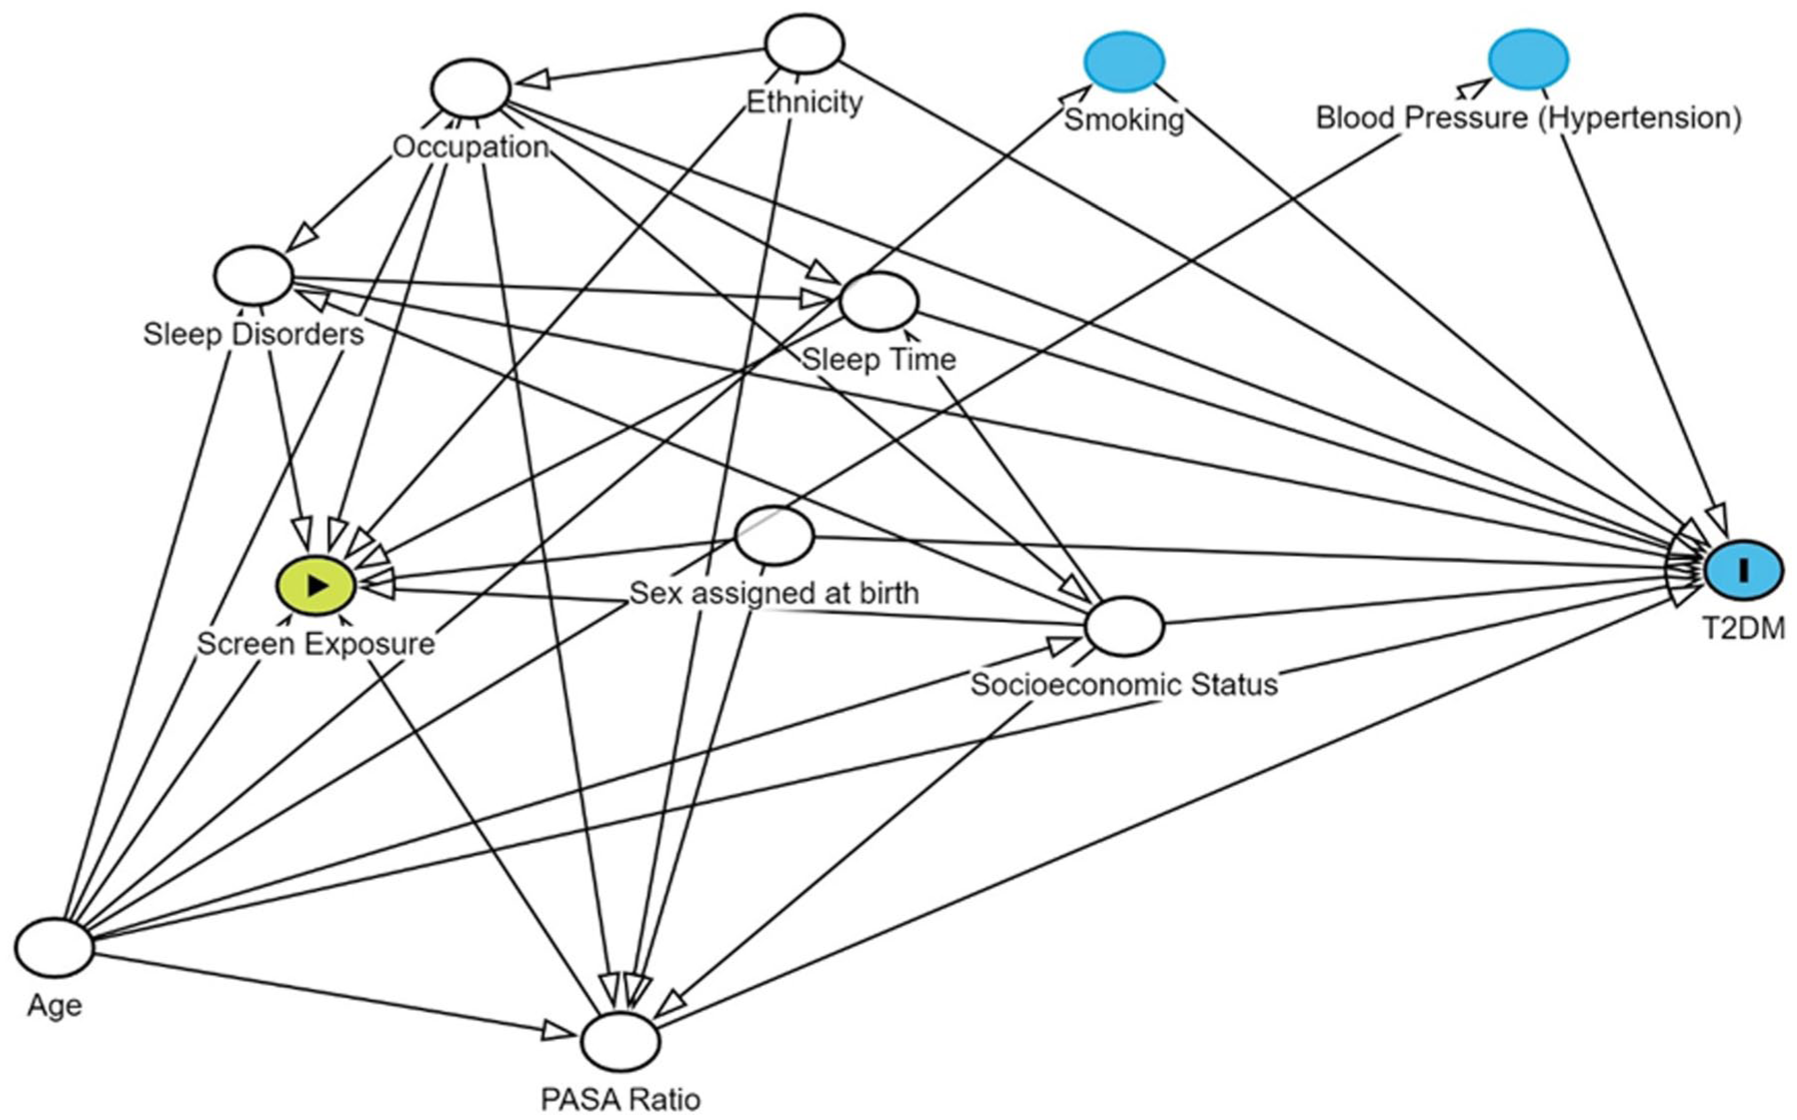
Directed acyclic graph (DAG) of intervention, outcome, and confounder variables.
Demographic variables
Age was treated as a continuous variable representing participants’ age in years. Sex assigned at birth was coded categorically as “Male” or “Female,” based on NHANES coding. “Male” was designated as the reference group due to its larger sample size, which helped to enhance model stability and minimize standard error (SE) variability. Similarly, race/ethnicity was categorized into five mutually exclusive groups: “Mexican American,” “Other Hispanic,” “Non-Hispanic White” (reference), “Non-Hispanic Black,” and “Other Race—Including Multi-Racial.” Non-Hispanic White was selected as the reference category for comparability and model robustness.
Lifestyle factors
To account for behavioral balance between physical activity and sedentary time, we calculated the physical activity to sedentary activity (PASA) ratio, defined as the total daily minutes spent in moderate-to-vigorous physical activity (MVPA) divided by minutes of sedentary behavior, excluding sleep. Moderate-to-vigorous physical activity included transportation-related walking or biking (PAD645), recreational activities (PAD660 and PAD675), and work-related exertion (PAD615 and PAD630). Sedentary time was derived from minutes spent sitting or reclining during waking hours (PAD680). The PASA ratio, treated as a continuous variable, provides a relative measure of lifestyle balance, with higher values indicating a more active daily profile. This ratio-based approach has been validated in prior studies examining cardiometabolic risk in youth and adults. PASA data were available only for participants aged 12 years and older; missing responses were addressed through multiple imputation.
Sleep-related characteristics
Sleep disorder status was assessed using self-reported physician diagnosis, based on the question: “Have you ever been told by a doctor or other health professional that you have a sleep disorder?” (SLQ060 and SLQ050 in Cycle 2015-2016). This variable was coded categorically and only collected for individuals aged 16 years or older. Sleep duration, also self-reported, was measured as average hours of sleep per night (SLD010H and SLD012), and treated as a continuous variable. As with sleep disorder status, data for this variable were restricted to respondents aged 16 and above; missing entries were imputed and sleep disorder diagnosis below 16 years were included in the analytic sample after multiple imputation.
Socioeconomic variables
Socioeconomic status was captured by the income-to-poverty ratio, a continuous variable reflecting the ratio of household income to the federal poverty threshold, with higher values indicating relatively greater economic advantage.
Finally, occupational/industrial risk of screen exposure was coded/collapsed into three levels—“High Likelihood of Exposure,” “Moderate Likelihood of Exposure,” and “Low Likelihood of Exposure” (reference)—based on NHANES industry group classifications (OCD231). Respondents with missing, unknown, or refused occupational codes were treated as missing.
Data Preparation
All categorical variables were recoded for clarity, with non-informative responses (“Refused,” “Don’t know,” or missing) coded as NA. Occupational screen exposure categories were collapsed into three levels based on prior literature. Continuous variables were used as reported.
Statistical Analysis
Descriptive analysis
Descriptive statistics were calculated using survey-weighted and design-adjusted procedures to account for the complex sampling structure of NHANES. Continuous variables were summarized as weighted means and standard deviations (SDs), whereas categorical variables were expressed as weighted proportions. Patterns of missingness were examined visually prior to multiple imputation.
All analyses were conducted using R (version 4.2.1) with appropriate survey and data processing packages to account for complex sampling, imputation, and modeling procedures, including survey, DataExplorer, mice, and mitools.
Missing Data Imputation and Statistical Inference
The primary analysis addressed missing data using multiple imputation by chained equations (MICE) under the assumption of missing at random (MAR). Variables with >10% missingness after imputations were excluded from subsequent models to minimize potential bias.
A survey-weighted generalized multinomial multivariable logistic regression model was fit to each imputed data set to estimate the association between screen exposure and the odds of T2DM diagnosis, with results pooled using Rubin’s rules. In addition, the effect measure modifications (EMMs) of sex, age, race/ethnicity, PASA ratio, and sleep metrics (sleep duration and disorders) with the daily screen time were explored and examined. Subgroup analyses stratified age group and sex were also be computed. Archer-Lemeshow goodness-of-fit was used to compare model fits for survey data, and we applied Wald test for testing for the interaction terms between two nested models (full and reduced models) and whether such term should be included in our final adjusted model.
Sensitivity Analyses
Sensitivity analyses included complete-case models, excluding any observations with missing data.
Result
Handling Missing Data
Smoking status, hypertension, and health insurance coverage were included as auxiliary variables in the imputation model due to their associations with both exposures and outcomes, despite partial missingness (Table 1). Smoking status was categorized using the standard 100-cigarette threshold, with “never-smokers” defined as those who reported smoking fewer than 100 cigarettes in their lifetime (SMQ020) (see Supplements).
Variable-Level Missing-Data Patterns, Imputation Rationale, and Analytic Inclusion in the Final Adjusted Regression Mode Lin the National Health and Nutrition Examination Survey (NHANES) Analytic Data Set (2007-2016).
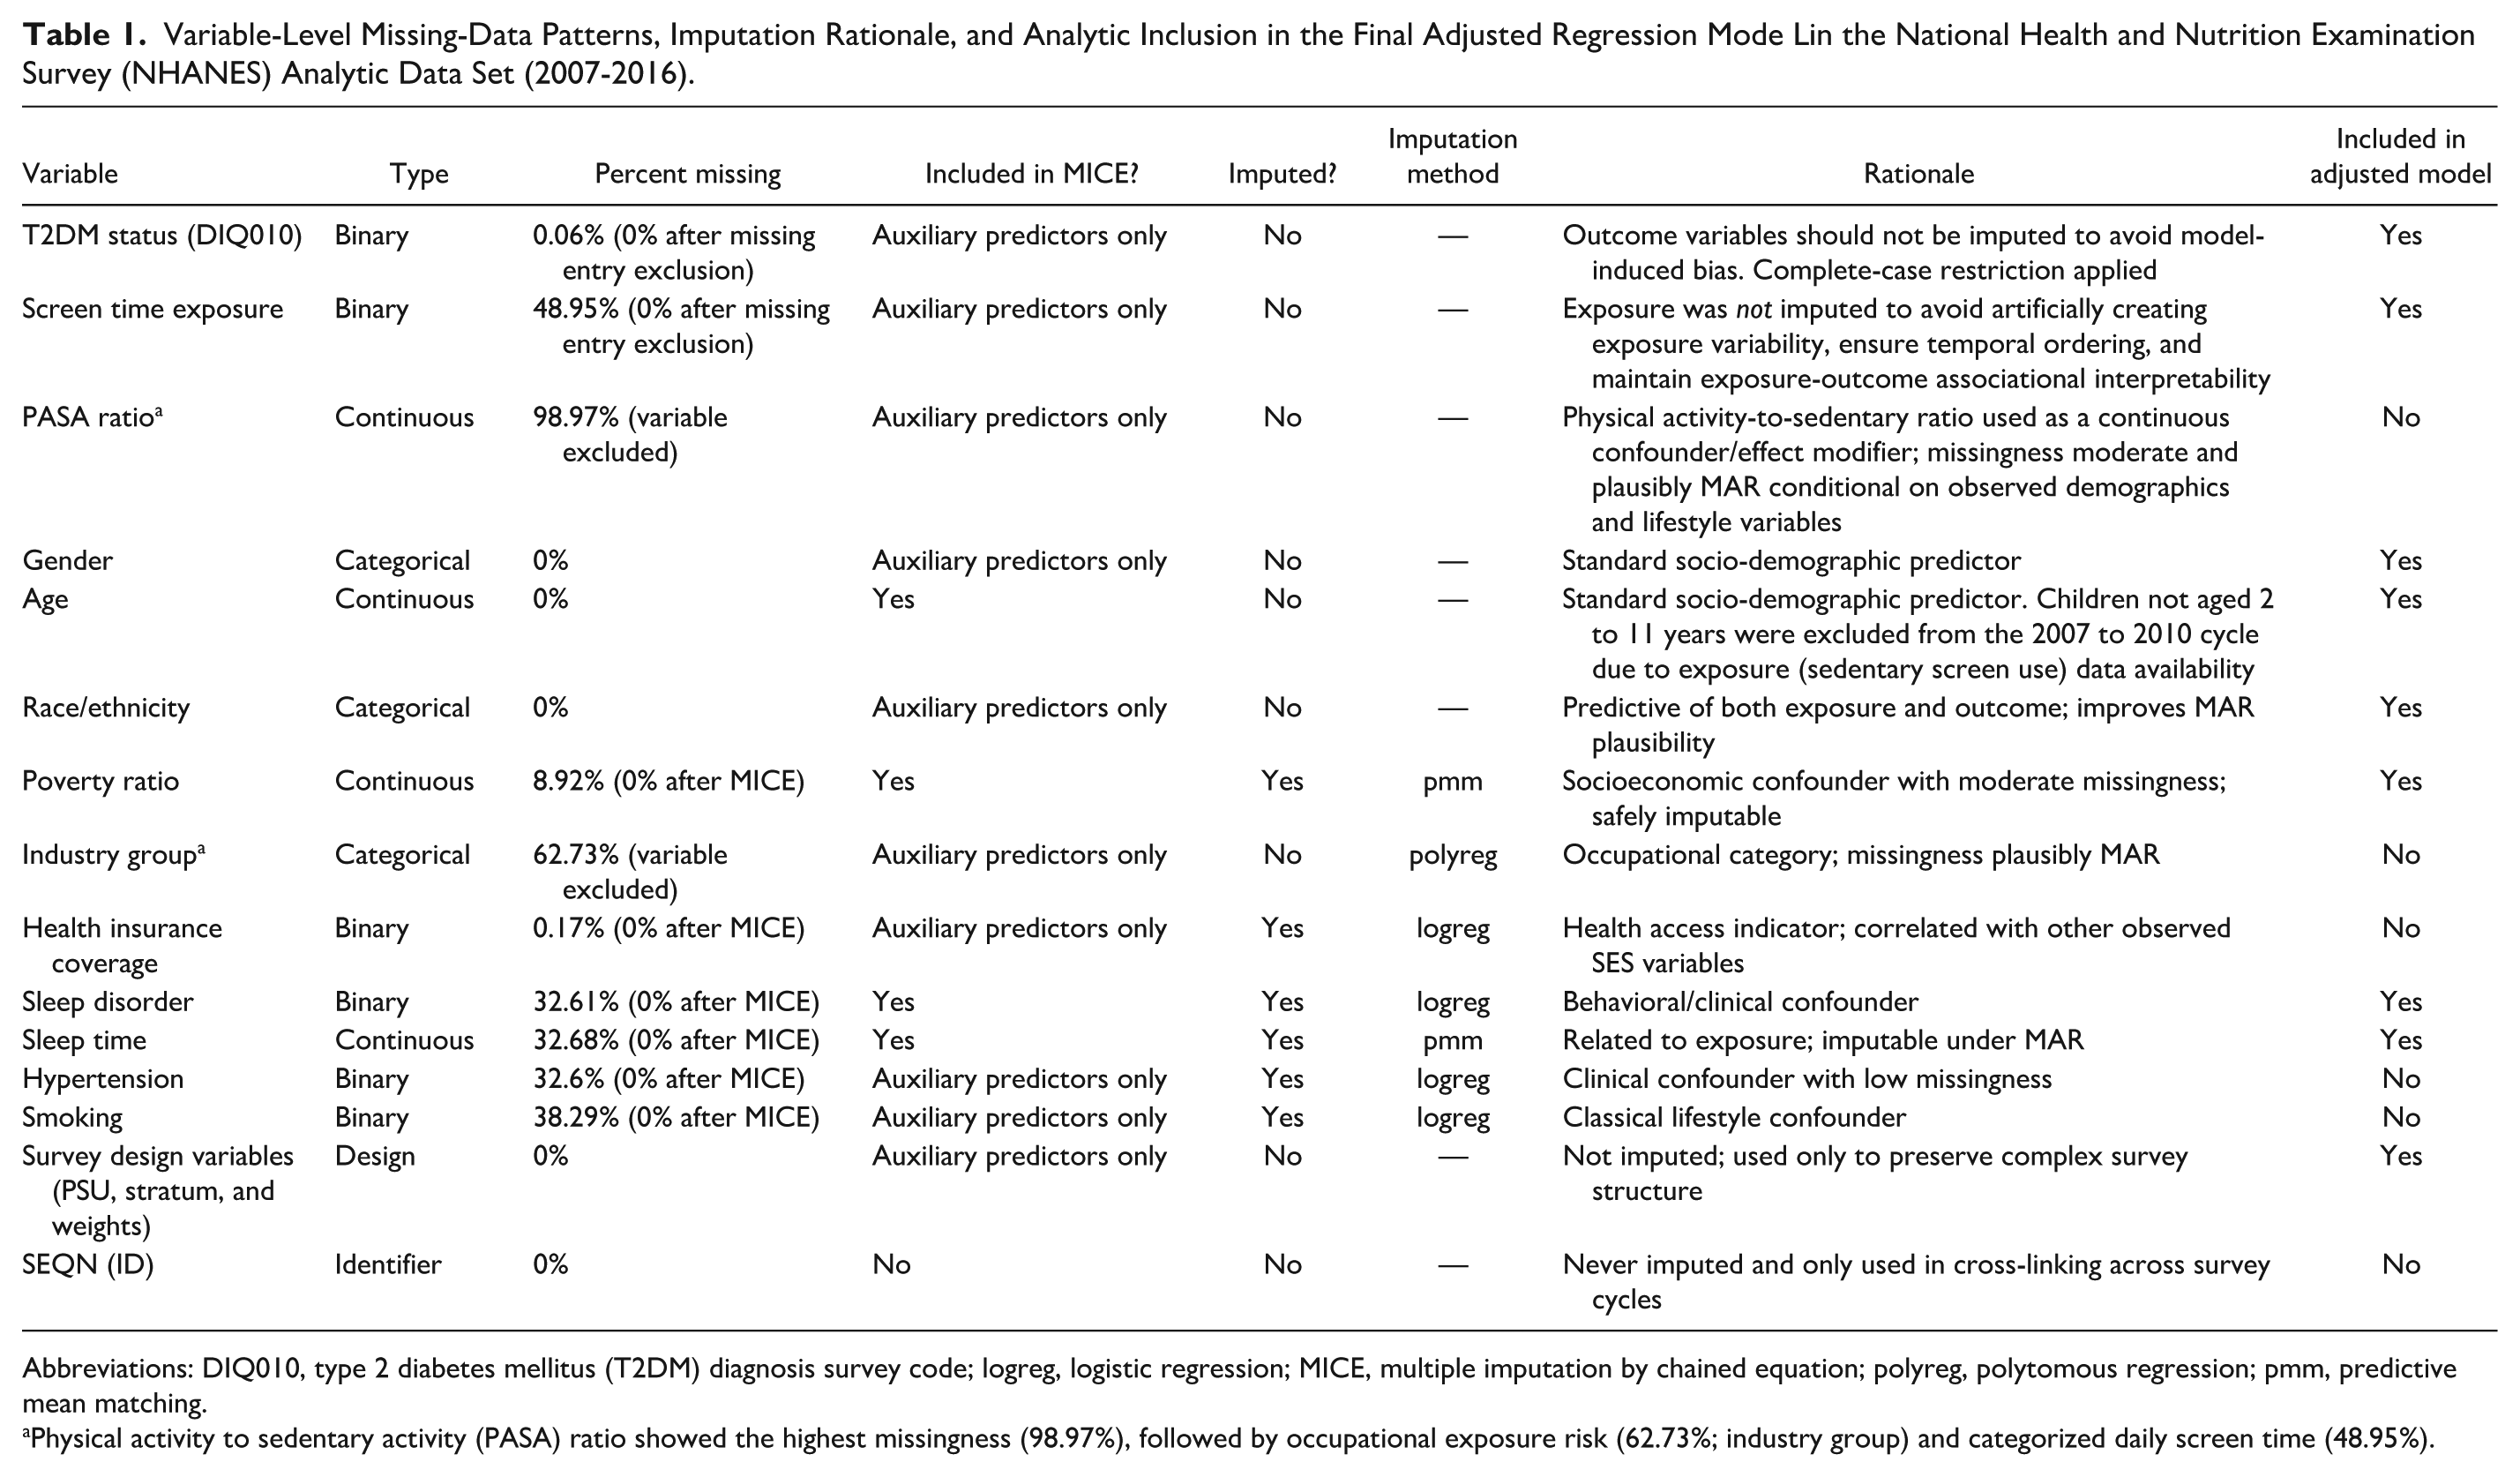
Abbreviations: DIQ010, type 2 diabetes mellitus (T2DM) diagnosis survey code; logreg, logistic regression; MICE, multiple imputation by chained equation; polyreg, polytomous regression; pmm, predictive mean matching.
Physical activity to sedentary activity (PASA) ratio showed the highest missingness (98.97%), followed by occupational exposure risk (62.73%; industry group) and categorized daily screen time (48.95%).
The imputation model included all variables used in the primary analysis. However, the PASA ratio was excluded due to excessive missingness (98.97%) stemming from incomplete reporting of both sedentary time and physical activity, primarily among participants aged under 12. Given limited data support and concerns over violating the MAR assumption, imputation was not pursued for this variable. Similarly, occupational screen exposure risk was excluded from the main models due to high item non-response and insufficient auxiliary information for imputation (Table 1).
Although the screen-time variable exhibited substantial missingness (~49%), it was intentionally not imputed to avoid generating artificial exposure values and to preserve the temporal and associational structure of the analysis (See Supplements). Multiple imputation was applied only to covariates, consistent with recommended practice for handling incomplete confounders while retaining complete-case exposure and outcome data.12,13 The plausibility of the MAR assumption was evaluated by assessing empirical associations between missingness and observed socio-demographic and behavioral variables (eg, age, sex, smoking status, hypertension, health insurance coverage, and occupational exposure risk group), all of which were included in the imputation model. These patterns support an MAR mechanism for covariates, while the large proportion of missingness in the exposure does not affect the imputation procedure because the exposure was not imputed.
Other key variables, including sleep variables and the income-to-poverty ratio, were successfully imputed and retained in the final models (Table 1).
Descriptive Characteristics
The weighted study population represented approximately 1.44 billion US individuals based on 23 023 participants from the 2007 to 2016 NHANES cycles (Table 2).
Survey-Weighted Descriptive Characteristics of the Study Population by NHANES Cycles (2007-2016)—Representative of the US Population.
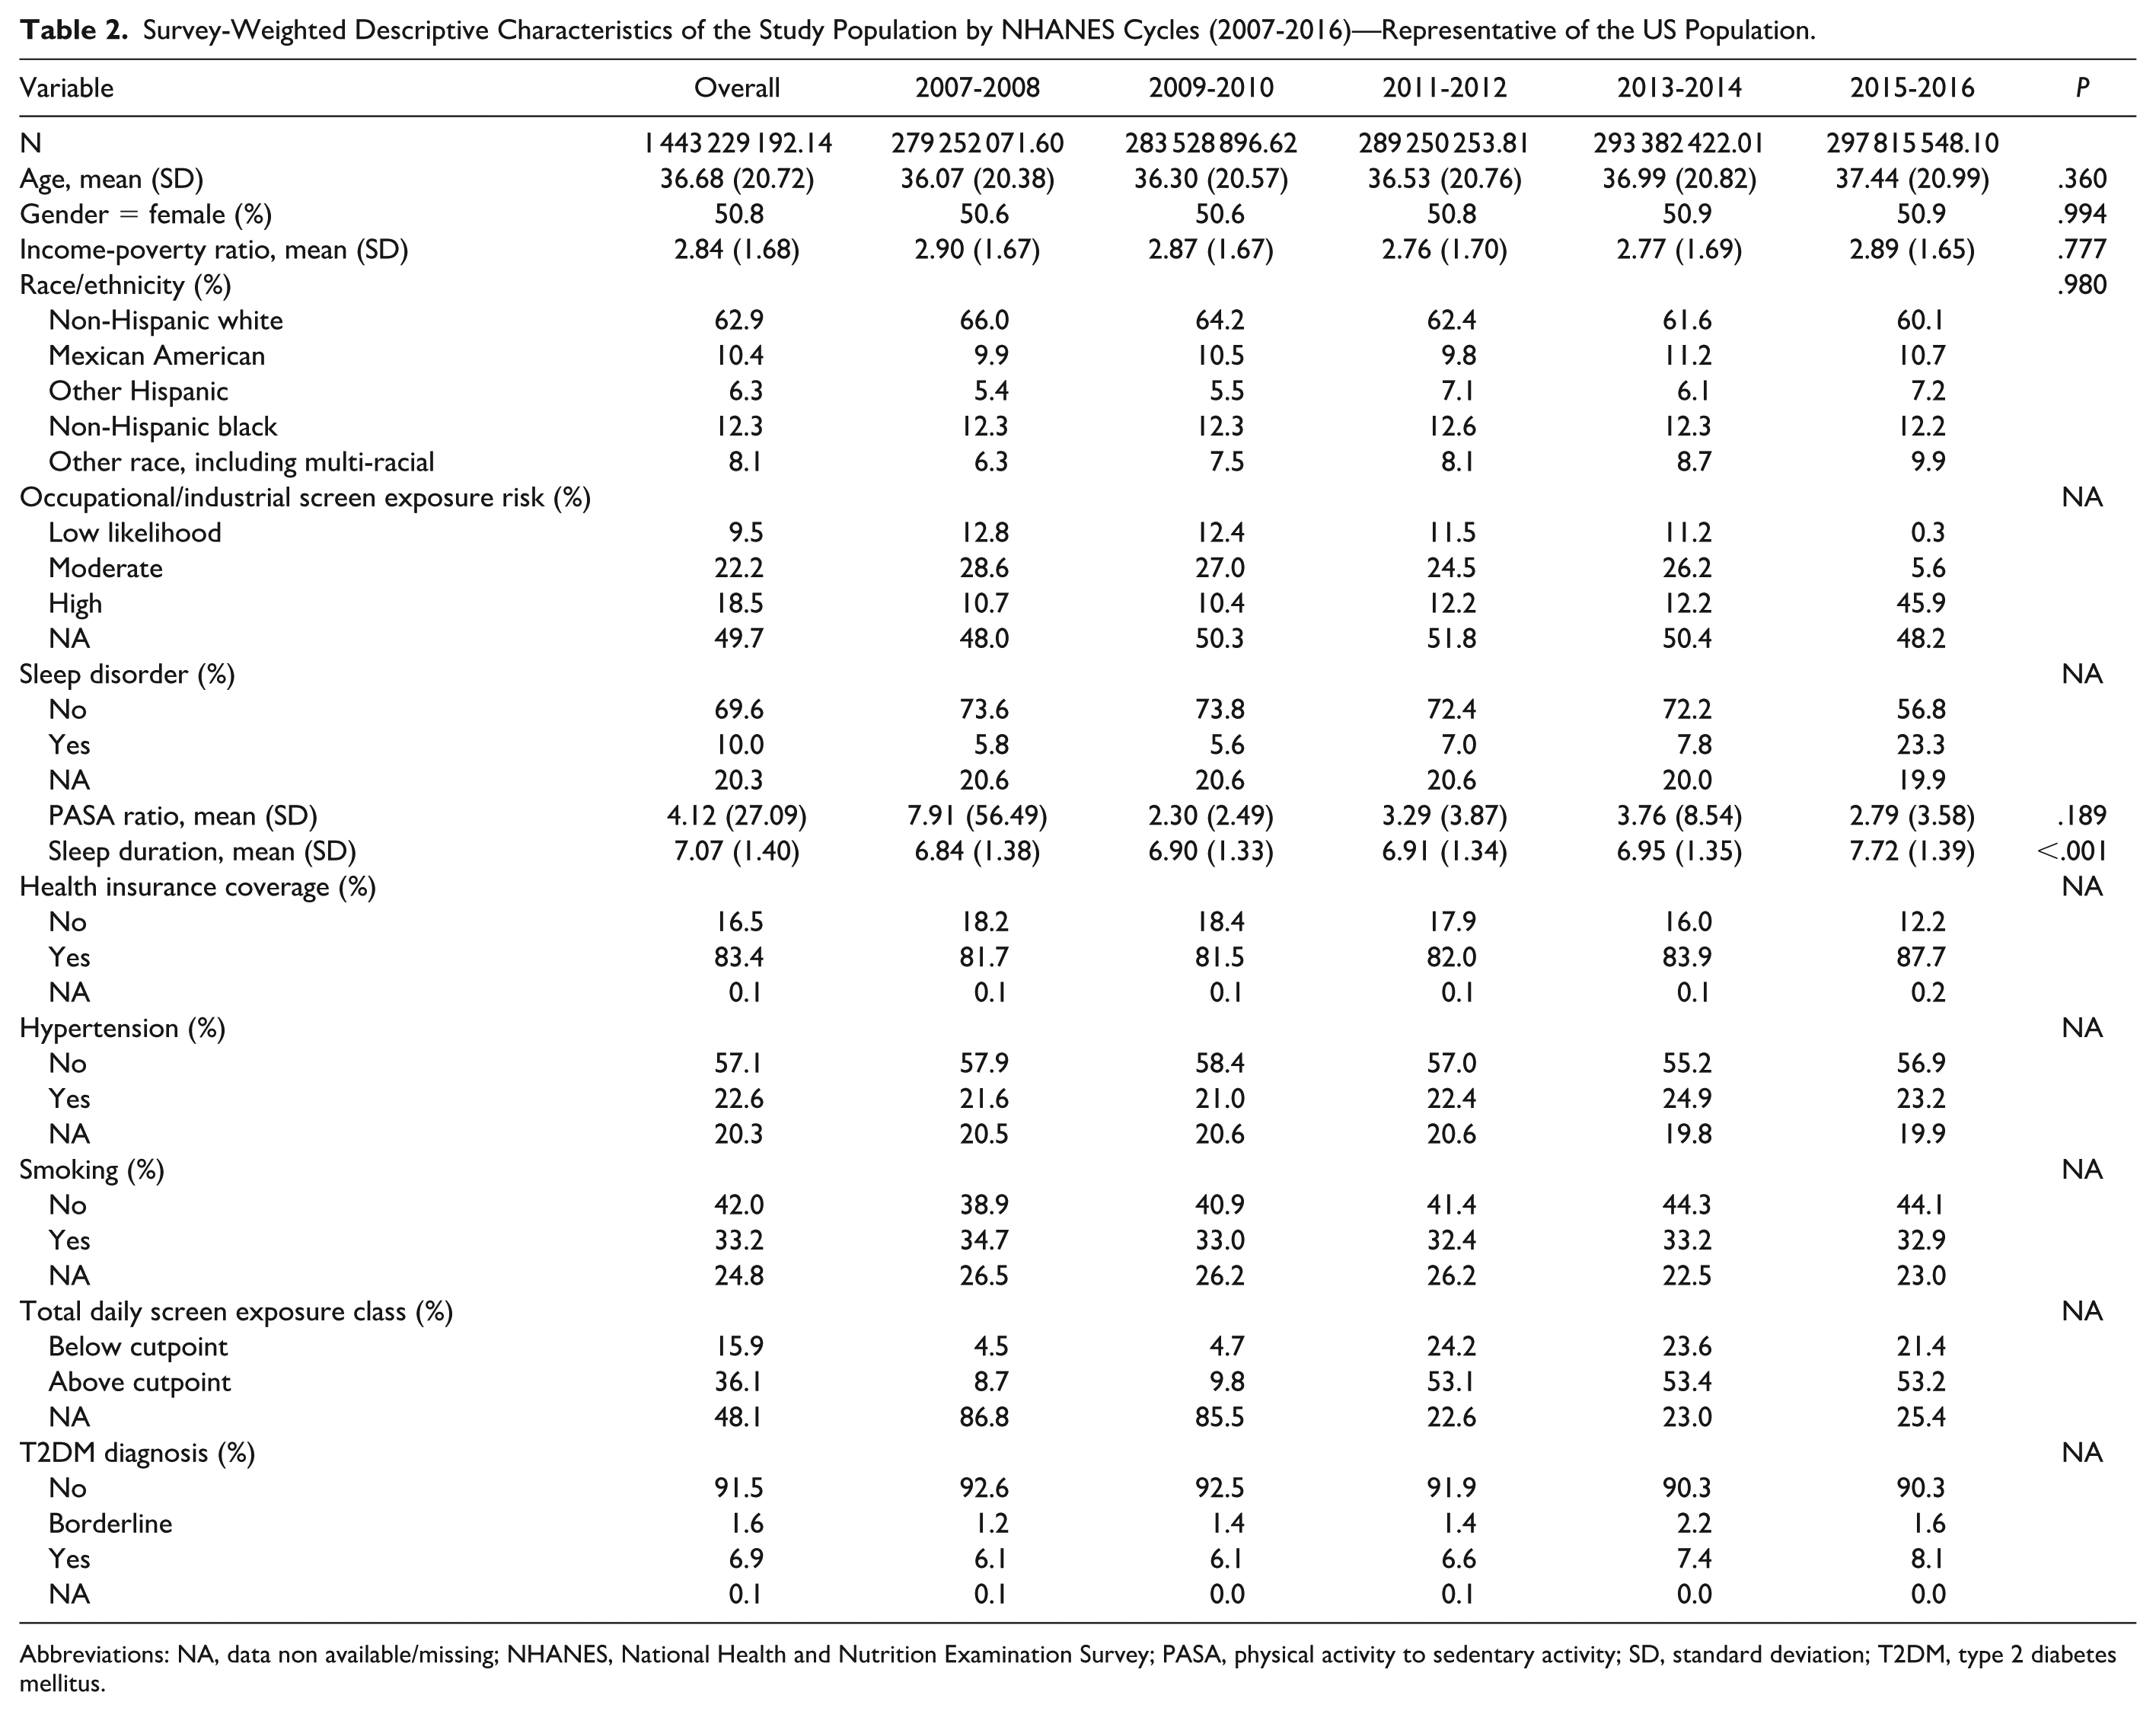
Abbreviations: NA, data non available/missing; NHANES, National Health and Nutrition Examination Survey; PASA, physical activity to sedentary activity; SD, standard deviation; T2DM, type 2 diabetes mellitus.
Adjusted Associations Between Screen Time and T2DM (Primary Analysis)
All multivariable models followed a prespecified structure developed a priori. The adjusted model included survey cycle, age (continuous), sex, race/ethnicity, income-to-poverty ratio, sleep duration, and sleep disorder status. Survey design elements (MEC weights, masked variance pseudo-PSU, and pseudo-stratum) were incorporated through the NHANES complex sampling design (Figure 2). No variable-selection procedures were applied. Screen time was entered as the primary exposure using the age-specific cutoff (two hours/day for participants <18 years and three hours/day for adults) and was not imputed (Figure 2).
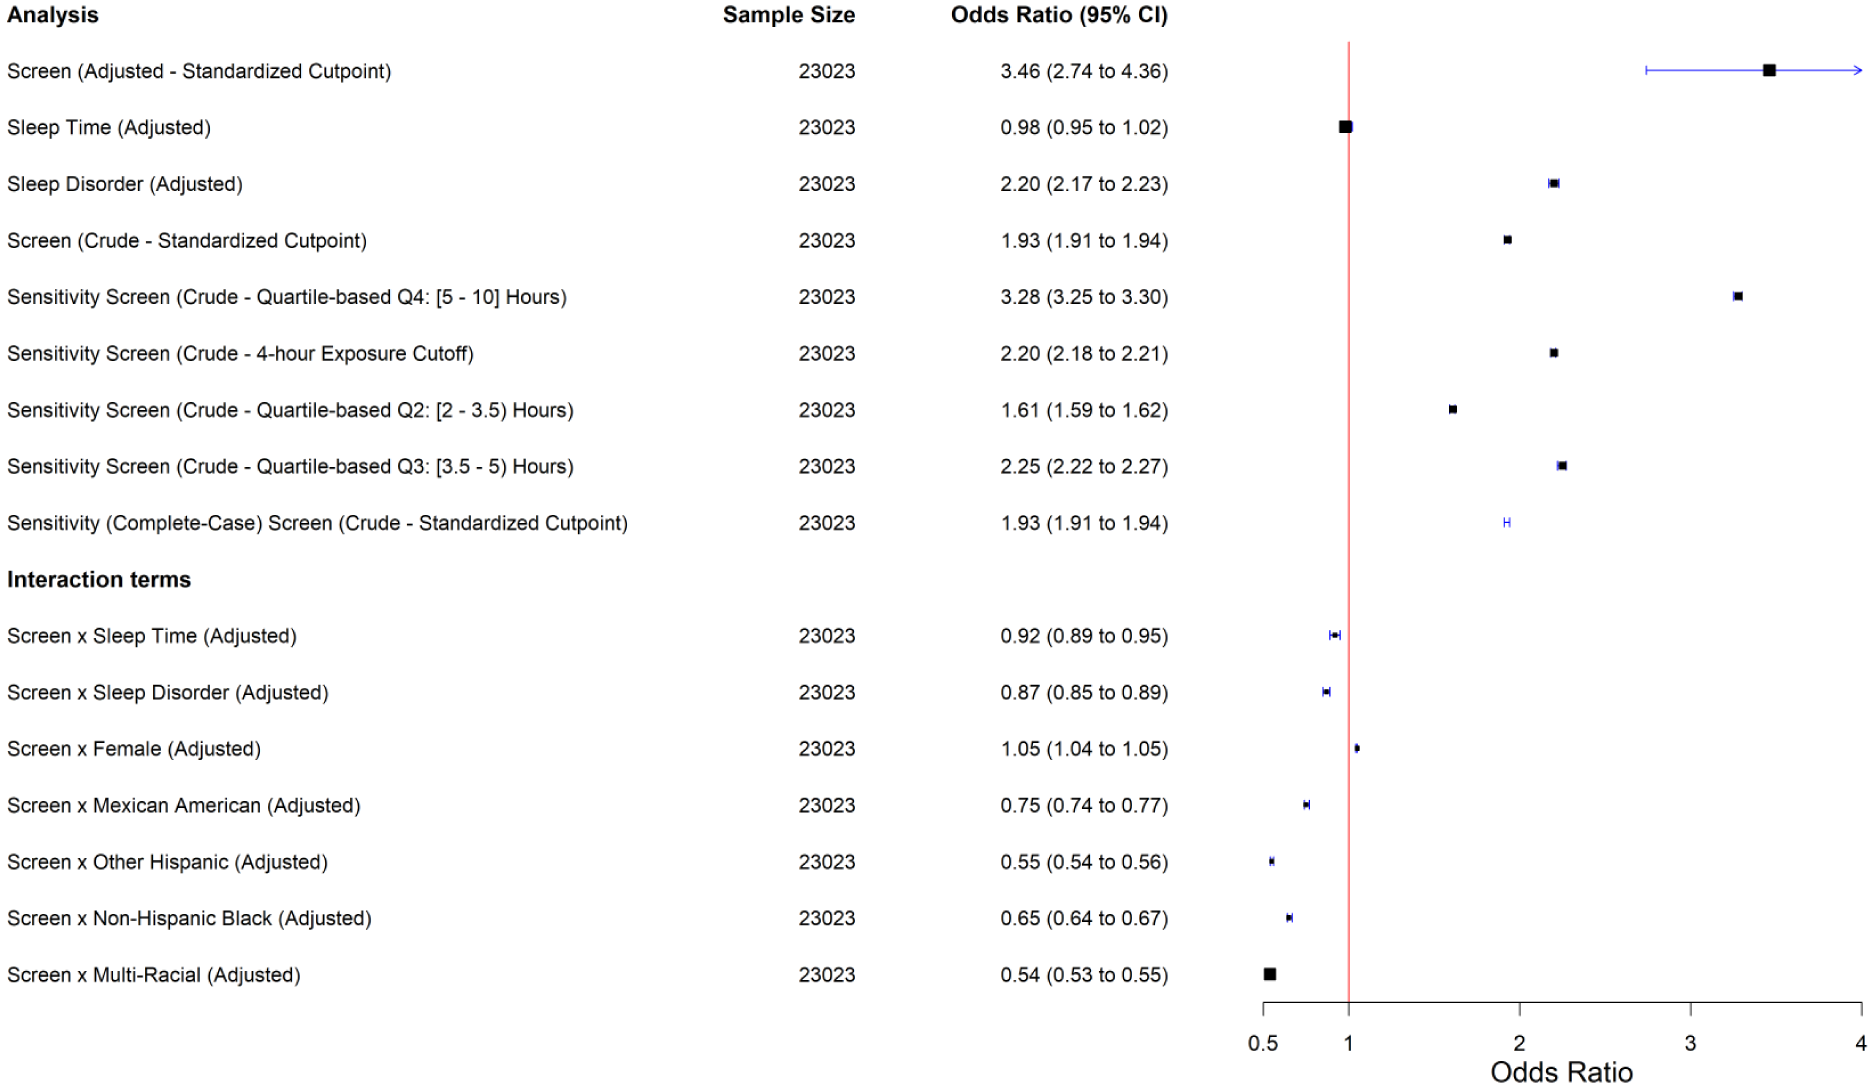
Forest plot of primary and sensitivity analysis of odds ratio for T2DM diagnosis by screen exposure.
Sleep disorders and duration were assessed for independence to exclude multicollinearity through survey-weighted non-parametric Wilcoxon rank-sum test (difference = −0.006, test-statistic = −0.71, df = 78, P = .4807) and there is no statistically significant evidence to reject the null hypothesis, in which true population-level difference in the mean rank score is equal to 0. In other words, sleep disorders and duration are independent and not related. We have adjusted for both in our final adjusted model.
Adjusted analyses showed that higher screen exposure was significantly associated with increased odds of T2DM (odds ratio [OR] = 3.46; 95% confidence interval [CI]: 2.74, 4.36). Sleep duration alone was not associated with risk (OR = 0.98), but diagnosed sleep disorders more than doubled the odds (OR = 2.20).
Effect measure modification analyses suggested that longer sleep duration attenuates the screen-T2DM association (interaction OR = 0.92). Heterogeneous (stronger) risk was observed among females (interaction OR = 1.05), indicating higher susceptibility than males.
Race/ethnicity also modified the association: attenuated odds were observed among Mexican American, other Hispanic, non-Hispanic black, and multi-racial participants (ORs = 0.54-0.75), suggesting subgroup-specific variation.
Attempts to stratify by occupational exposure risk were limited by small subgroup sample sizes and complex survey design constraints. These limitations did not affect the direction or robustness of the primary findings.
Sensitivity analyses confirmed the robustness of the primary exposure definition. Using an alternative four-hour daily screen-time cutoff, the association remained materially unchanged (OR = 2.20; 95% CI: 2.18, 2.21), closely aligning with the effect estimated using our primary adult-specific three-hour threshold (OR = 1.93; 95% CI: 1.91, 1.94).
When screen time was modeled as quartiles, the risk pattern followed a consistent dose-response gradient. Compared with the lowest exposure group (Q1), both moderate- and high-screen-time categories showed progressively elevated odds of T2DM (Q2 OR = 1.61; 95% CI: 1.59, 1.62; Q3 OR = 2.25; 95% CI: 2.22, 2.27; Q4 OR = 3.28; 95% CI: 3.25, 3.30). These quartile-based estimates closely mirrored the primary binary exposure model, especially for the moderate-exposure group (Q2), which was nearly identical to the standardized three-hour adult cutoff model.
Taken together, all sensitivity analyses—alternative exposure thresholds and quartile-based classifications—yielded results consistent in direction, magnitude, and dose-response pattern, reinforcing the stability of the primary findings from using primary age-specific cutoffs (two hours for youth and three hours for adults).
Crude and Complete Case Analyses
Crude analyses (unadjusted for the confounders and effect modifying terms) reported consistent higher OR between categories of daily total screen time and T2DM diagnosis status (OR = 1.93, 95% CI: 1.91, 1.94), regardless of MICE or complete-case analyses (Figure 2). Albeit missing data in confounders rendering incomplete sample size for a further adjustment of confounders, the existing models complement the limitations and do not diminish the overall robustness of the findings.
Subgroup analyses
Sex- and ethnicity-stratified analyses revealed clear subgroup differences in the screen-T2DM association (Figure 3). Among males, higher screen exposure was associated with more than a threefold increase in T2DM odds (OR = 3.12; 95% CI: 1.65, 5.91; Figure 3a). Sleep duration itself was not associated with T2DM (OR = 0.97; 95% CI: 0.89, 1.06), whereas diagnosed sleep disorders were positively associated with T2DM (OR = 1.73; 95% CI: 1.69, 1.77). Interaction models showed no evidence that sleep duration modified the screen-T2DM association (interaction OR = 0.93; 95% CI: 0.85, 1.02). In contrast, diagnosed sleep disorders strengthened this association (interaction OR = 1.67; 95% CI: 1.60, 1.74). Ethnicity-specific interaction estimates indicated attenuated associations among Mexican American (interaction OR = 0.40), other Hispanic (interaction OR = 0.74), non-Hispanic black (interaction OR = 0.66), and multi-racial men (interaction OR = 0.45).
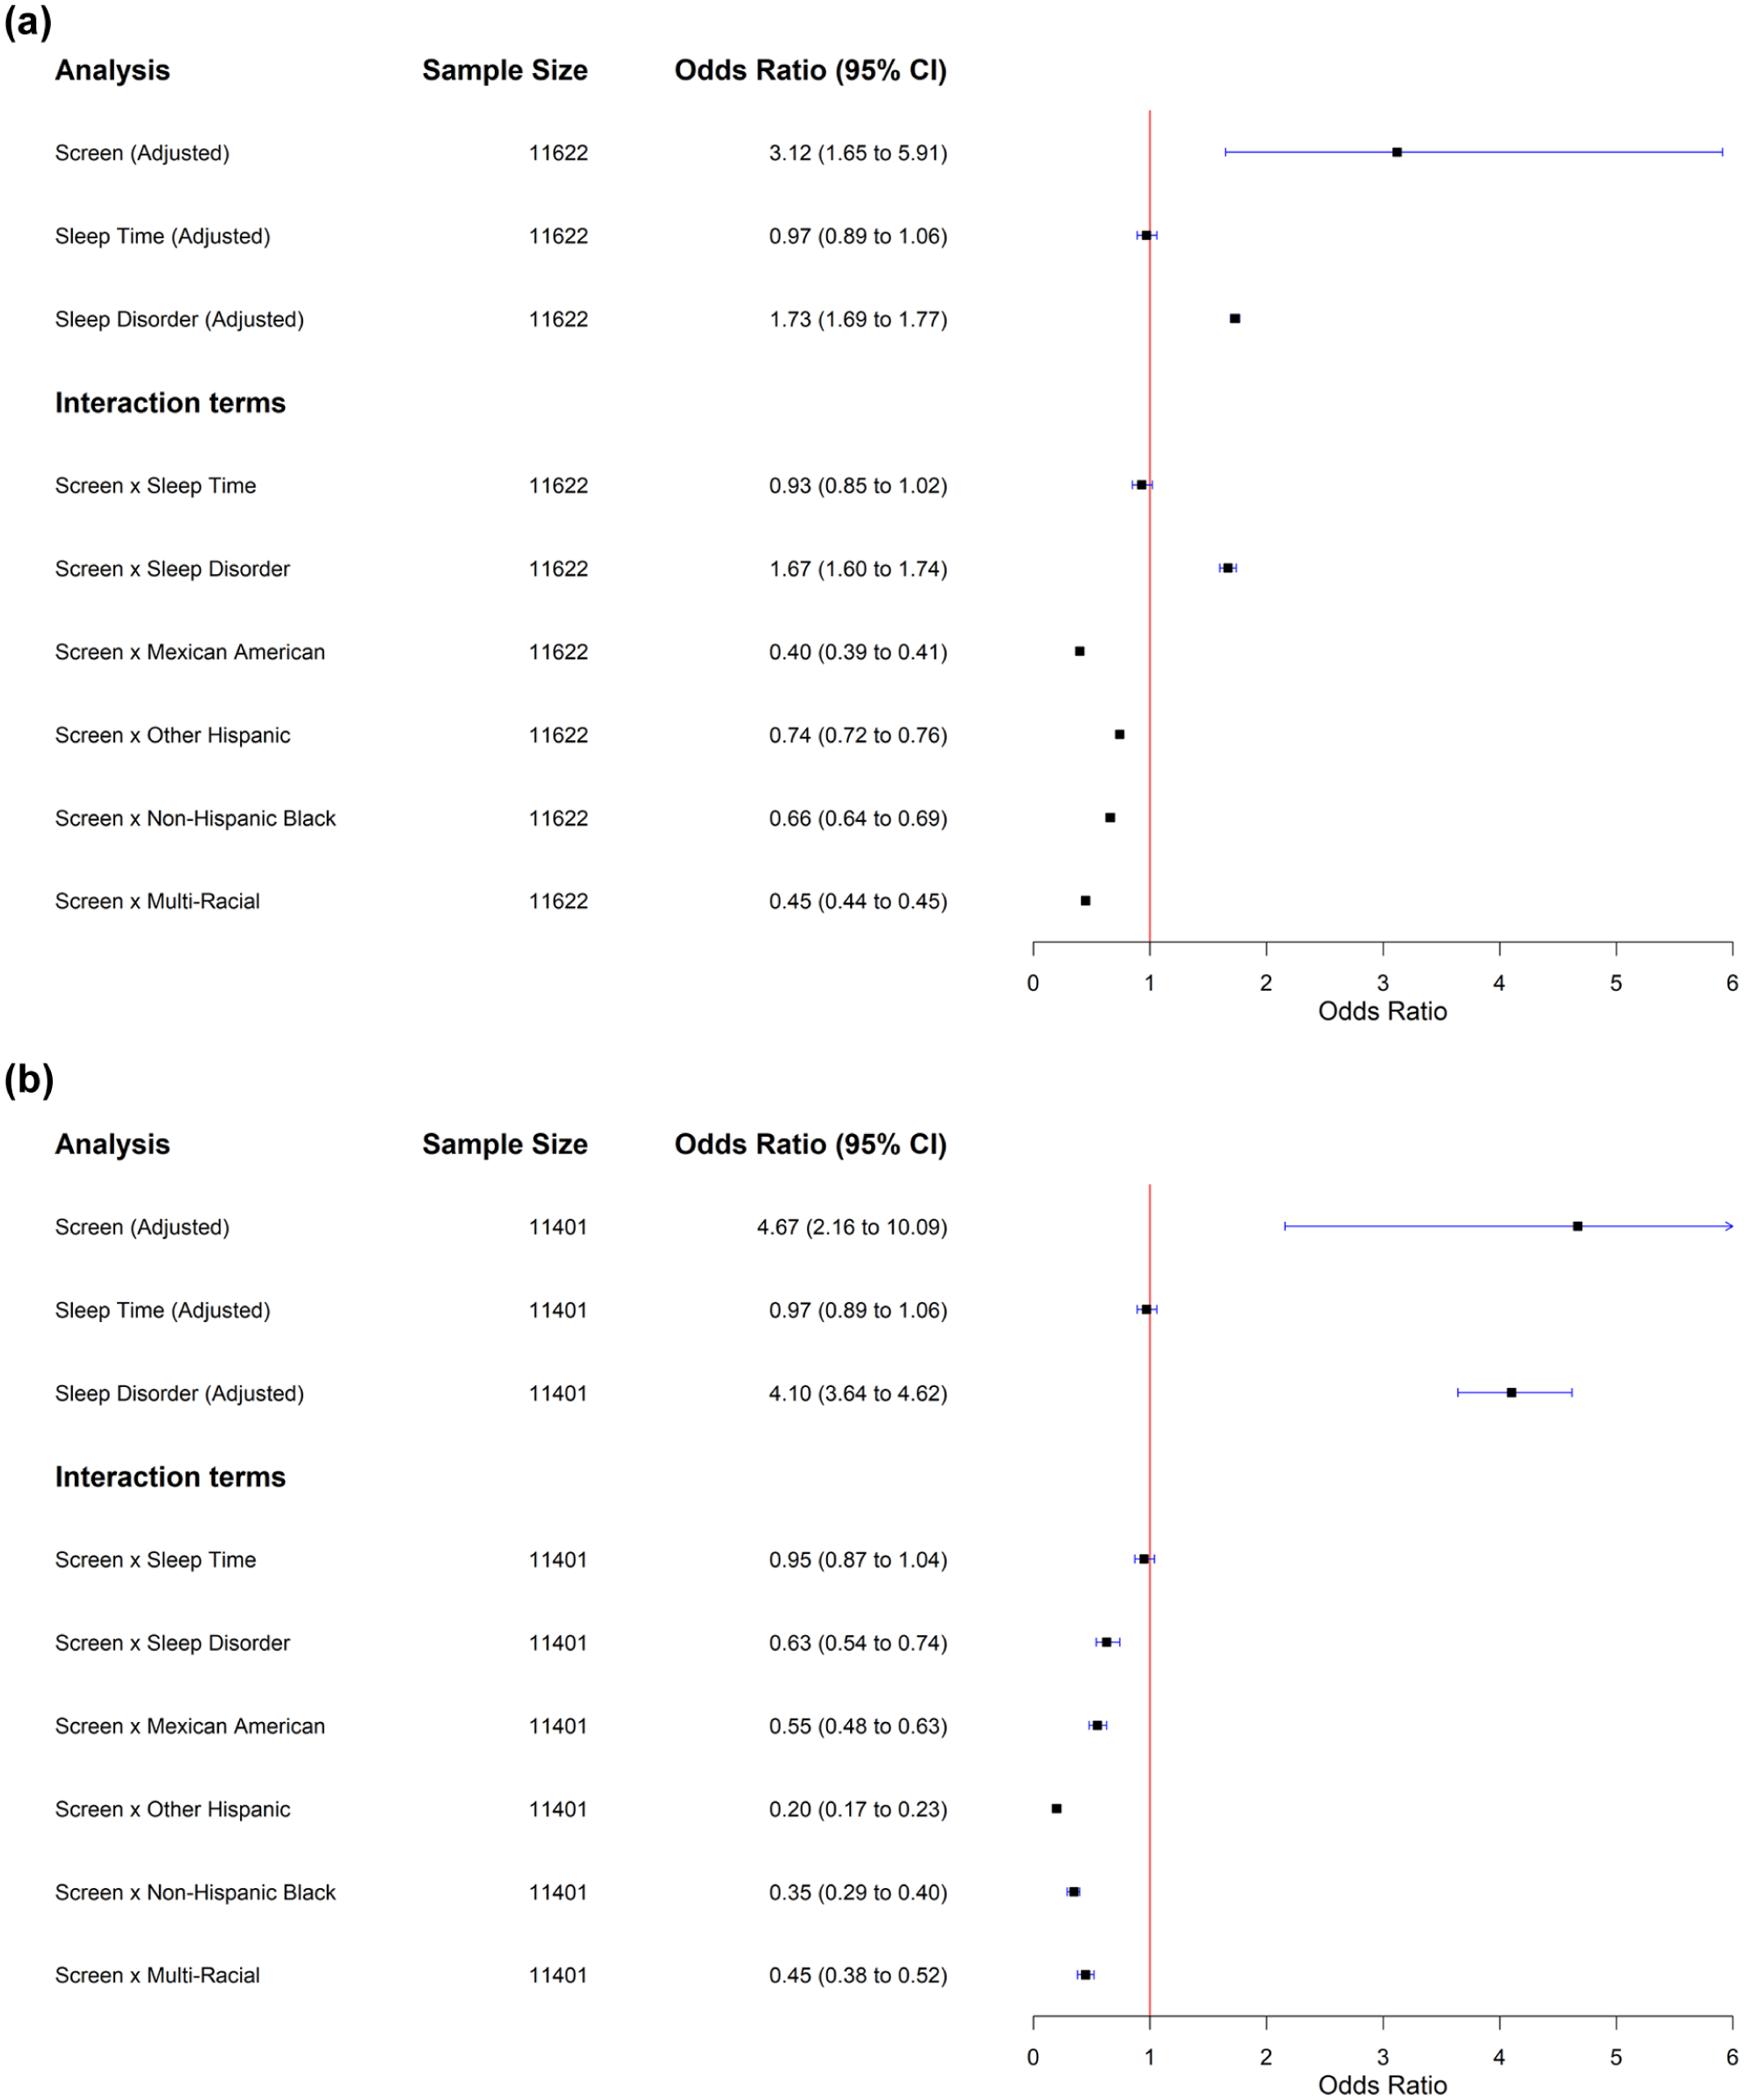
(a) Forest plot of sex-stratified subgroup (male) analysis of odds ratio for type 2 diabetes mellitus (T2DM) diagnosis by screen exposure. (b) Forest plot of sex-stratified subgroup (female) analysis of odds ratio for T2DM diagnosis by screen exposure.
Among females, the association between screen exposure and T2DM was stronger than in males (OR = 4.67; 95% CI: 2.16, 10.09; Figure 3b). Sleep duration showed no association (OR = 0.97; 95% CI: 0.89, 1.06), whereas diagnosed sleep disorders were strongly associated with T2DM (OR = 4.10; 95% CI: 3.64, 4.62). Interaction models again indicated no meaningful modification by sleep duration (interaction OR = 0.95; 95% CI: 0.87, 1.04). However, diagnosed sleep disorders attenuated the screen-T2DM association in women (interaction OR = 0.63; 95% CI: 0.54, 0.74). Ethnicity-stratified interaction estimates showed reduced associations among Mexican American (interaction OR = 0.55), other Hispanic (interaction OR = 0.20), non-Hispanic black (interaction OR = 0.35), and multi-racial women (interaction OR = 0.45).
Together, these findings indicate that sex and race/ethnicity systematically modify the magnitude of the screen-T2DM association, underscoring the need for tailored prevention strategies in high-risk populations. Specifically, effects were strongest among females overall, while several ethnic subgroups—particularly Mexican American, other Hispanic, non-Hispanic black, and multi-racial participants—exhibited attenuated associations in both sexes.
Discussion
While a growing body of research has explored the link between screen time and T2DM, findings have been inconsistent. Some studies report a positive association,6,14 -17 whereas others find no significant relationship.5,18 These discrepancies likely reflect differences in study design, exposure measurement, and statistical modeling, underscoring the need for further investigation. Of particular interest is the role of sleep disorders as potential mediators or modifiers in the screen exposure-T2DM pathway—a topic that remains underexplored.
This study addressed these questions using data from NHANES. 19 In this study, higher screen time was strongly associated with increased odds of T2DM among female participants (OR = 4.67; 95% CI: 2.16, 10.19), while the association was positive but markedly weaker in males (OR = 3.12; 95% CI: 1.65, 5.91). These findings are broadly consistent or in line with previous observational studies linking screen-based sedentary behaviors (eg, television viewing) with metabolic dysfunction (T2DM risk), which reported a positive link.20,21 However, prior studies have reported mixed patterns with respect to sex differences. For example, an Australian adolescent study found that boys who watched more than two hours of screens on weekdays had elevated insulin levels and increased insulin resistance, whereas no such association was observed in girls. 20 Another influential study noted that each additional hour of daily TV viewing has been associated with 139% increase in T2DM risk. 22 Mobile phone use has also been associated with T2DM, albeit with a weaker effect than television. On a separate note, our findings may reflect or illustrate Simpson’s paradox, where pooled estimates obscure or mask out meaningful subgroup effects: substantially larger effect observed in female participants compared with males.
In our study, sleep duration showed no significant association with T2DM risk in either overall model or sex-specific stratified models (Figures 3a and 3b). This suggests that sleep duration alone does not meaningfully contribute to diabetes risk once other behavioral and metabolic factors are accounted for. 23 Epidemiological data show that males are more likely to develop T2DM than females globally, especially after age 40 (mid-adulthood milestone). 24 Fatigue compensation or sleep extension in men with obesity or metabolic dysfunction may offer one possible explanation for the longer sleep durations observed in certain high-risk groups, 23 although this pattern did not translate into elevated T2DM risk in our sex-stratified models.
Notably, most prior studies relied on self-reported sleep duration, which often overestimates true sleep time. Objective methods, such as actigraphy or wearable sensors, provide more precise estimates by distinguishing time asleep from time in bed. However, the implementation of such tools in large-scale population studies remains limited due to logistical and financial constraints.
We also observed that participants with diagnosed sleep disorders had more than twice the odds of having T2DM compared with those without (OR = 2.20; 95% CI: 2.17, 2.23). Sleep disorders, including obstructive sleep apnea syndrome (OSAS), insomnia, restless legs syndrome, and circadian rhythm disturbances, have been increasingly implicated in the pathogenesis of T2DM. Among these, OSAS is the most extensively studied, with a well-documented association with insulin resistance and glucose dysregulation. A dose-response relationship has been observed between OSAS severity and glycemic impairment, particularly in relation to nocturnal oxygen desaturation and elevated fasting and two-hour oral glucose tolerance test glucose levels, 25 a hallmark of T2DM.
When stratified by sex, sleep disorder modifications showed opposite patterns: sleep disorders amplified the screen-T2DM association in males (interaction OR = 1.67) but attenuated it in females (interaction OR = 0.63). In the pooled model, these opposing effects converged toward the null (interaction OR = 0.87), creating the appearance of little or no interaction. This pattern is consistent with Simpson’s paradox, in which aggregating across heterogeneous subgroups obscures meaningful and directionally divergent effect patterns. Taken together, these may, in part, be explained by that females might be prone to missing reporting in sleep disorders and/or underreport (misclassification) given social desirability bias compared with male counterparts. Female subgroups may also be particularly physiologically susceptible or prone to lower sleep durations or experience sleep disturbances at nighttime, resulting in more than twofold increase in T2DM associated with sleep disorder independently but attenuated interaction risk than males.
Race and ethnicity also modified the associations observed in this study, albeit in a pattern opposite to that observed in some prior studies. For both males and females, the association was attenuated among Mexican American, other Hispanic, non-Hispanic black, and multi-racial participants (interaction ORs all < 1), indicating weaker screen-related risk compared with non-Hispanic white adults. These attenuated associations may reflect subgroup differences in baseline metabolic risk, screen-use patterns, sleep behavior, or unmeasured environmental and social determinants of health, such as dietary patterns. Structural factors—including neighborhood context, occupational demands, and differential access to health care—may also shape both sedentary behavior and diabetes risk in ways not fully captured in our models. These findings highlight the need to consider cultural, environmental, and socioeconomic contexts when interpreting subgroup differences and designing equitable intervention strategies. Therefore, culturally tailored interventions and equitable resource allocation are critical in addressing these disparities.
It should be noted, however, that the NHANES data set used in this study did not include detailed diagnostic information on types of sleep disorders among individuals under the age of 16. Although multiple imputation methods were applied to address missing data, the lack of specific diagnostic variables limited our ability to examine the associations between individual sleep disorders, such as OSAS or insomnia and T2DM risk. Nevertheless, the overall findings suggest that the presence of sleep disturbances is significantly associated with a higher prevalence of T2DM. In addition, the inability to include certain covariates—such as the PASA ratio and occupational/industrial exposure risk—due to high levels of missing data may have led to residual confounding. Although these variables were initially considered, their omissions limit the depth of EMM modeling and stratified sub-analyses.
Importantly, causal inference is further constrained by the cross-sectional nature of NHANES and the inability to link respondents across cycles via unique participant identifiers, precluding longitudinal follow-up. Reverse causality remains a concern; for instance, individuals with pre-existing or suspected metabolic conditions may have altered their screen use or sleep behaviors post-diagnosis. Finally, although complex survey weights were applied to enhance national representativeness, the study may have been underpowered to detect nuanced modifying effects or associations in subgroups with low prevalence, such as high-exposure occupational categories given high rates of missing data, likely reducing precision in the sub-analyses. However, despite limitations a notable strength of this study is the use of multiple imputation for incomplete covariates under a plausible MAR mechanism, while intentionally avoiding imputation of the primary exposure.
While these findings hold substantial public health significance for youth populations, the causal pathways linking screen time with metabolic risk factors remain to be clarified. It is plausible that prolonged screen exposure contributes to T2DM risk through multiple interacting behaviors, including poor diet quality, insufficient physical activity, and uninterrupted sedentary time. However, establishing causality requires rigorous longitudinal evidence. The cross-sectional design of NHANES limits the ability to infer causality, and prevalence odds ratios—while appropriate for survey-weighted analyses—may overestimate associations when outcomes are common, as is the case with T2DM.
It is important to emphasize that screen exposure is likely not an isolated risk factor. Rather, it reflects a constellation of behaviors—including prolonged sitting, poor dietary habits (eg, frequent consumption of energy-dense snacks), lower physical activity levels, sleep disruption, and circadian misalignment—that collectively increase metabolic risk. As such, holistic strategies aimed at reducing screen time, encouraging movement, improving sleep hygiene, and supporting healthier diets are essential for effective T2DM prevention.
In conclusion, growing body of evidence links excessive screen time—particularly with smartphones and other modern digital devices—to elevated T2DM risk. Multifaceted interventions that target digital habits, sleep, and lifestyle behaviors may yield the greatest benefit in mitigating this public health burden.
To overcome these limitations, future studies should consider leveraging longitudinally linked NHANES cohorts, incorporating objective measures of exposure and health outcomes, and applying advanced analytical methods for exploring or assessing both cumulative and modifying effects of screen exposures on T2DM clinical development. Such approaches will better accommodate the complexities of the data while enabling more robust causal inference across diverse population subgroups. Currently causal inference is limited by survey respondent UID (participant/respondent sequence number) different across survey cycles.
Conclusion
This study highlights the complex interplay between screen exposure, multidimensional sleep indicators, and T2DM risk in a nationally representative population. Our findings demonstrate that excessive screen time is significantly associated with increased odds of T2DM, particularly among females and individuals with diagnosed sleep disorders. Furthermore, sleep-related factors were shown to modify the strength of these associations, underscoring the importance of considering behavioral and biological contexts in diabetes prevention strategies. Given the cross-sectional nature of the data, causal inferences should be drawn cautiously. Future longitudinal studies incorporating objective sleep and screen exposure metrics are warranted to further elucidate mechanisms and inform tailored interventions.
Supplemental Material
sj-docx-1-dst-10.1177_19322968261426022 – Supplemental material for Associations Between Screen Exposure, Multidimensional Sleep Indicators, and Type 2 Diabetes: A Cross-sectional Study Using US National Survey Data
Supplemental material, sj-docx-1-dst-10.1177_19322968261426022 for Associations Between Screen Exposure, Multidimensional Sleep Indicators, and Type 2 Diabetes: A Cross-sectional Study Using US National Survey Data by Feng Zhai and Yanbo Li in Journal of Diabetes Science and Technology
Footnotes
Abbreviations
EMM, effect measure modification; MAR, missing at random; MEC, mobile examination center; MICE, multiple imputation by chained equation; NCHS, National Center for Health Statistics; NHANES, National Health and Nutrition Examination Survey; PASA, physical activity to sedentary activity; T2DM, type 2 diabetes mellitus; UID, survey respondent number.
Declaration of Conflicting Interests
The authors declared no potential conflicts of interest with respect to the research, authorship, and/or publication of this article.
Funding
The authors disclosed receipt of the following financial support for the research, authorship, and/or publication of this article: 2025 Guizhou Provincial Technology Achievement Transformation and Industrialization Plan Project (Clinical Special Project) (No. Guizhou Science and Technology Achievement LC [2025] General 151).
Supplemental Material
Supplemental material for this article is available online.