
Abstract
Background:
There is room for improvement in the outcome of automated insulin delivery. Our aim was to explore the impact on glucose metrics of algorithmic modifications of a DBLG1 hybrid closed-loop system, targeting the management of meal periods, hypoglycemia and hyperglycemia.
Methods:
We performed a two-step analysis of CGM data of all consenting adult patients with type 1 diabetes who were equipped in Europe with DBLG1 between November 1, 2023 and January 31, 2025, comparing three successive versions of the algorithm: v1.12 vs. v1.16 (first step, retrospective comparison), then v1.16 vs. v1.17 (second step, ambispective before/after analysis). Time in range of 70 to 180 mg/dL was the primary endpoint.
Results:
The first step (duration 319 days, 937 patients) compared 269 users of 1.12 version and 668 users of 1.16 version. Median TIR improved from 65.3% [IQR 58.4%-72.1%] to 71.3 [63.3%-78.0%]. Time in Tight Range 70 to 140 mg/dL increased from 37.5% [30.6%-43.1%] to 40.4% [31.7%-48.5%]. Time in Hypoglycemia was stable. Time >250 mg/dL decreased from 8.9% to 5.4%, GMI from 7.3% to 7.1%, CV from 30.4% to 27.4%, and GRI from 38.0 to 30.0. The second step (1212 patients, 120 days) showed a further improvement of TIR from 68.8% [59.6%-76.8%] to 70.8% [63.0%-77.6%] when upgrading from v1.16 to v1.17, with marginal changes in other glucose metrics. The incidence rates of severe hypoglycemia or hyperglycemia remained very low.
Conclusion:
This large post-market report illustrates the margin of improvement in AID performances through algorithmic refinements that improve the efficacy without deteriorating the safety of closed-loop insulin delivery.
Automated insulin delivery (AID) has become the standard of care for patients living with type 1 diabetes during the last decade, 1 as the efficacy and safety of these closed-loop insulin therapy systems have been demonstrated by controlled trials as well as large post-market studies.2-6 There is room for improvements in these systems, and some companies have explored and reported the impact of algorithmic modifications on glucose metrics.7,8 The Diabeloop DBLG1 AID system was made commercially available in March 2021 in seven European countries (Belgium, France, Germany, Italy, Netherlands, Spain, Switzerland), as a hybrid, closed-loop insulin delivery system combining a Dexcom G6® continuous glucose monitoring (CGM) device, an insulin pump and the DBLG1 software into a dedicated controller handset, with data being accessible in real-time and stored on the YourLoops web platform [details in Benhamou et al 9 ]. Its performances were reported in randomized controlled studies in adults and children, type 1 and type 2 patients9-11 and multi-country post-market observations.12,13 New versions of the DBLG1 algorithm were recently approved and launched, featuring improvements in the management of meal periods, hypoglycemia and hyperglycemia, among other refinements of the controller. The aim of the current observational report, as part of post-market surveillance activities, was to confirm the safety and performance of the DBLG1 system with these algorithmic variants among adult users living with T1D.
Methods
Insulin Delivery DBLG1 System
DBLG1 is an interoperable AID system intended to be used in adult patients with T1D and available for several insulin pumps, 13 but this study focused on the sole versions using the Kaleido® pump (Vicentra). In 2024, two versions of DBLG1 were available with this pump: (1) the DBLG1A version, using the Mobigo+® handset (Mobiwire) hosting the 1.12 version of the software, was distributed in France; (2) the DBLG1Z version, using the DH22® handset (Mobiwire) hosting the 1.16 version of the software, was distributed in Germany and the Netherlands. In December 2024, another iteration of the DBLG1 software (DBLG1Z version 1.17) was made available for patients in Germany and the Netherlands, and software updates were delivered through Firmware Over-The-Air (FOTA).
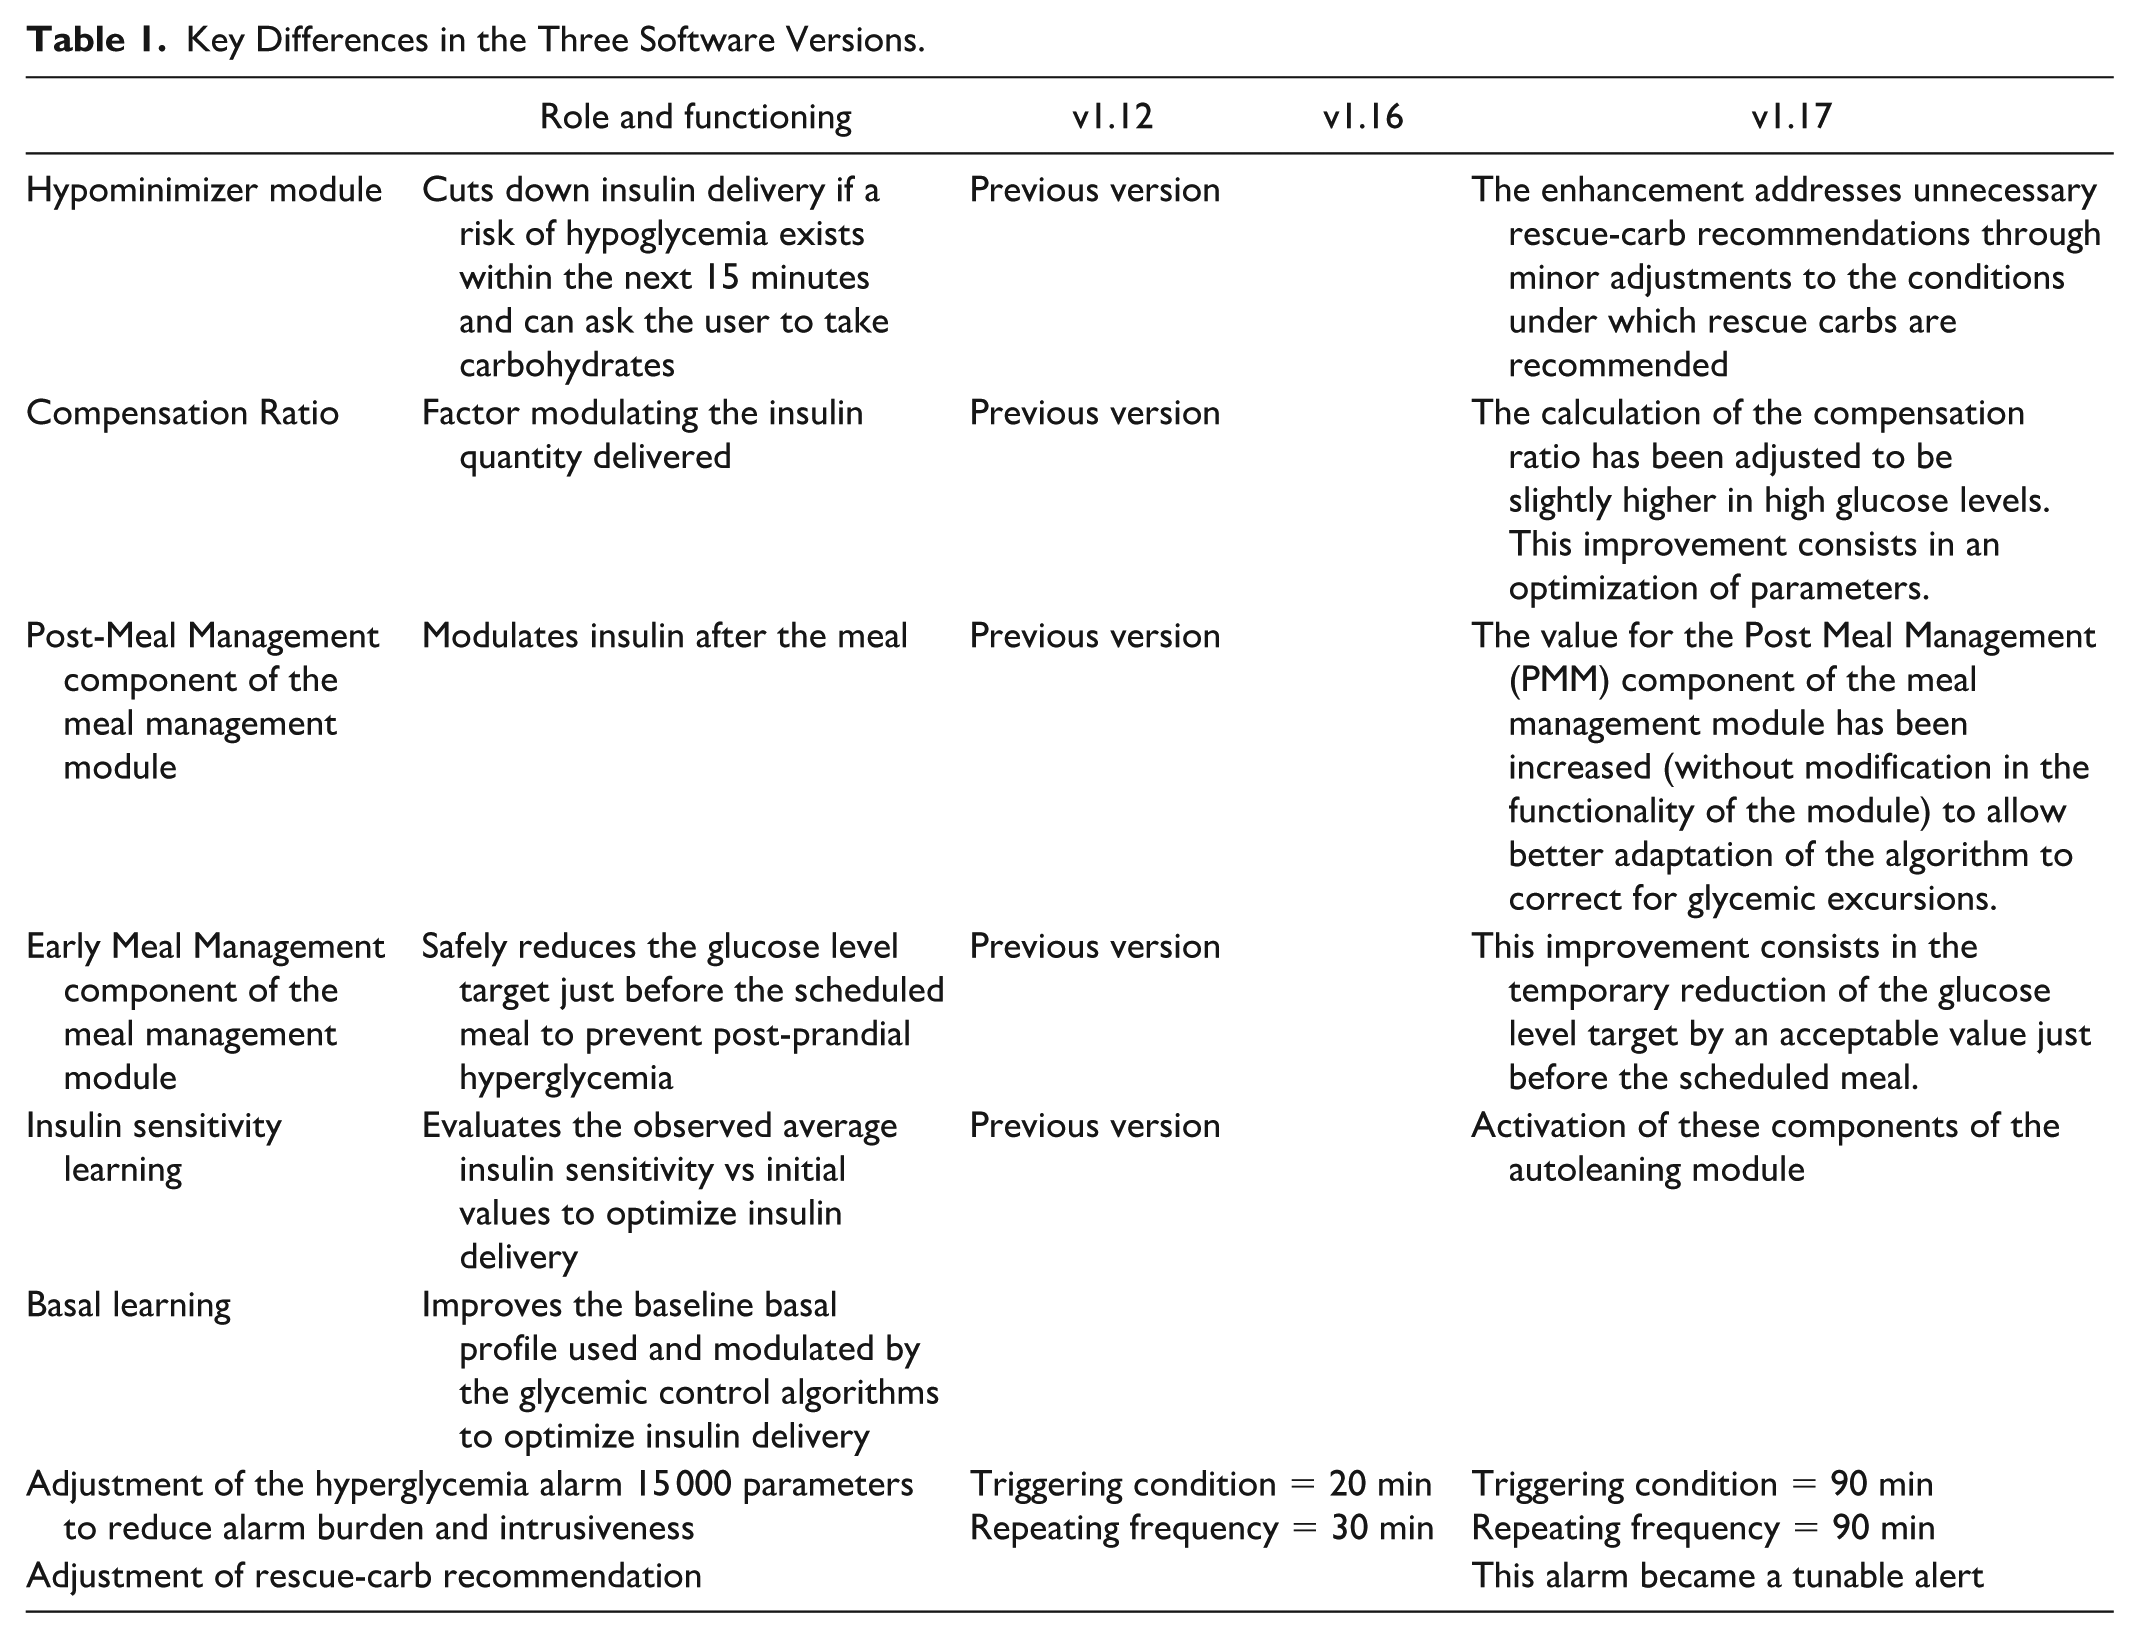
The main differences between version 1.12 and version 1.16 of the regulation algorithm are (1) the optimization of the module controlling for the management of post-meal period (Post-Meal-Management Module) and (2) the calculation of the compensation ratio, which modulates the quantity of insulin to be delivered in situations of hyperglycemia, which was adjusted at a higher level. The performance of these refinements was previously tested in simulations and clinical trials 13 and shown to reduce hyperglycemic risk without increasing postprandial hypoglycemic risk. The main modifications that were implemented between v1.16 and v1.17 were related to alarms and alerts triggering conditions and frequency. They also included adjustments for rescue-carbohydrate recommendations (Hypo-Minimizer module), thus indirectly impacting the management of hypoglycemia and hyperglycemia. Improvements in autolearning of insulin sensitivity factor, and improvements in management of meals (Early-Meal-Management component of the meal management module) were also implemented. These successive upgrades have only included refinements, not new functionalities. The key differences between the three versions of the software are summarized in Table 1.
Key Differences in the Three Software Versions.
Objectives
The primary objective of this study was to report the impact of the new algorithmic variants (v1.16 and v1.17) of DBLG1, as compared with the previous variant (v1.12), on glucose metrics measured by the continuous glucose monitoring component of the AID system, namely the Time in Range (TIR) 70 to 180 mg/dL, which was the primary endpoint. The secondary objectives were to obtain complementary information on safety, efficacy and use of the DBLG1 (v1.12, v1.16 and v1.17) variants in real-world conditions. The secondary endpoints were: Time in Tight Range (TITR 70-140 mg/dL), Time Below Range (TBR < 70 mg/dL, TBR < 54 mg/dL, and Time in Range 54-69 mg/dL), Time Above Range (TAR > 180 mg/dL and TAR > 250 mg/dL), average sensor glucose, Glucose Management Index (GMI), Glycemia Risk Index (GRI), coefficient of variability of glucose (CV), incidence of severe hypoglycemia and severe hyperglycemia, percentage of patients achieving all three international targets for TIR (>70%), TBR<70mg/dL <4%, TBR<54 mg/dL <1%).
Study Population
This observational report included two steps:
- The first step was retrospective and aimed at assessing the impact of the 1.16 version of the algorithm, as compared to the previous 1.12 version. For that purpose, we included (1) all users of v1.12 that met the inclusion criteria; these patients were all based in France; (2) all users of v1.16 that met the inclusion criteria; these patients were all based in Germany or Netherlands.
The inclusion period was defined in consideration of post-market surveillance requirements. Thus, for the first step, the inclusion period started at the commercial launch (November 1, 2023) and ended arbitrarily on September 3, 2024. All patients who were equipped during the inclusion period, either with v1.12 or with v1.16, and who gave their consent to use their data as part of the post-market activities, were included. Patients with less than 14 days of data in closed-loop (ie, days of closed-loop are those with 75% of time with loop mode activated) were excluded.
- The second step was ambispective and aimed at assessing the impact of the 1.17 version of the algorithm (study period), made available in December 2024, as compared to the 1.16 version (control period). For that purpose, we included all patients using the DBLG1 system that upgraded from the 1.16 to the 1.17 version before January 31, 2025 (before/after study design), with a database lock in March 2025, allowing for the collection of 60 days of data per period. These patients defined the Full Analysis Set (FAS). The Per Protocol Set excluded all FAS patients with less than 70% CGM data for either the control or study period (ie, 42 days per period) and FAS patients with less than 75% of their CGM data obtained in closed-loop mode during either the control or the study period.
Outcome Metrics and Statistical Analysis
The data were collected via the DBLG1 system and were extracted from YourLoops databases, as previously described. 8 No additional data were collected from any CRF. The CGM-related endpoints (TIR, TITR, TBR < 70 mg/dL, TBR < 54 mg/dL, Time in Range 54-69 mg/dL, TAR > 180 mg/dL, TAR > 250 mg/dL, GMI, GRI, CV, sensor glucose, achievement of international targets for TIR and TBR) were calculated per patient. Descriptive statistics are provided with mean, SD, median, and quartiles (quantitative variables). For the second step, a comparison between both periods was performed for the primary and all secondary endpoints using a paired test (t-test or Wilcoxon signed rank test according to the results of the Shapiro-Wilk test for normality) for quantitative endpoint. In order to account for any size effect in the comparison between groups, Cohen’s d test was used. All statistical analyses were performed by the sponsor using R version 4.3.3.
Ethics and Informed Consent
The study was conducted in accordance with the Helsinki Declaration and General Data Protection Regulation (GDPR) (EU) 2016/679. No Institutional Review Board (IRB) approval was sought for this post-market analysis. The study includes informed patients who do not object to the use of their medical data and respects the principle of confidentiality and patient privacy. Patients had consented to the use of their data for post-market surveillance purposes as part of their onboarding to DBLG1 when initiating their YourLoops account, and extracted data were de-identified.
Results
Population
First step: A total of 937 patients were included in this analysis, including 269 users of the v1.12 variant (all from France) and 668 users of the v1.16 variant (517 from Germany and 151 from Netherlands). The demographic characteristics of the population are shown in Table 2. The study duration (time between the date of first equipped patient and date of last patient CGM data available) was 319 days (100 148 patient-days). The median treatment duration (time between the date of DBLG1 initialization and date of last CGM data available) was 86 [51-148] days for all users (Table 2).
Second step: A total of 1212 patients were included in the Full Analysis Set, 81% of whom were from Germany and the rest from the Netherlands. This proportion was kept in the Per Protocol set which gathered 764 patients. The characteristics of FAS and PP sets are shown in Table 3. The median duration of control period (v1.16) and study period (v1.17) was 60 days each. Overall, for the FAS, 65 798 and 70 171 treatment-days were collected for v1.16 and v1.17, respectively.
Population Characteristics at DBLG1 Initiation (First Step).
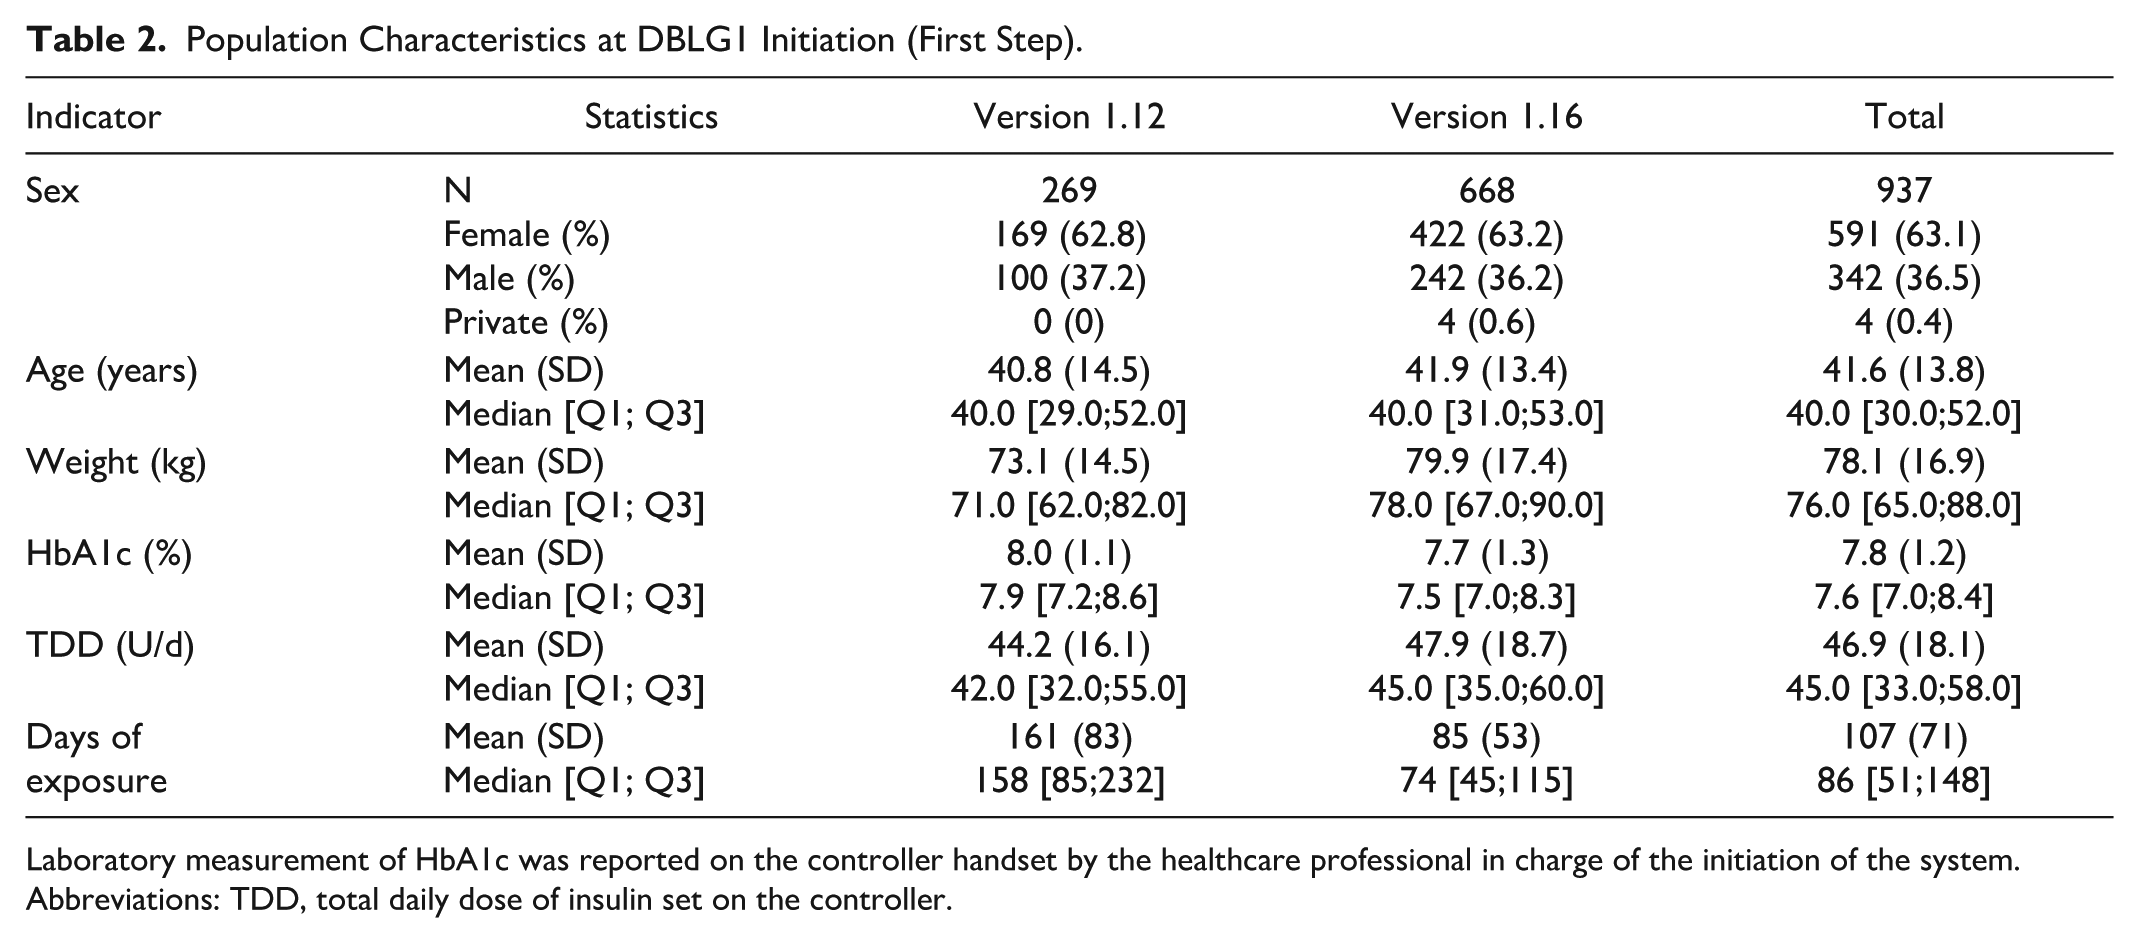
Laboratory measurement of HbA1c was reported on the controller handset by the healthcare professional in charge of the initiation of the system.
Abbreviations: TDD, total daily dose of insulin set on the controller.
Population Characteristics at DBLG1 Initiation (Second Step).
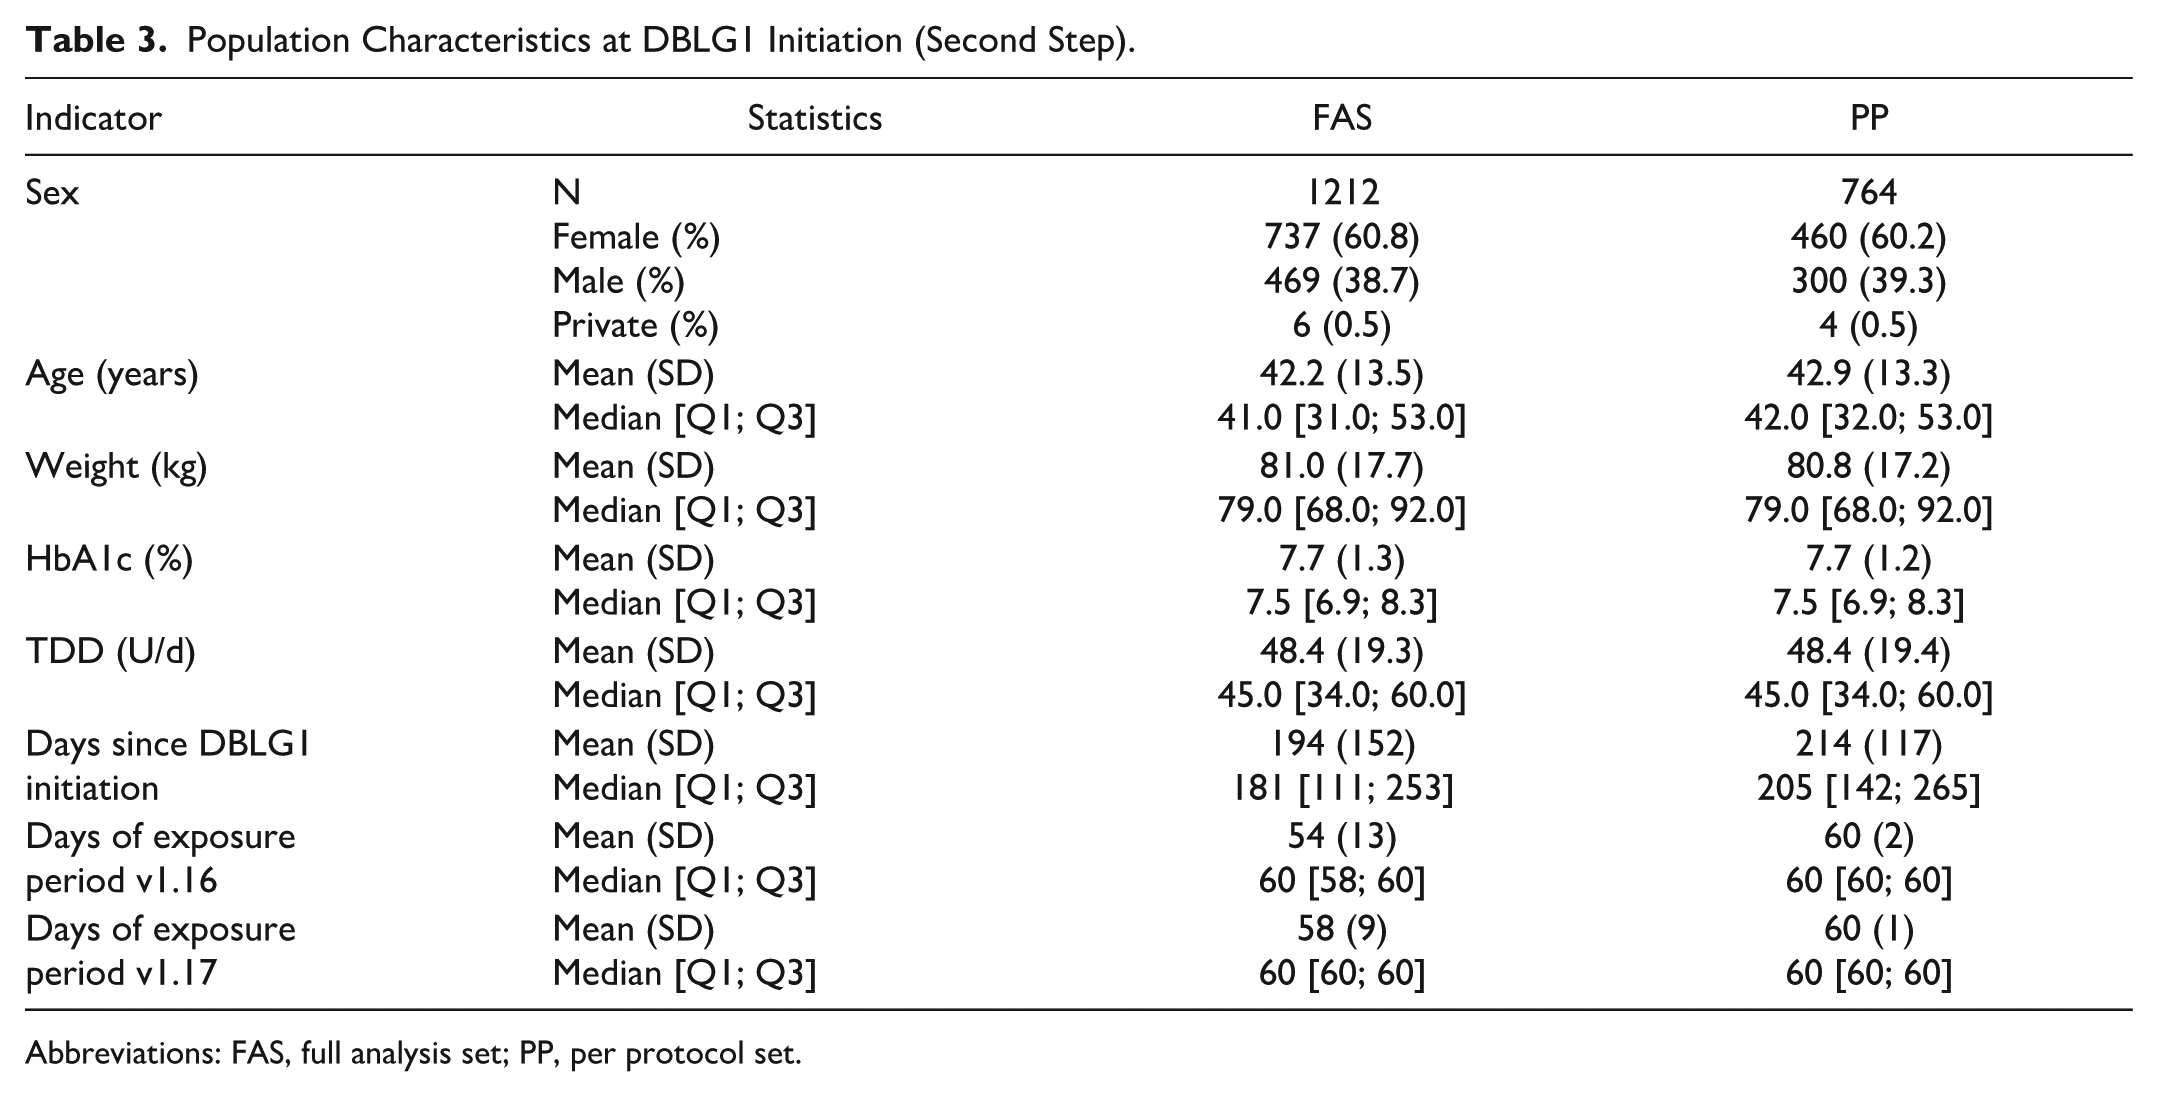
Abbreviations: FAS, full analysis set; PP, per protocol set.
Primary Outcome
The first step of the report shows that the 269 users of v1.12 exhibited a median TIR 70-180 mg/dL of 65.3%, as compared with 71.3% for the 668 users of the v1.16 variant (Table 4). In the second step of the report, we looked at the 764 users of v1.16 who upgraded to v1.17 and we observed that the median TIR 70 to 180 mg/dL increased from 69.5% to 71.2%, that is, a difference of 1.6% [−1.4% to 5.5%] (P < .0001, Cohen’s d 0.15 meaning a small effect) (Table 5).
Main Glucose Metrics During Follow-Up, Comparing v1.12 and v1.16.
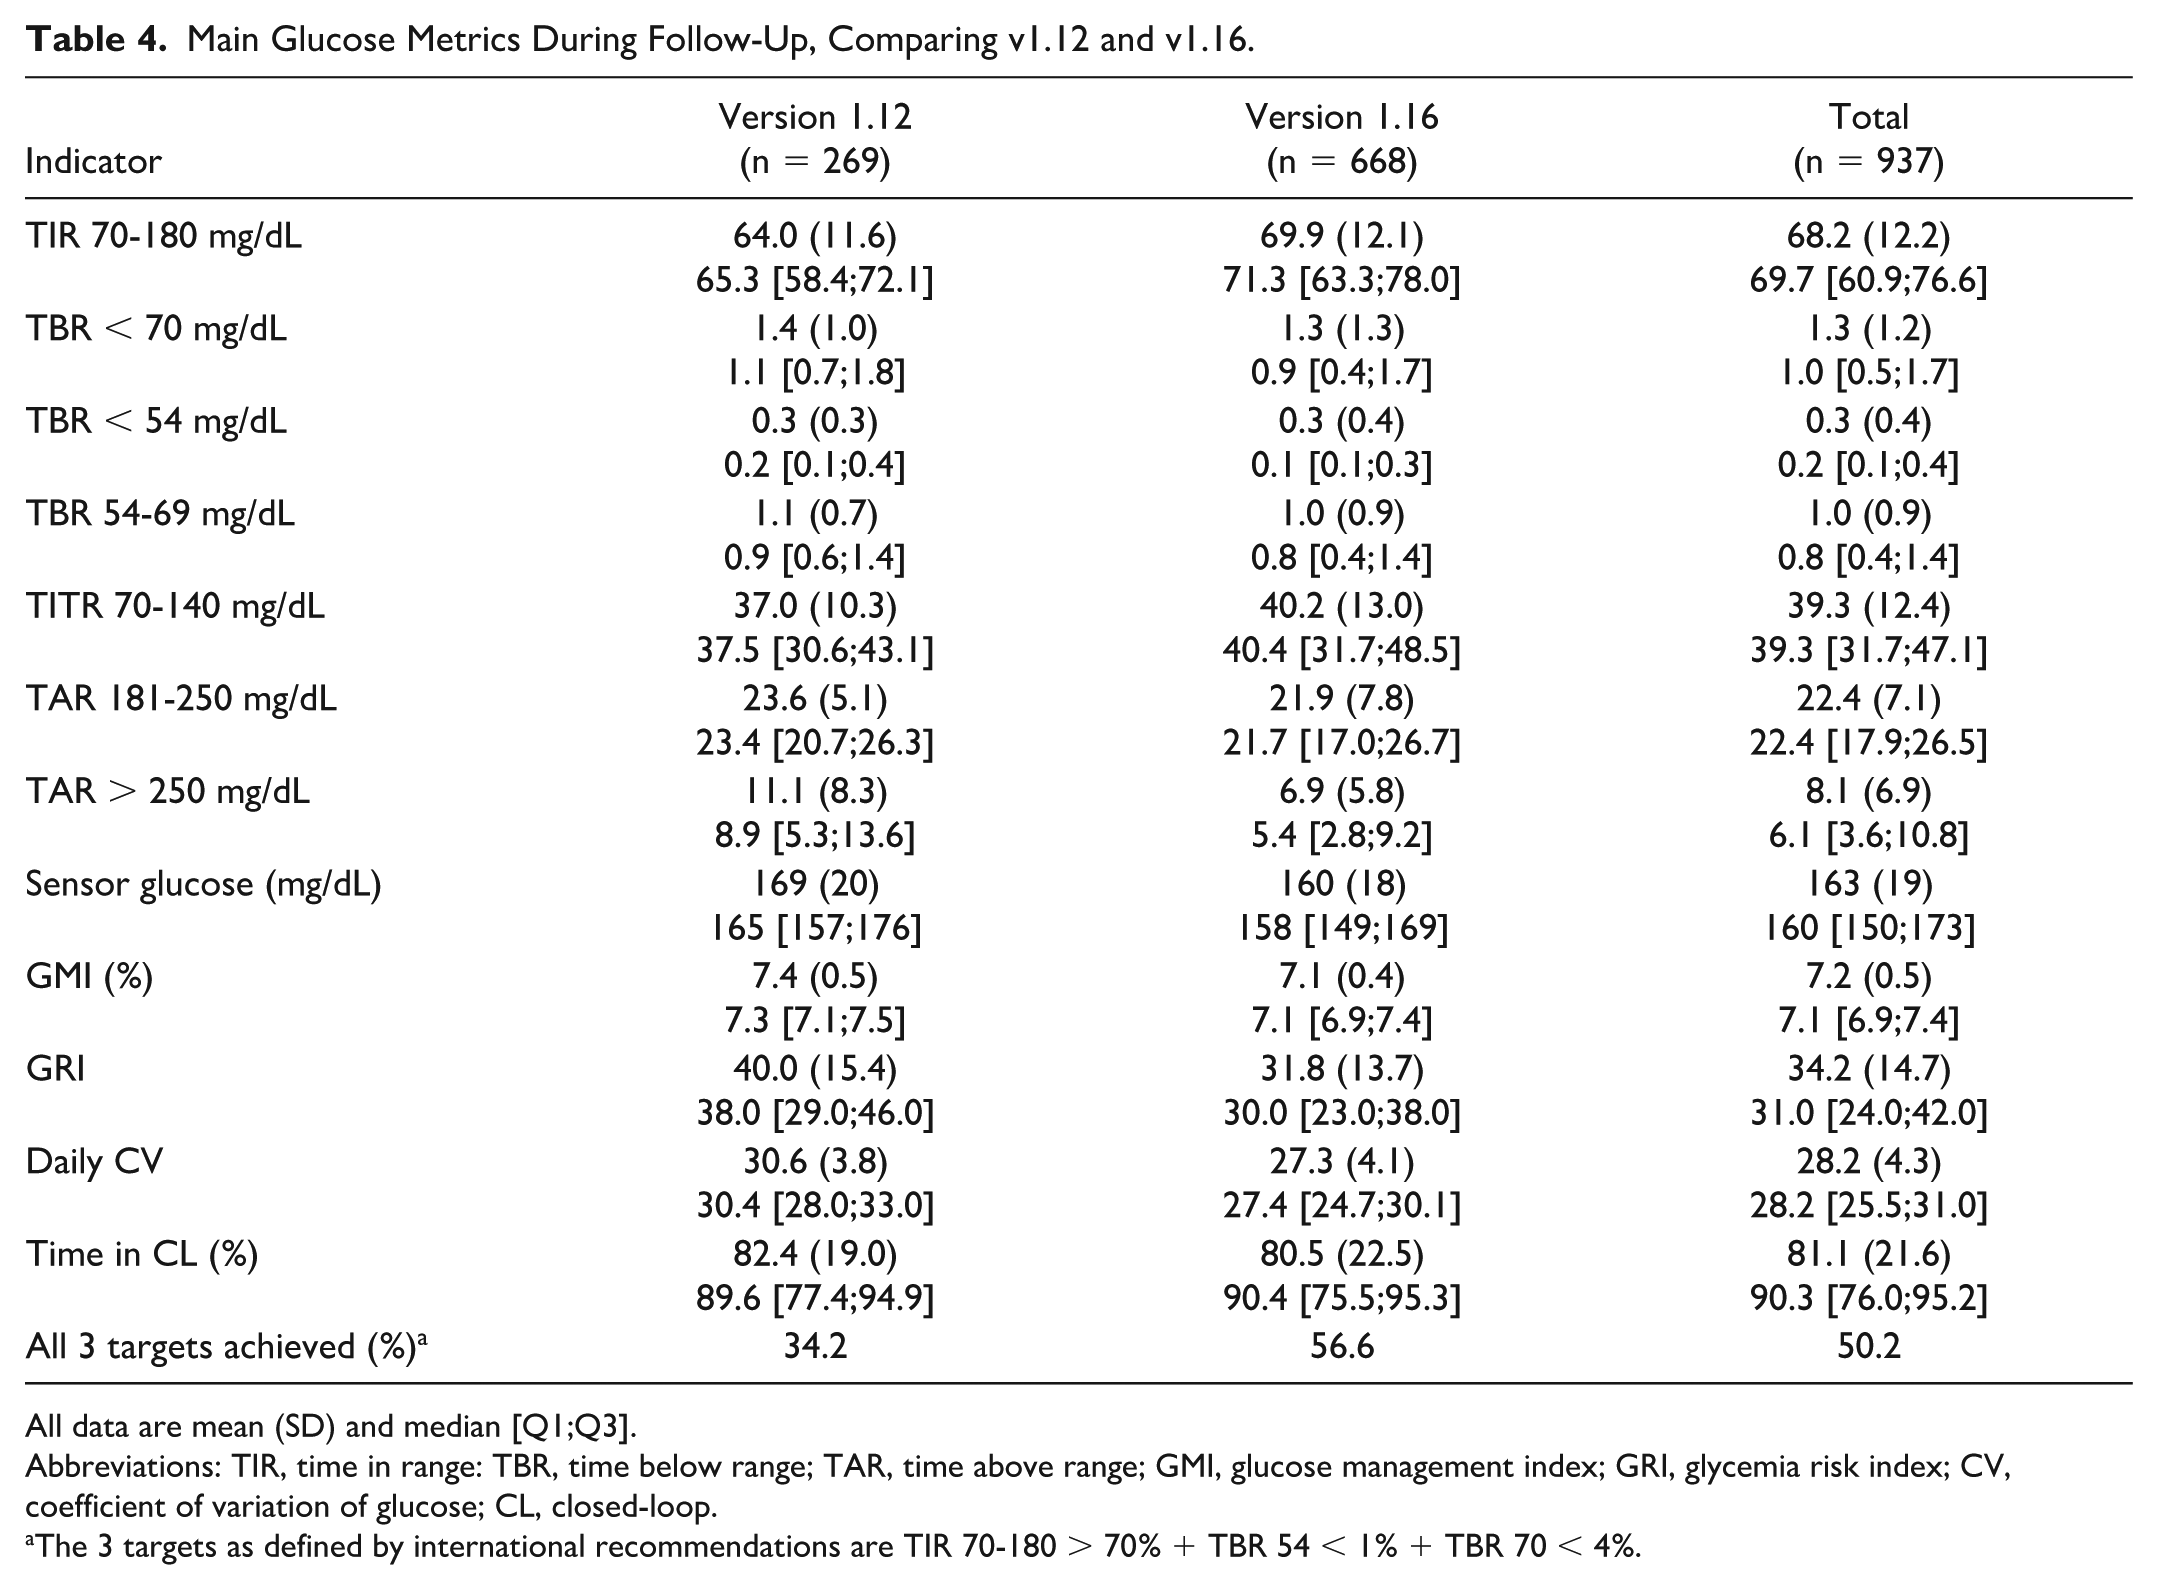
All data are mean (SD) and median [Q1;Q3].
Abbreviations: TIR, time in range: TBR, time below range; TAR, time above range; GMI, glucose management index; GRI, glycemia risk index; CV, coefficient of variation of glucose; CL, closed-loop.
The 3 targets as defined by international recommendations are TIR 70-180 > 70% + TBR 54 < 1% + TBR 70 < 4%.
Evolution of Glucose Metrics When Upgrading From v1.16 to v1.17.
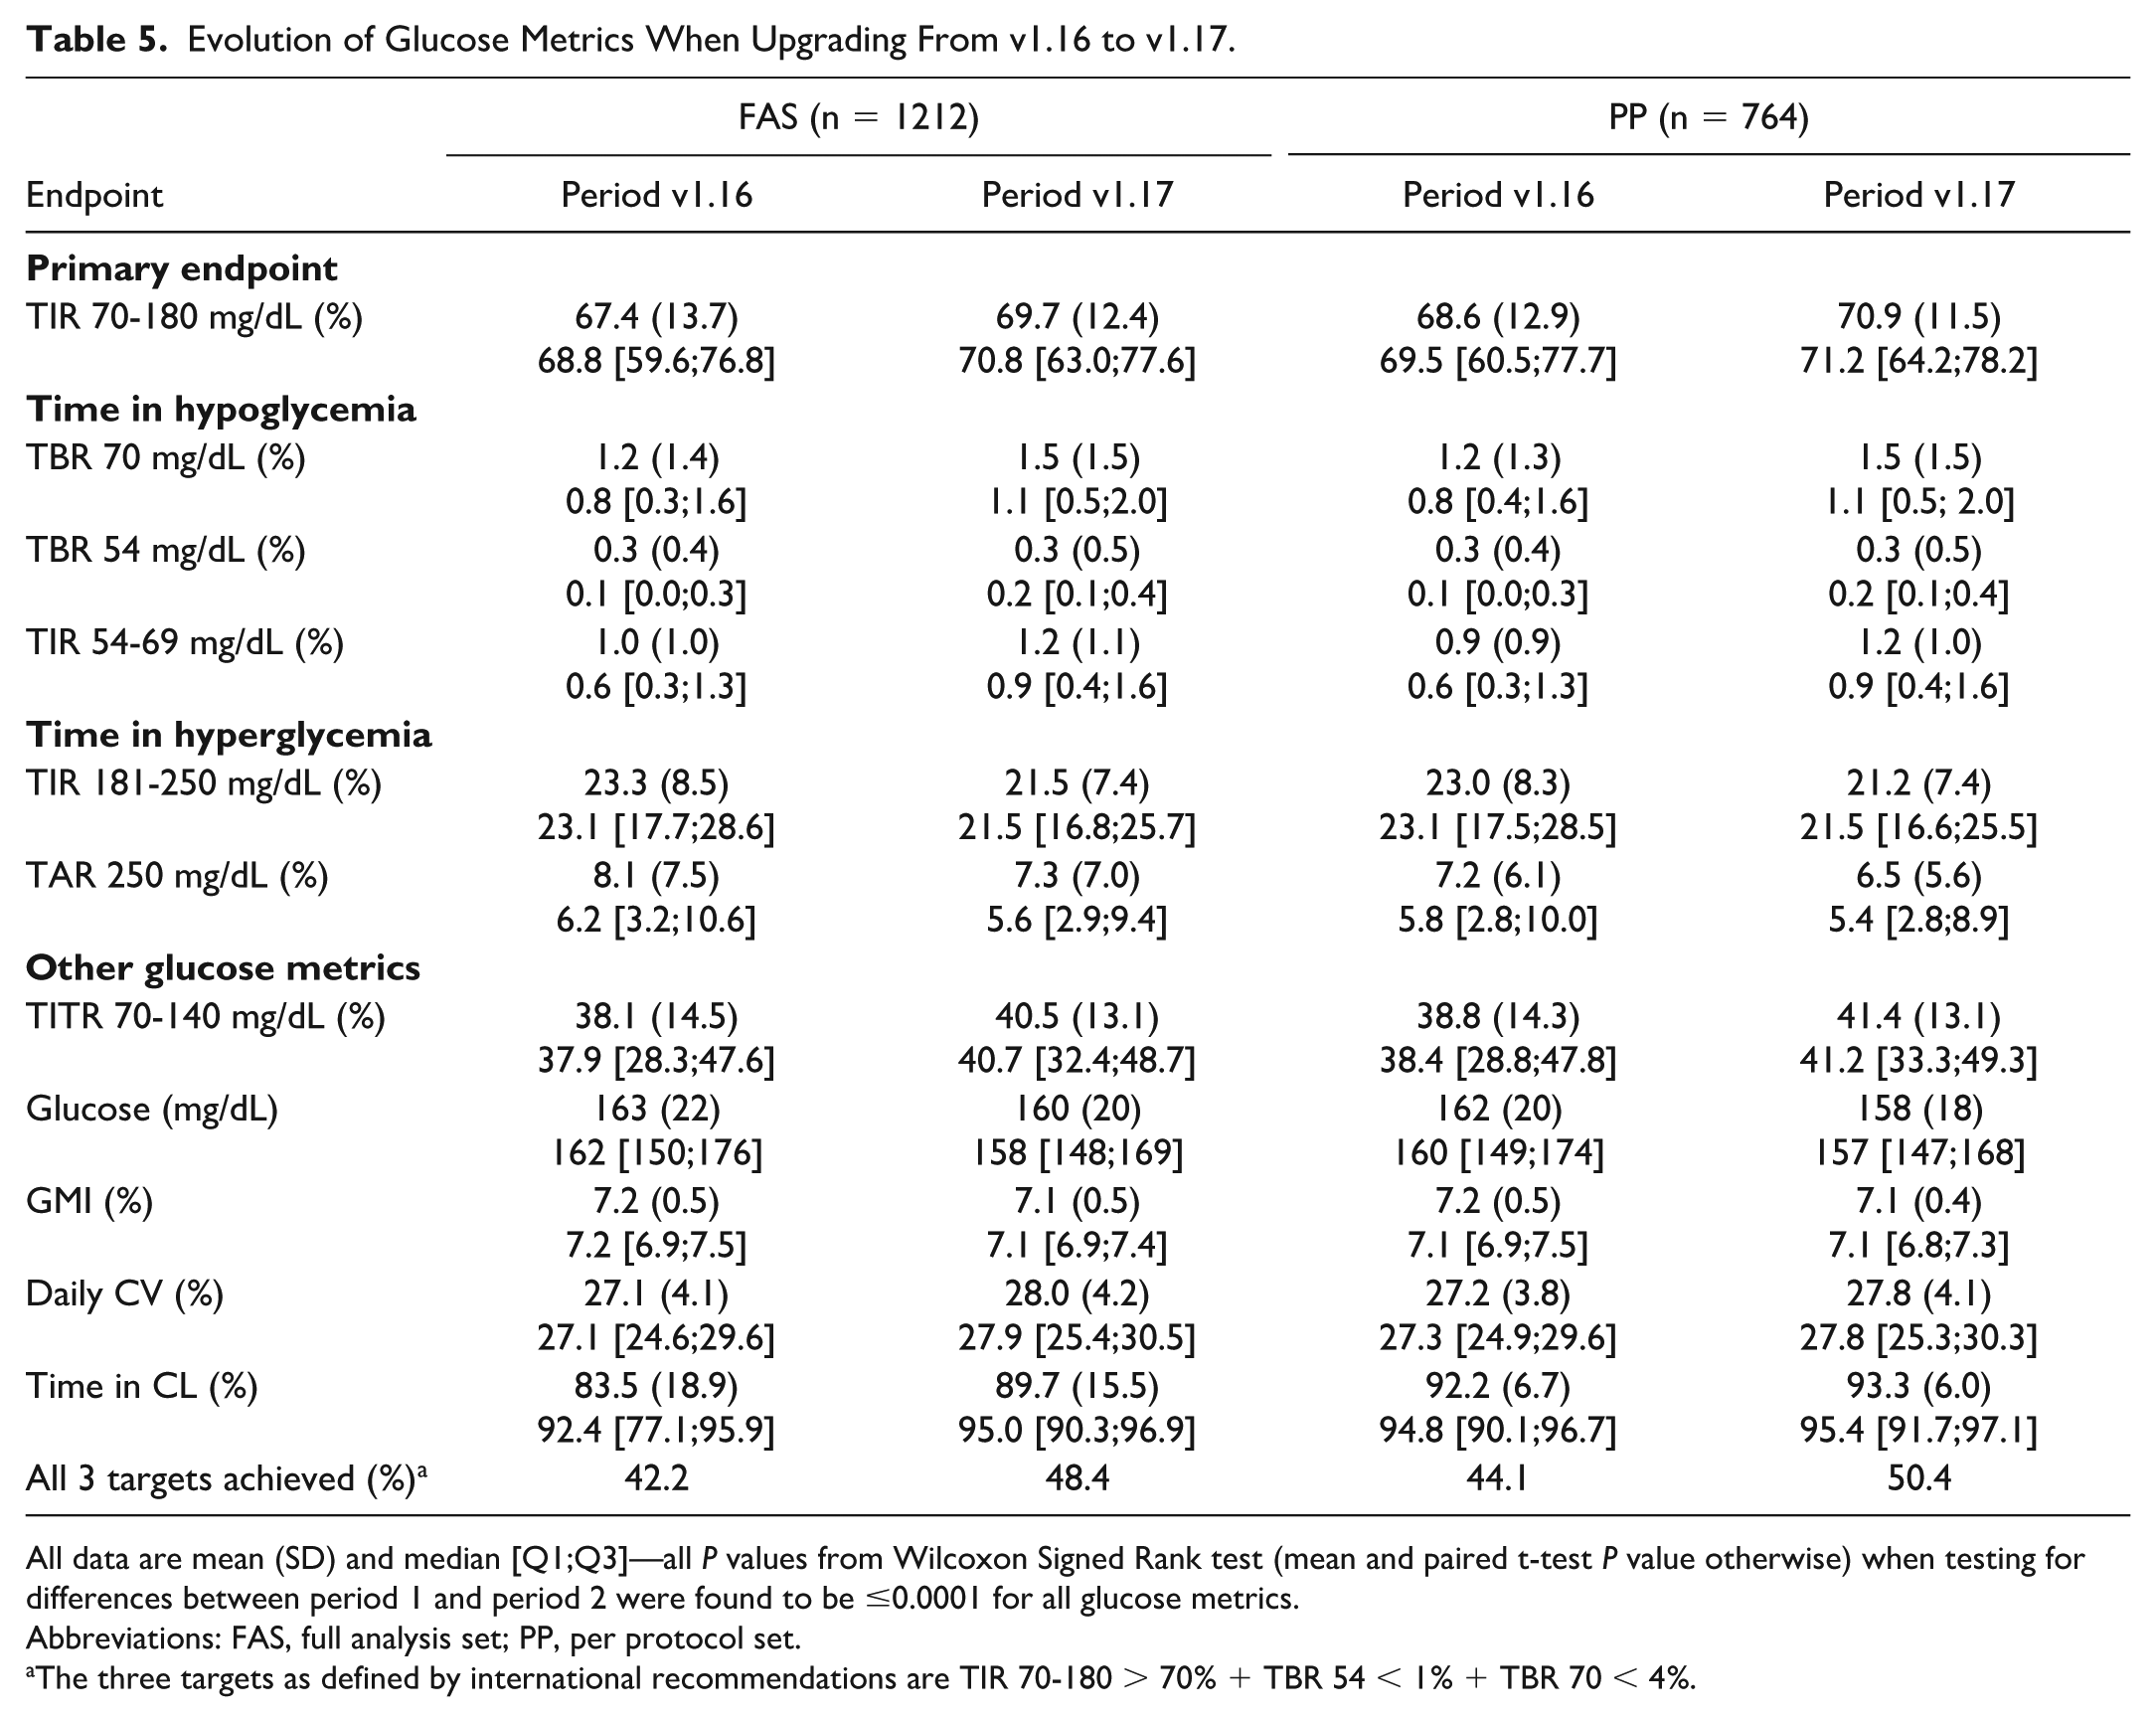
All data are mean (SD) and median [Q1;Q3]—all P values from Wilcoxon Signed Rank test (mean and paired t-test P value otherwise) when testing for differences between period 1 and period 2 were found to be ≤0.0001 for all glucose metrics.
Abbreviations: FAS, full analysis set; PP, per protocol set.
The three targets as defined by international recommendations are TIR 70-180 > 70% + TBR 54 < 1% + TBR 70 < 4%.
Secondary Outcomes
In the first step, the comparison of v1.12 and v1.16 showed marginal and clinically non relevant modifications of the time in hypoglycemia (TBR <70, TBR <54, TIR 54-69 mg/dL) (Table 4). The median TITR 70 to 140 mg/dL improved from 37.5% to 40.4%. The median TAR >250 mg/dL was reduced from 8.9 to 5.4 mg/dL. The median GMI was reduced from 7.3% to 7.1%. The median GRI decreased from 38.0 to 30.0. The daily CV was reduced from 30.4% to 27.4%. The percentage of patients achieving all three international targets for TIR and TBR increased from 34.2% to 56.6% (Table 4). In the second step, we observed an increase in time in hypoglycemia, an increase in TITR and a decrease in TAR, as well as a further increase in the percentage of patients achieving all three international targets for TIR and TBR. However, although modifications in all the tested glucose metrics were statistically significant, the effect size was categorized as small or medium according to Cohen’s d test (Table 5). Data from second step are summarized in Figure 1.
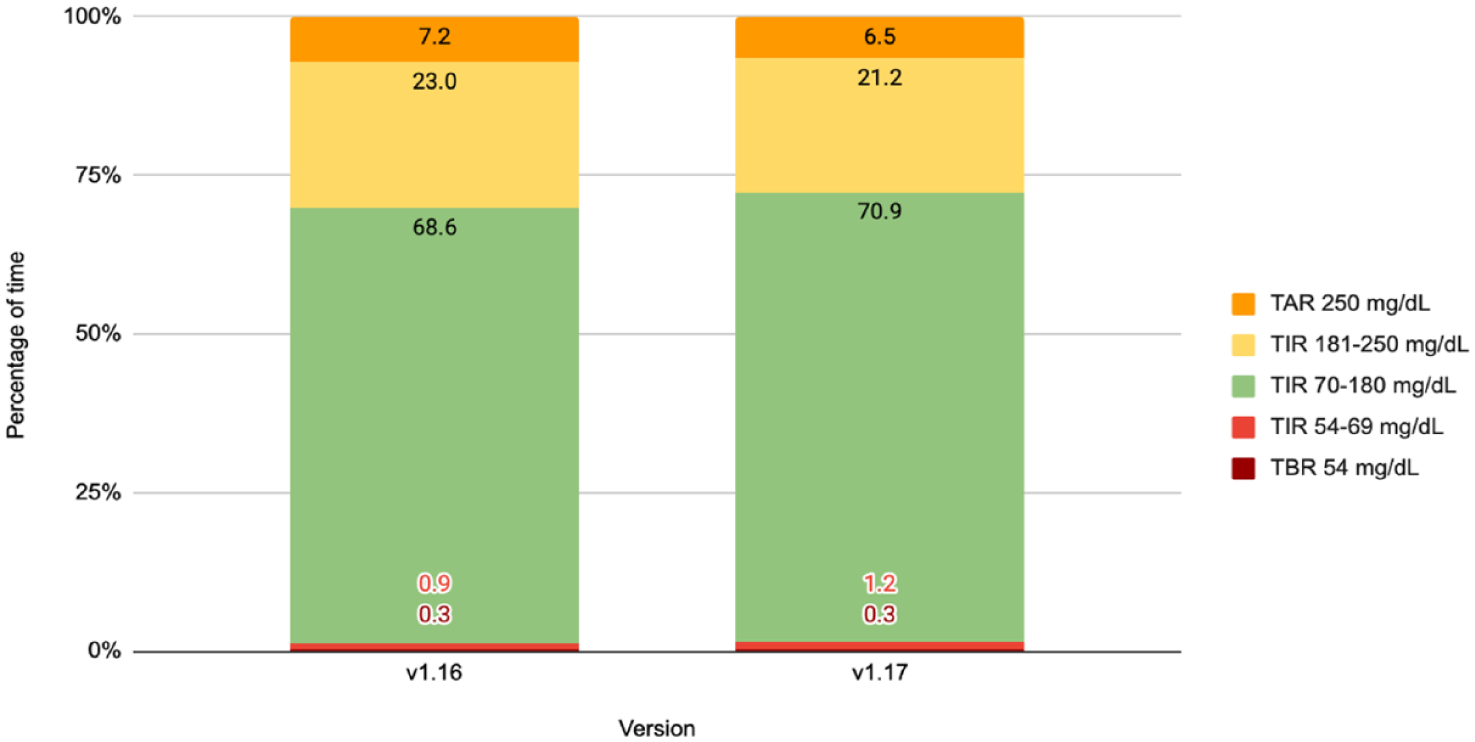
Evolution of glucose metrics when upgrading from v1.16 to v1.17. Metrics are in percentage points. Data are mean (SD), from PP population (n = 764). Units are mg/dL.
Regarding severe hypoglycemia, in the first step, there was one episode among the 269 users of v1.12, and none among the 668 users of v1.16. In the second step, one episode was observed in the first period (v1.16) and none during the second period (v1.17) among the 1212 users. Regarding severe hyperglycemia, defined as hyperglycemia with ketosis above 3 mmol/L or requiring hospitalization, one episode was reported among the 269 users of v1.12, two episodes among the 668 users of v1.16 (first step), and one episode in each period among the 1212 users (second step). None of these hypoglycemic or hyperglycemic episodes were related with a software dysfunction.
Discussion
In this analysis conducted on a data set of about a 1000 adult patients with type 1 diabetes, new users of the DBLG1 hybrid closed-loop system, we observed that the percentage of time spent in the 70 to 180 mg/dL range (TIR) was 5 points higher when running the 1.16 version of the algorithm (71.3%) than with the 1.12 variant of the controller (65.3%). We also observed that the percentage of time spent in the 70 to 140 mg/dL range (TITR) was 3 points higher (40.4 vs 37.5%), whereas the percentage of time spent in the >250 mg/dL range was 3.5 points lower (5.4 vs 8.9%) with a reduced glucose variability (CV, 27.4% vs 30.4%) and a reduced GRI (30.0 vs 38.0). The upgrade from v1.16 to v1.17 was associated with a further improvement in the TIR. Meanwhile the modifications in time in hypoglycemia were not clinically relevant, and TBR remained well below the international recommendations.14,15 In addition, the incidence of severe metabolic events was maintained at a very low level. On one hand, the fact that the TIR70-180 (mean 69.7%, median 70.8%) and TBR70 (mean 1.5%, median 1.1%) achieved by patients in the FAS population using the most recent variant of the software are close to reach international recommendations is excellent news. On the other hand, the 5-point improvement in TIR is very relevant from a clinical perspective, regarding the prevention of vascular complications of diabetes. 16
The first strength of this post-market report is that it includes all patients equipped with the DBLG1 system associated with Kaleido® pump and Dexcom G6® sensor in a narrow timeframe (roughly the whole 2024 year), constituting a large and homogenous cohort recruited in three different European countries. This analysis confirms the efficacy and safety of this AID system, that was initially established by its pivotal study. 9 By providing these data to the scientific community, we comply with the recommendations of the Joint Diabetes Technology Working Group of EASD and ADA, encouraging manufacturers to perform long-term, real-world studies with prespecified data collection requirements. 1
The second strength and originality of this report is brought by the comparisons of three different and successive versions of the control algorithm. Whether the observed differences in the efficacy criteria, namely the improvement in TIR, was related with the software modifications is debatable but most plausible. Although the first step of our analysis was not a controlled study, the differences in the population groups were minor, in terms of age, sex-ratio, weight and baseline HbA1c. However, we have to keep in mind a bias linked to some differences in regulatory approvals between France (v1.12) where DBLG1 was reimbursed in patients already treated with a pump and providing an HbA1c ≥8%, and Germany and Netherlands (v1.16 and v1.17), that did not restrict the use of DBLG1 according to HbA1c or previous pump usage. The second step of our work used a more robust before/after, ambispective study design and brought a further point in favor of the hypothesis that the modifications in the software were involved in the observed improvements in glucose metrics. Of note, all patients used the same hardware (Kaleido® pump and Dexcom G6® sensor).
One weakness of this study is that it relied solely upon information uploaded from the controller handset to the cloud-stored database, meaning the unavailability of any patient-reported outcomes, evolution of laboratory measurement of HbA1c, and information regarding glucose metrics prior to the initiation of closed-loop therapy. Future studies should strive to collect these pieces of information through forms pushed on the handset, with appropriate authorizations.
To our knowledge, reports about glucose metrics following algorithmic modifications in the field of AID therapy are scarce.7,8 We believe that our study highlights the possibilities brought by software upgrades. Of note, the controller changes here targeted the meal period and the management of hypoglycemia and hyperglycemia, which are the most crucial aspects of closed-loop algorithm design. It is admitted by AID manufacturers and experts that, as far as software is concerned, future progress will deal with the management of unannounced meals17,18 and physical activity, 19 and the possibility to customize the treatment through the use of deep learning and digital twin technologies. 20
The glucose metric outcomes (TIR, TITR, TBR, and CV: 70%, 40%, <1.5%, and 28%, respectively) observed here with DBLG1 v1.17 should be interpreted in light of available data from other commercial AID systems using the same glucose sensor. In the absence of any head-to-head trials, such interpretation must remain cautious. A recent meta-analysis of randomized controlled trials in adults reported a TIR ranging from 63% to 71.8% and a TITR ranging from 36% to 46% with the Control-IQ, iLet, and Omnipod-5 systems. 21 A retrospective one-year report from a regional registry of users of four AID systems in routine practice highlighted a trend toward a lower TBR and CV among DBLG1 users, without clear-cut differences between AID systems. 22 Optimizing TIR and TITR without compromising TBR is a constant trade-off.
In conclusion, this post-market report confirms the efficacy and safety of DBLG1 hybrid closed-loop system and strongly suggests that the recent algorithmic modifications targeting the meal period and the management of hypoglycemia and hyperglycemia are contributive to improved glycemic outcomes. This paper underscores the critical role of algorithmic enhancements in improving the performance and safety of automated insulin delivery systems.
Footnotes
Abbreviations
AID, automated insulin delivery; CGM, continuous glucose monitoring; CL, closed-loop; CV, coefficient of variation; GMI, glucose management index; GRI, glucose risk index; TAR, time above range; TBR, time below range; TIR, time in range; TITR, time in tight range.
Author Contributions
PYB: manuscript writing. AV: statistical report. LR: data monitoring. BC: study conception. PYB is the guarantor of this work and, as such, had full access to all of the data in the study and takes responsibility for the integrity of the data and the accuracy of the data analysis.
Declaration of Conflicting Interests
The authors declared the following potential conflicts of interest with respect to the research, authorship, and/or publication of this article: AV, LR, and BC are employees from Diabeloop SA. PYB is a consultant for Diabeloop SA. No author has been paid to write this article, and the findings and conclusions in this study are those of the authors. The corresponding author had full access to all the data in the study and had final responsibility for the decision to submit for publication.
Funding
The authors disclosed receipt of the following financial support for the research, authorship, and/or publication of this article: The study was funded by Diabeloop SA (Grenoble, France).