
Abstract
Importance and aims:
Diabetes can lead to microvascular and macrovascular complications. Modeling the complex relationships between risk factors has motivated the use of Artificial Intelligence (AI) to develop predictive models. Recent advancements, including foundation models and generative AI, have significantly changed how this technology is applied across various contexts. In this review, we summarize the current state of research on AI for predictive diabetes complications, investigating the present and future implications of these innovations.
Methods:
We conducted the literature search on PubMed, Scopus, Ovid MEDLINE, CINAHL, and IEEE databases. Our analysis focused on predicted complications, population characteristics, use of AI-based approaches, models’ performance, predictor variables, and feature importance evaluation results.
Results:
The 49 studies selected in our analysis considered different conditions as prediction outcomes. Eye-related complications were included in 29 studies (59%), emerging as the most frequent predicted diseases. Among the 48 studies employing AI algorithms specifically for the prediction task, 26 (54%) developed only Machine Learning models, 4 (8%) only Deep Learning models, and 18 (38%) applied both approaches. Foundation models and recent AI innovations included in the query were not used by any study. Moreover, only five studies (10%) dealt with unstructured data (signals and images). In the feature importance evaluation, age and glycated hemoglobin consistently emerged as important predictors.
Conclusions:
Despite the extensive existing literature on AI for predicting diabetes complications, several emerging challenges persist. These include the effective utilization of unstructured data and the integration of recent advancements introduced by foundation models and generative AI.
Introduction
Diabetes-related complications affect both microvascular and macrovascular systems, increasing the clinical and financial impact of this condition. The long-term damage to the macrovascular system remains the leading cause of death in people with diabetes. On the other hand, microvascular complications involving kidneys, eyes, and nerves significantly impact morbidity and mortality, leading to severe outcomes, such as amputations, end-stage renal disease, and vision loss. 1 In this context, predictive models of diabetes progression could enable earlier interventions, personalized treatments, and suitable resource allocation. 2 Beyond well-recognized clinical risk factors of diabetes complications, such as the disease duration, the presence of specific comorbidities and the genetic predisposition, other biological, lifestyle, and socioeconomic aspects contribute to the clinical progression of the disease. However, predicting the onset of complications considering this multitude of factors is complex, limited by the heterogeneous nature of these factors and by the variability of their collection across clinical centers. Artificial Intelligence (AI) has been increasingly used for this purpose, due to its ability to handle large and complex data sets. 3 The AI has brought several advantages compared to the existing scores for predicting diabetes complications derived using traditional statistical models. 4 By providing more advanced and sophisticated solutions, such as non-linear models trained on a larger number of variables, AI may be better suited to handle the complexity of the relationships among predictors. 3 Furthermore, generative AI models have provided powerful solutions to challenges like data scarcity, patient variability, and personalization by modeling, simulating, and generating high-quality synthetic data. 5 In this context, the advent of foundation models marked a significant milestone. Trained on massive (typically hundreds of millions to billions of samples) and heterogeneous data sets and using general-purpose objectives through a large-scale self-supervised learning approach, this last generation of AI models can be adapted for a wide range of tasks and used directly or after further fine-tuning on specific data sets, reducing the need for an extensive target data source to obtain task-specific model.4,6 Among the variety of tasks, foundation models are often employed as generative AI models to create new content, such as text or images. Large Language Models (LLMs), as high-capacity foundation models for text generation, mostly based on the groundbreaking Transformer architecture, played a pivotal role in establishing this new paradigm of AI. 6 In the diabetes domain, some recent studies proved the potential impact of these large pre-trained models. Li et al exploited an LLM within an image-language system for primary diabetes care. The LLM demonstrated comparable performance to primary care physicians in providing individualized management recommendations for people with diabetes. 7 Lutsker et al developed GluFormer, a foundation model for CGM data, designed to learn glycemic risk patterns. GluFormer outperformed traditional metrics in risk-based patient stratification. 8 Finally, Rancati et al exploited TimeGPT model for blood glucose prediction in pediatric patients with type 1 diabetes. The performance achieved by TimeGPT against the state-of-the-art models demonstrated its promising generalization capability. 9
Considering the increasing application of AI in developing predictive models of diabetes complications and the recent technological innovations of AI models, we conducted a systematic review to summarize the current state of research on the topic. We aimed at highlighting the advantages and limitations of AI applications in this field, investigating the impact of technological innovations, and outlining future perspectives. Our research encompassed both microvascular and macrovascular complications and, from a methodological perspective, considered traditional AI models (Machine Learning—ML—and Deep Learning—DL—techniques), as well as recent developments (foundation models, generative AI, LLMs).
Methods
Study Design
We conducted the literature search on PubMed, Scopus, Ovid MEDLINE, CINAHL, and IEEE databases. Our query was structured in three main sections (diabetes complications, methods, prediction task), linked by an AND Boolean operator:
“Diabetes Complications” (MeSH term) AND
“Artificial Intelligence” (MeSH term) OR “Machine Learning” (MeSH term) OR “Neural Network, Computer” (MeSH term) OR “foundation models” OR “generative AI” OR “transformer models” OR “pre-trained models” OR “large language models” AND
“Predict* Models” OR “Risk Assessment” (MeSH term).
We used the truncation symbol “*” for “Predict” to include all terms beginning with this root, such as “predictive” and “prediction.” The queries were applied to the title, abstract, and keywords fields. To select the studies, we conducted a two-phase screening procedure, based on the abstract (first screening) and the full text (second screening). When possible (in PubMed and Ovid MEDLINE databases and for terms existing in MeSH), MeSH terminologies were included in the query. Consequently, due to the possible inclusion of MeSH terms and the different modalities required to exploit this feature, queries slightly vary among databases. The specific query used for each database is detailed in the Supplementary Material.
Eligibility Criteria
We were interested in studies implementing and/or applying AI models to predict diabetes complications in patients diagnosed with diabetes. To ensure a robust assessment of the use of these techniques, it was necessary to select studies that provided a comprehensive description of both the methods and the population characteristics. Based on this general requirement, we defined exclusion criteria. Specifically, in the first screening phase, we excluded studies where:
The population included individuals not diagnosed with diabetes (reason 1).
The population was limited to patients with diabetes and additional conditions, such as studies focusing on diabetes complication progression once the complication had already been diagnosed (reason 2).
The objective did not include the prediction of the onset of the complication but only the identification of its risk factors (reason 3).
The objective focused on predicting diabetes or classifying its status (reason 4).
The predicted complication was not specific to diabetes, such as studies considering death, depression, or COVID-19 as prediction outcomes (reason 5).
In addition, we excluded reviews (reason 6) and retracted studies (reason 7). For the second screening, we added more detailed exclusion criteria, based on specific aspects observable from the full presentation of the studies. These conditions involved:
The absence of information on the population (reason 8).
The use of secondary data from a previous systematic review, instead of specific population data sets (reason 9).
The use of proprietary tools, ie, algorithms whose implementation is owned and whose usage is controlled by a company (reason 10).
Moreover, we excluded studies where the methodology was not clearly presented, eg, where authors did not provide sufficient detailed information about the implementation strategies of the AI models, such as training procedures or validation strategies (reason 11). Finally, we could not include studies for which we were unable to retrieve the full text, even through our institutional access (reason 12).
Data Extraction and Analysis
The analysis of the selected studies was conducted based on eight main categories of characteristics describing the approaches used. Specifically, we collected information on:
Publication year, location, including both the country of the first author’s affiliation and the population’s country (general information).
The predicted complications (prediction outcome).
Population characteristics, including type of diabetes, age (distinguishing pediatric and adult patients and considering adults when age was higher than 18), and percentage of females (population).
The AI models employed, the reproducibility of the implemented approaches and the evaluation strategy, distinguishing between internal and external validation (models).
The predictor variables used in the final model (predictor variables).
The Receiver Operating Characteristic Area Under the Curve (ROC AUC) value achieved by the best model, if ROC AUC was selected among the performance metrics (evaluation metrics).
Whether a feature importance evaluation was performed and the first three predictors selected from the feature ranking (feature importance).
We analyzed absolute and relative frequencies for categorical variables and computed descriptive statistics for continuous variables, including mean, standard deviation, median, minimum, maximum, and interquartile range (IQR). The analysis was carried out using Python 3.12.
Results
The total number of records extracted by the queries across the databases was 188. Among them, we identified 34 duplicates. The specific number of records obtained from each database, together with the screening procedure results, is reported in the PRISMA diagram in Figure 1. The diagram indicates the number of studies excluded for each criterion (reasons 1-12) in both the first screening and the second screening. The final number of reviewed full papers was 49. The complete list of these studies is provided in Supplementary Table 1. We will detail the results of our analysis considering each of the categories defined in section “Data extraction and analysis” (from general information to feature importance).
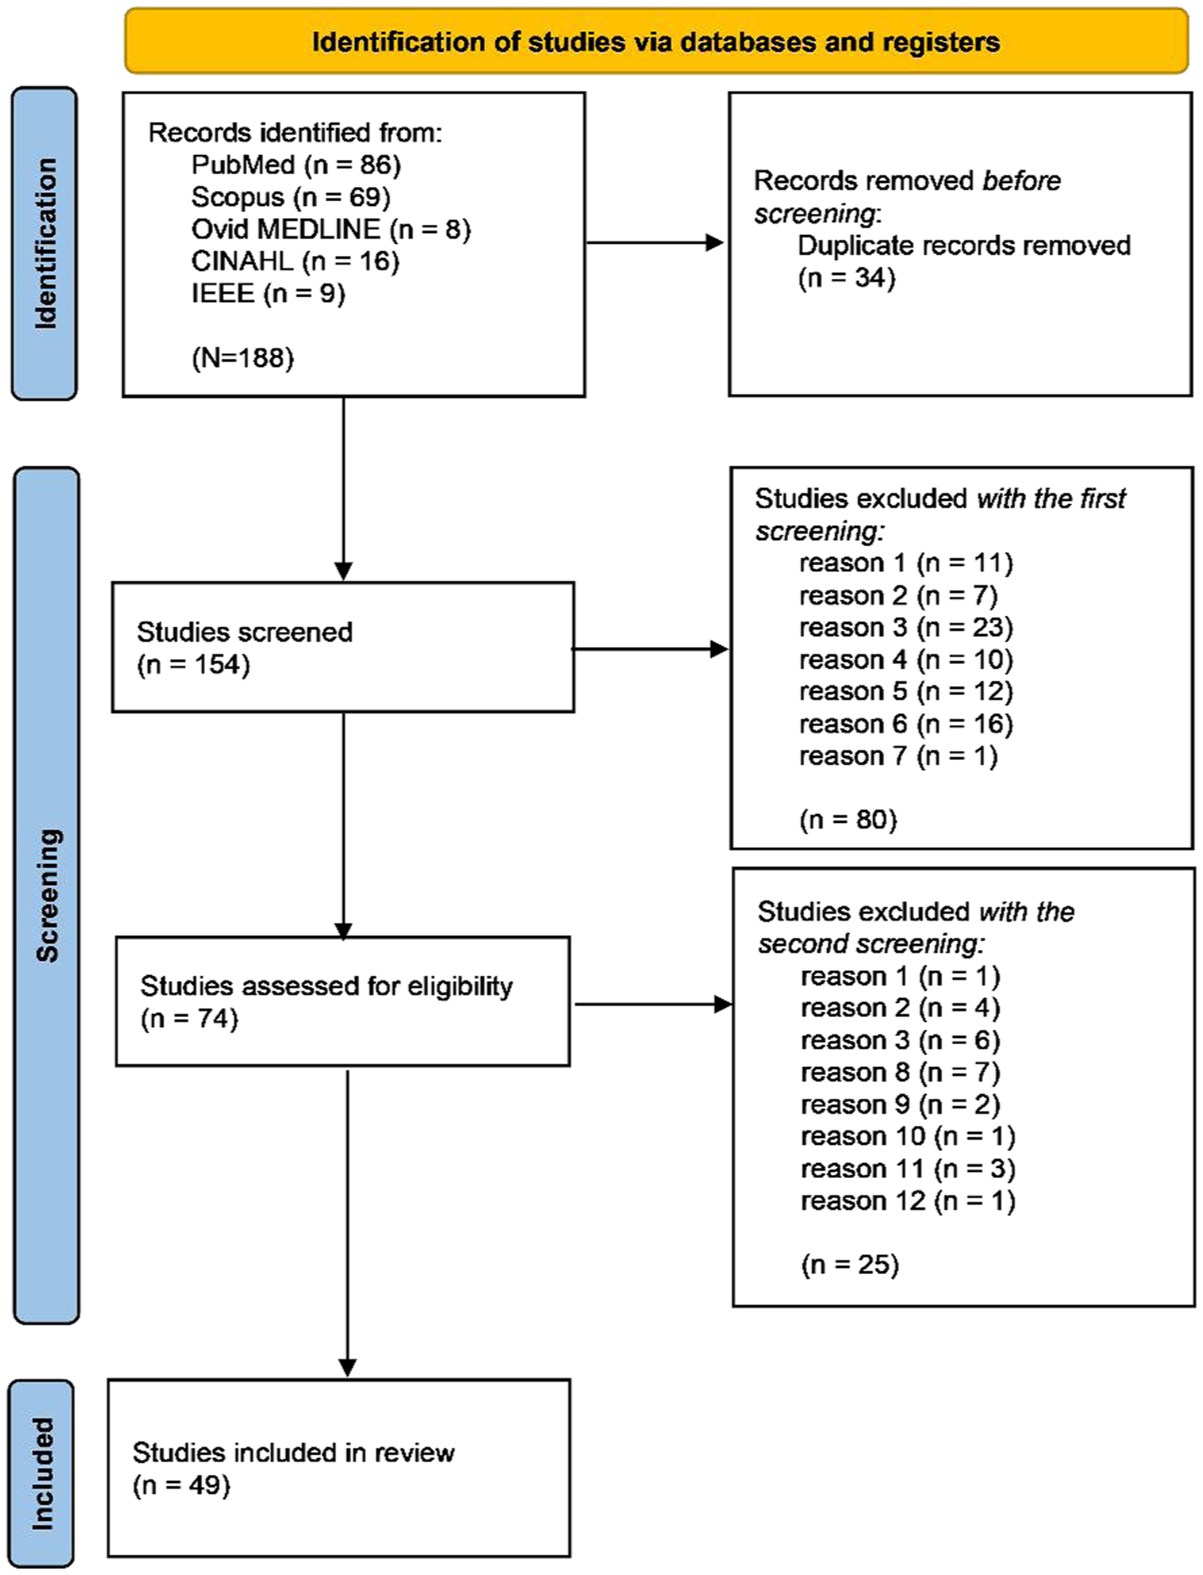
PRISMA diagram.
General Information
The included studies were published between 2010 and 2025, mainly in China and the United States. Figure 2 shows the study frequency by year, while Figure 3 illustrates the frequency by country. A general increasing trend can be observed over the years, with a noticeable peak in 2024. The frequency indicated for 2025 is limited to March 2025, when the records’ extraction was performed.
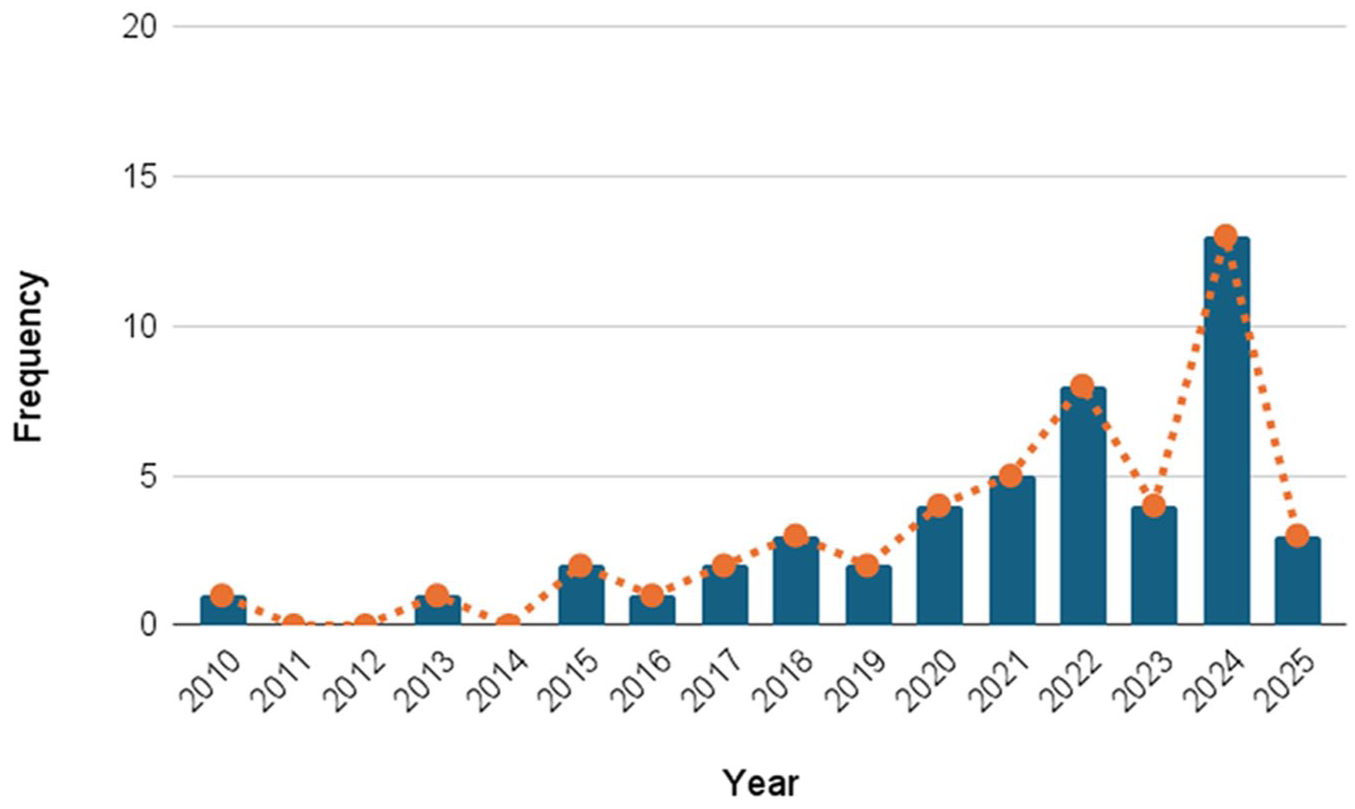
Study frequency by year.
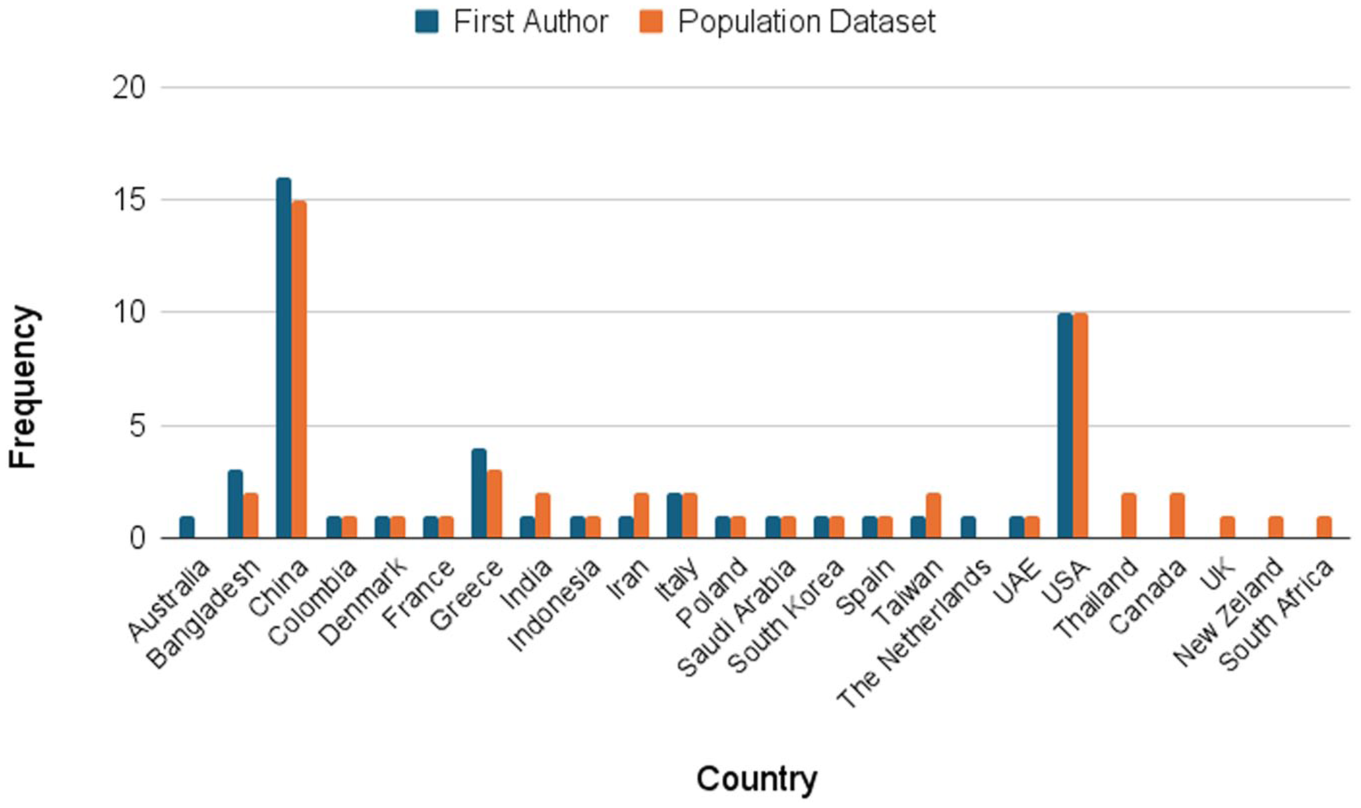
Study frequency by country, considering the author’s affiliation and the population origin.
Prediction Outcome
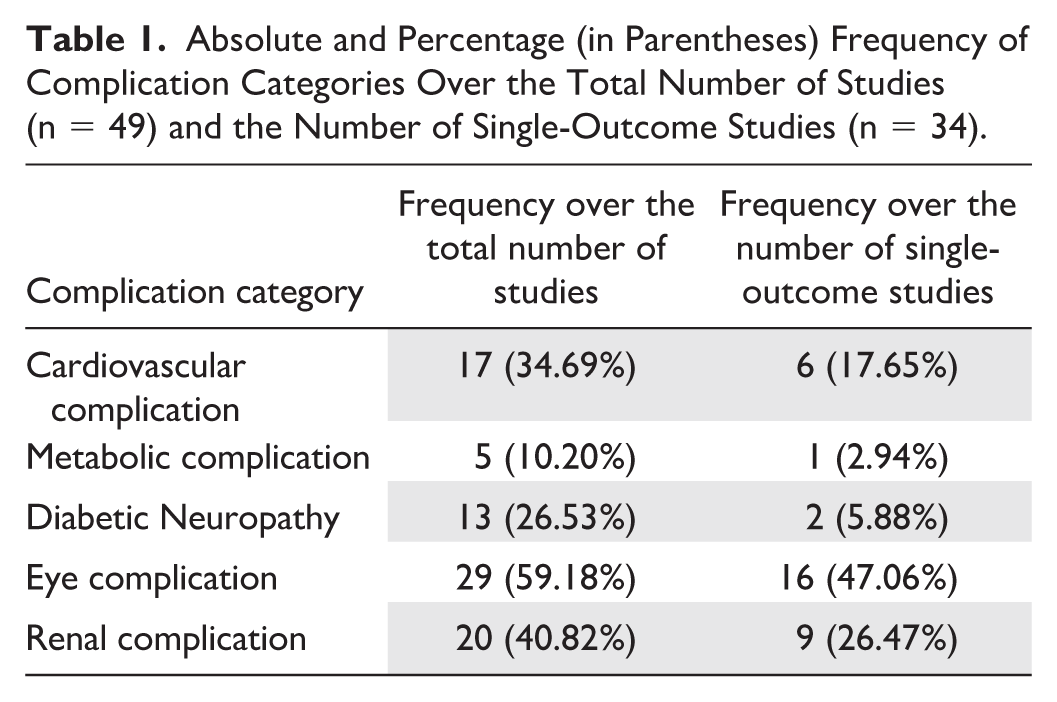
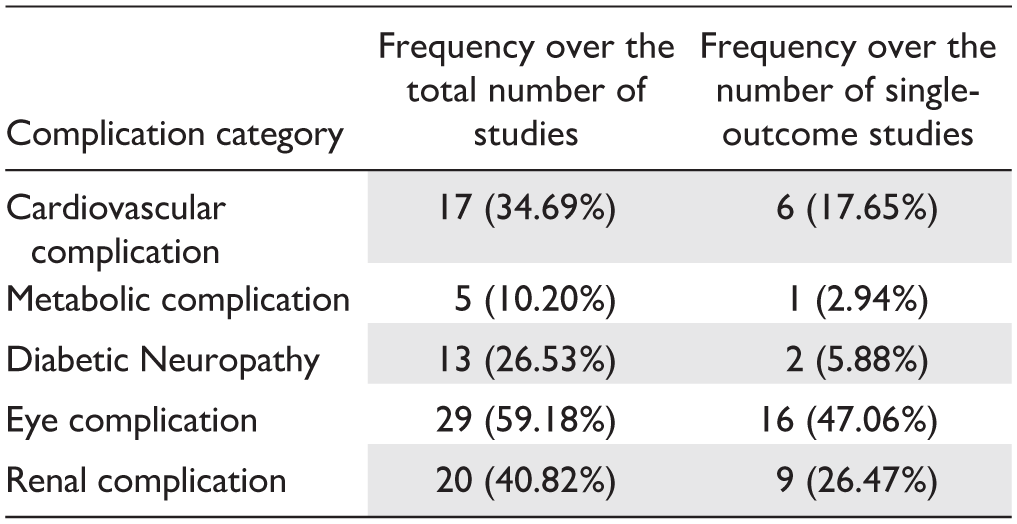
Two main groups were identified according to the number of prediction outcomes: 34 studies (69%) considered one complication as the target condition,10-43 while 15 (31%) addressed the prediction of multiple complications.44-58 In this second group, the mean number of prediction outcomes was 3.3 (± 0.85 standard deviation). To evaluate the distribution of complications as prediction objective in studies, we grouped the specific conditions predicted in studies into five main categories: Cardiovascular Complication, Metabolic Complication, Diabetic Neuropathy, Eye Complication, and Renal Complication, as shown in Supplementary Table 2. Table 1 reports how frequently each complication was targeted in predictive modeling across the included studies, considering both the total number of studies (n = 49) and the number of studies that selected a single complication as the outcome (single-outcome studies, n = 34). Most studies focused on the diseases within the Eye Complication category, while the Metabolic Complication category was the least investigated.
Absolute and Percentage (in Parentheses) Frequency of Complication Categories Over the Total Number of Studies (n = 49) and the Number of Single-Outcome Studies (n = 34).
Population
Results concerning the analysis of population characteristics are presented in Table 2. The number of patients included varied considerably across studies, as indicated by the standard deviation in Table 2. However, we observed that most studies (73%) employed fewer than 10 000 patients, and 50% of them fewer than 1000. This suggests that the average number of patients reported in Table 2 was inflated by a few studies with particularly large samples. Among them, Ljubic et al 53 used the largest population data set, including more than 1 million patients. Although not all studies reported information on the type of diabetes, the percentage of females, or the patients’ age, we observed that most studies focused on adult patients (>18 years) with type 2 diabetes. Only three studies dealt with type 1 diabetes,10,44,51 and only two studies involved pediatric patients.44,57
Statistics Describing the Main Characteristics of Study Populations.
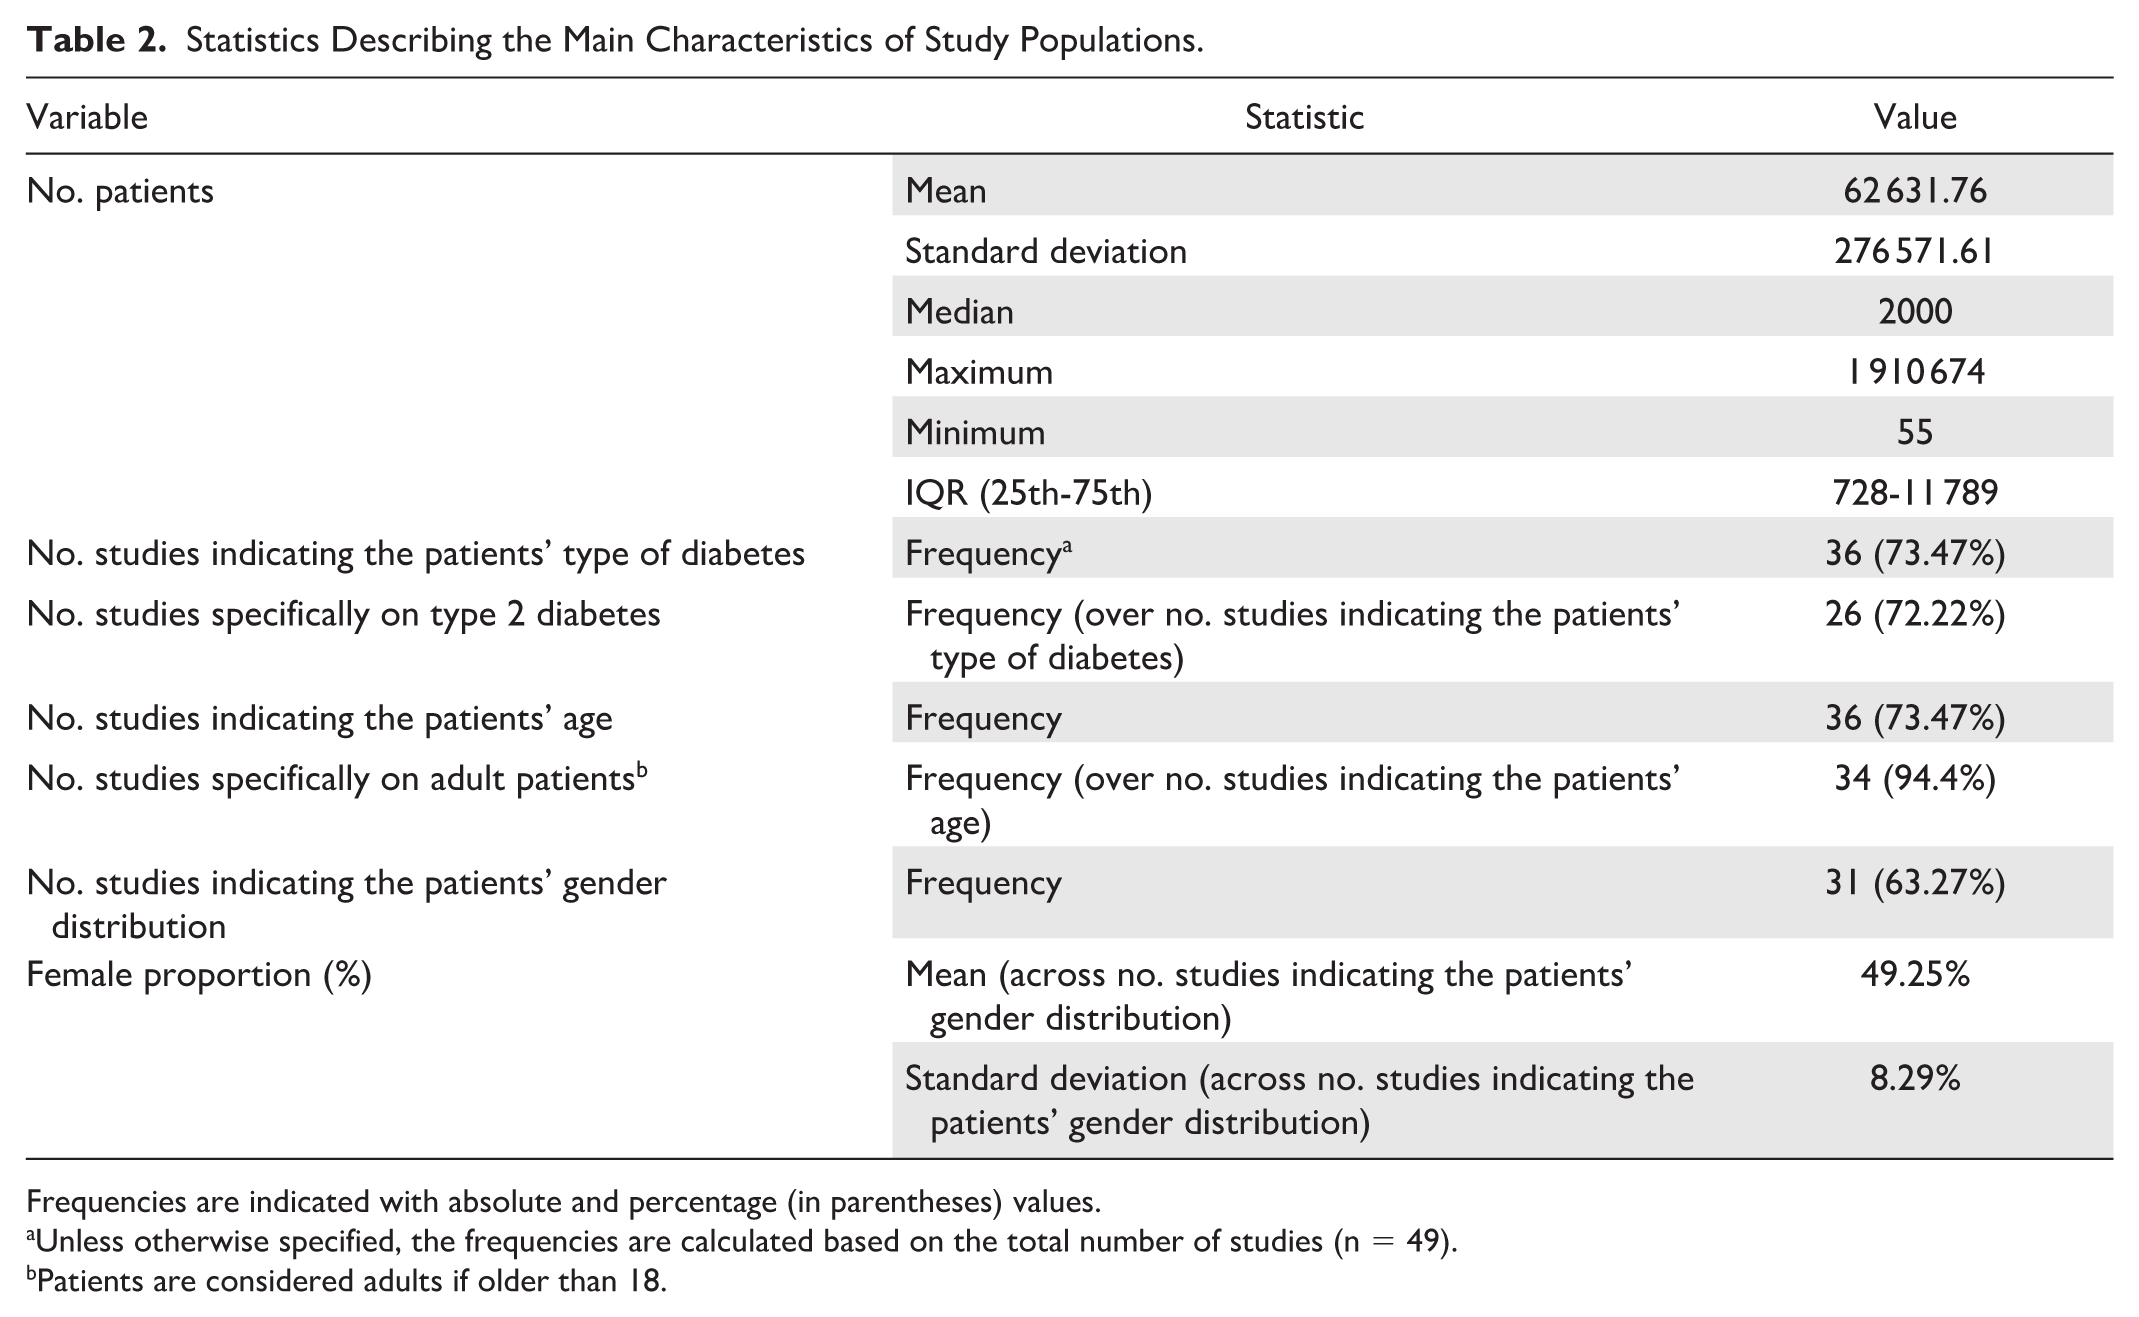
Frequencies are indicated with absolute and percentage (in parentheses) values.
Unless otherwise specified, the frequencies are calculated based on the total number of studies (n = 49).
Patients are considered adults if older than 18.
Models
The most recent AI models included in queries (foundation models, LLMs, or generative AI models) were not reported by any of the studies. Traditional ML and DL algorithms constituted the most common general approaches used for predicting diabetes complications. In addition, seven studies (14%) also explored traditional statistical methods for this purpose, employing Cox proportional hazards regression models and adding Kaplan-Meier analysis (in four studies). In six out of these seven studies, traditional statistical methods were compared with or used in addition to AI models.17,20,29,31,52,57 Basu et al, 45 instead, employed only statistical approaches. This study was anyway included in the query results due to its use of an AI-based feature selection method. Among the studies exploiting AI methods (n = 48), the majority developed task- and population-specific models (ie, the training procedure was performed on their own data set, and it was targeted to a specific task). Only two studies adopted pre-trained models.36,40 Bora et al 40 proposed the validation on an external data set of a pre-trained Convolutional Neural Network (CNN) to predict diabetic retinopathy from fundus photographs. The network training (on a set of about 600 000 fundus photographs) and its first validation were presented in another study by the same author. 31 Zanelli et al 36 applied a pre-trained CNN for processing signals from photoplethysmography and pulse wave velocity technologies, again for the prediction of diabetic retinopathy. In this way, they performed an external validation of the CNN network that was pre-trained on the same types of data (900 signals) and presented in a previous study by the same author. 59 Despite leveraging pre-training, the focus on domain-specific tasks, the same input modality, and the use of relatively small data sets for the training procedure preclude the models proposed in both studies from being considered foundation models.36,40
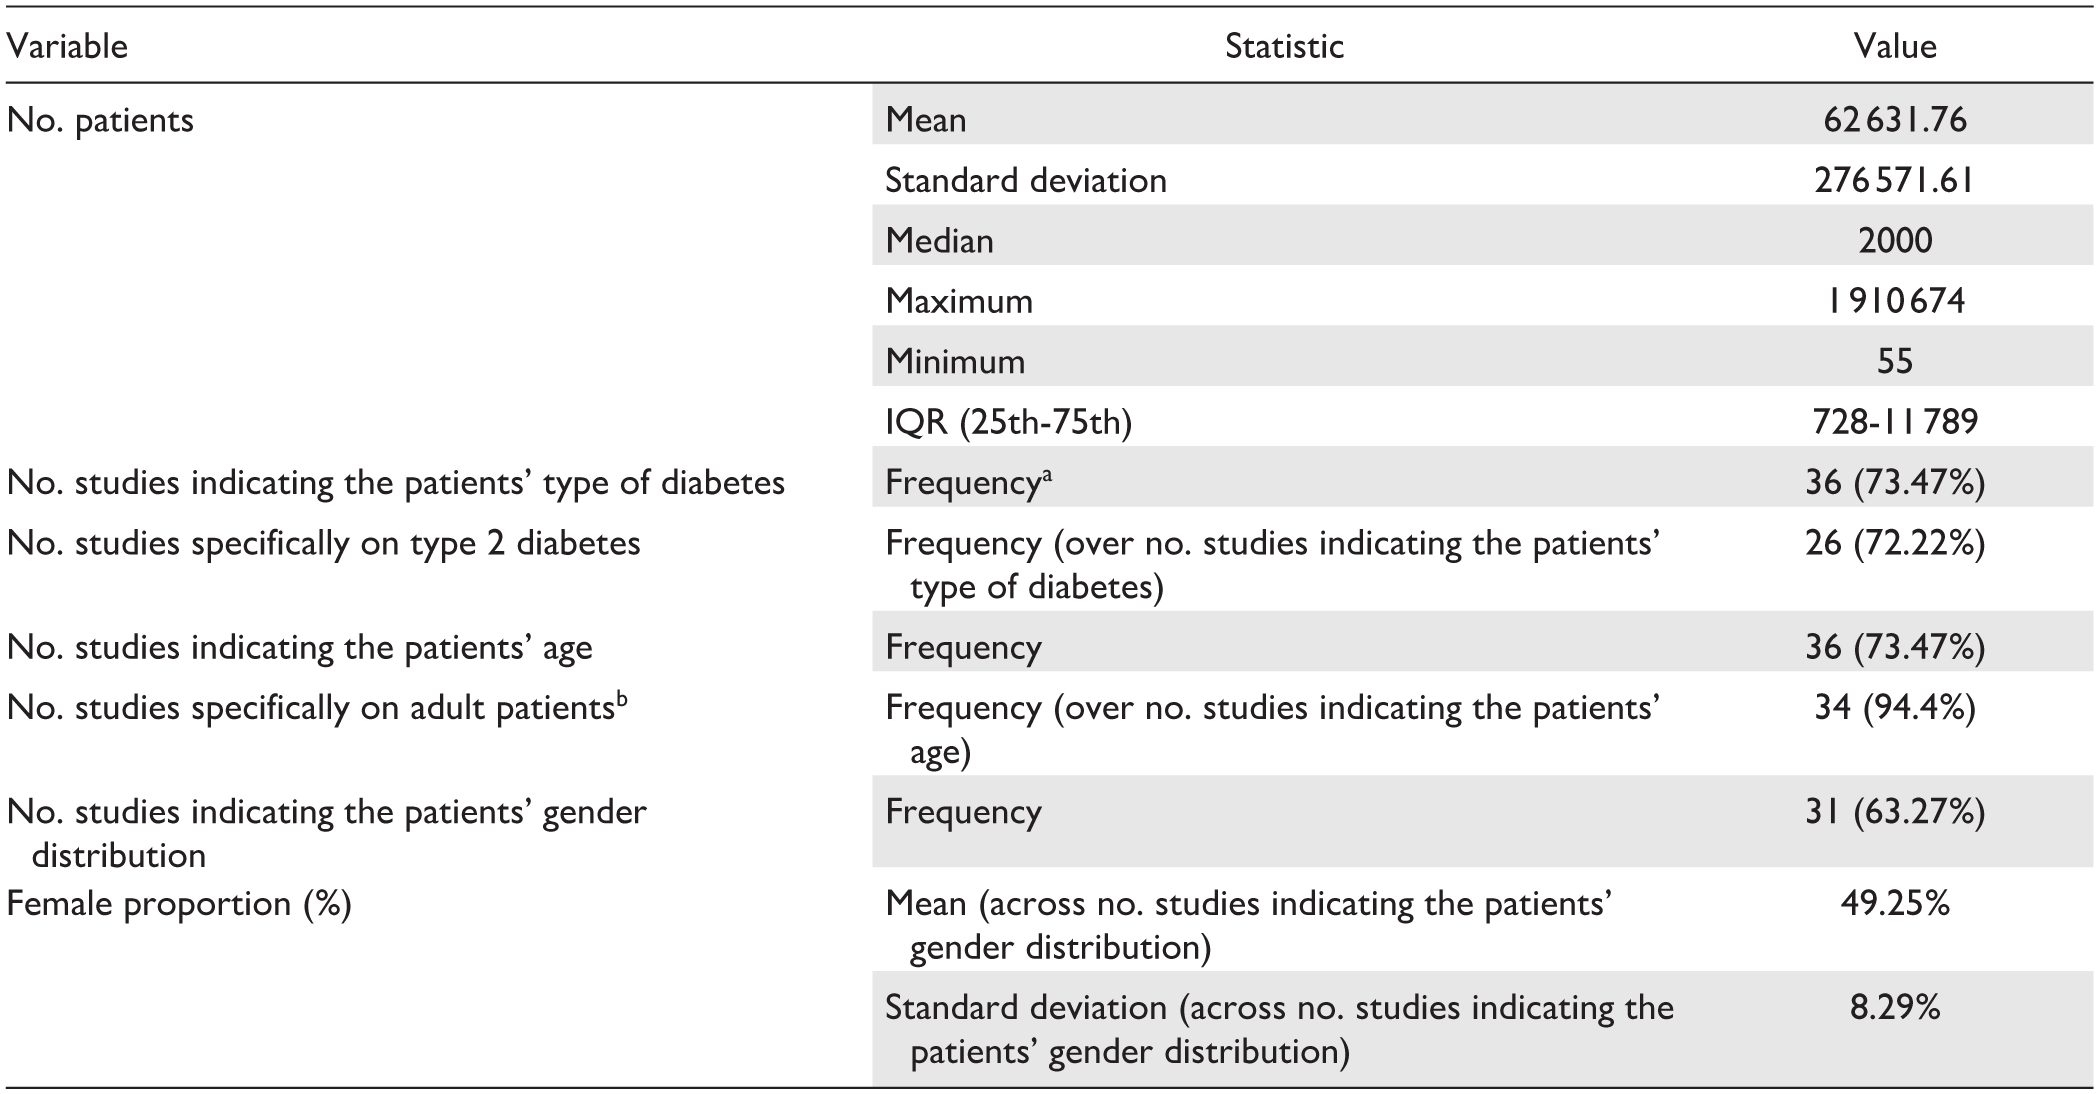
In general, we found that 26 studies (54% of those employing AI) developed only ML models, 4 (8%) only DL models, and 18 (38%) exploited both approaches. General statistics describing the number of AI models employed in studies are shown in Table 3. To evaluate the frequency of model usage, we grouped the ML and DL algorithms used in the studies into high-level categories, as presented in Table 4. Figure 4 shows the percentage frequency of each category, relative to the number of studies exploiting AI models (n = 48). The same information is reported for the specific AI models in Figure 5, considering only models that were used in at least two studies. The Ensemble Method category emerged as the most used, primarily due to the high frequency of the Random Forest (RF) model. Among studies where models’ implementation was performed (n = 47), 24 (51%) provided sufficient information to ensure reproducibility (hyperparameters’ values). Regarding the validation strategy chosen by the studies, we observed that 36 studies (73%) performed only an internal validation of the implemented approaches, 12 (24%) used an additional external validation data set to compare the performances achieved in the internal validation (exploiting both types of validation). As mentioned, the study conducted by Bora et al 40 presented the results of a pre-trained CNN model on another external data set, adopting only the external validation strategy.
Statistics Describing the Number of AI Models Employed in Studies.
ML and DL Categories Used to Group the AI Models Employed in Studies.
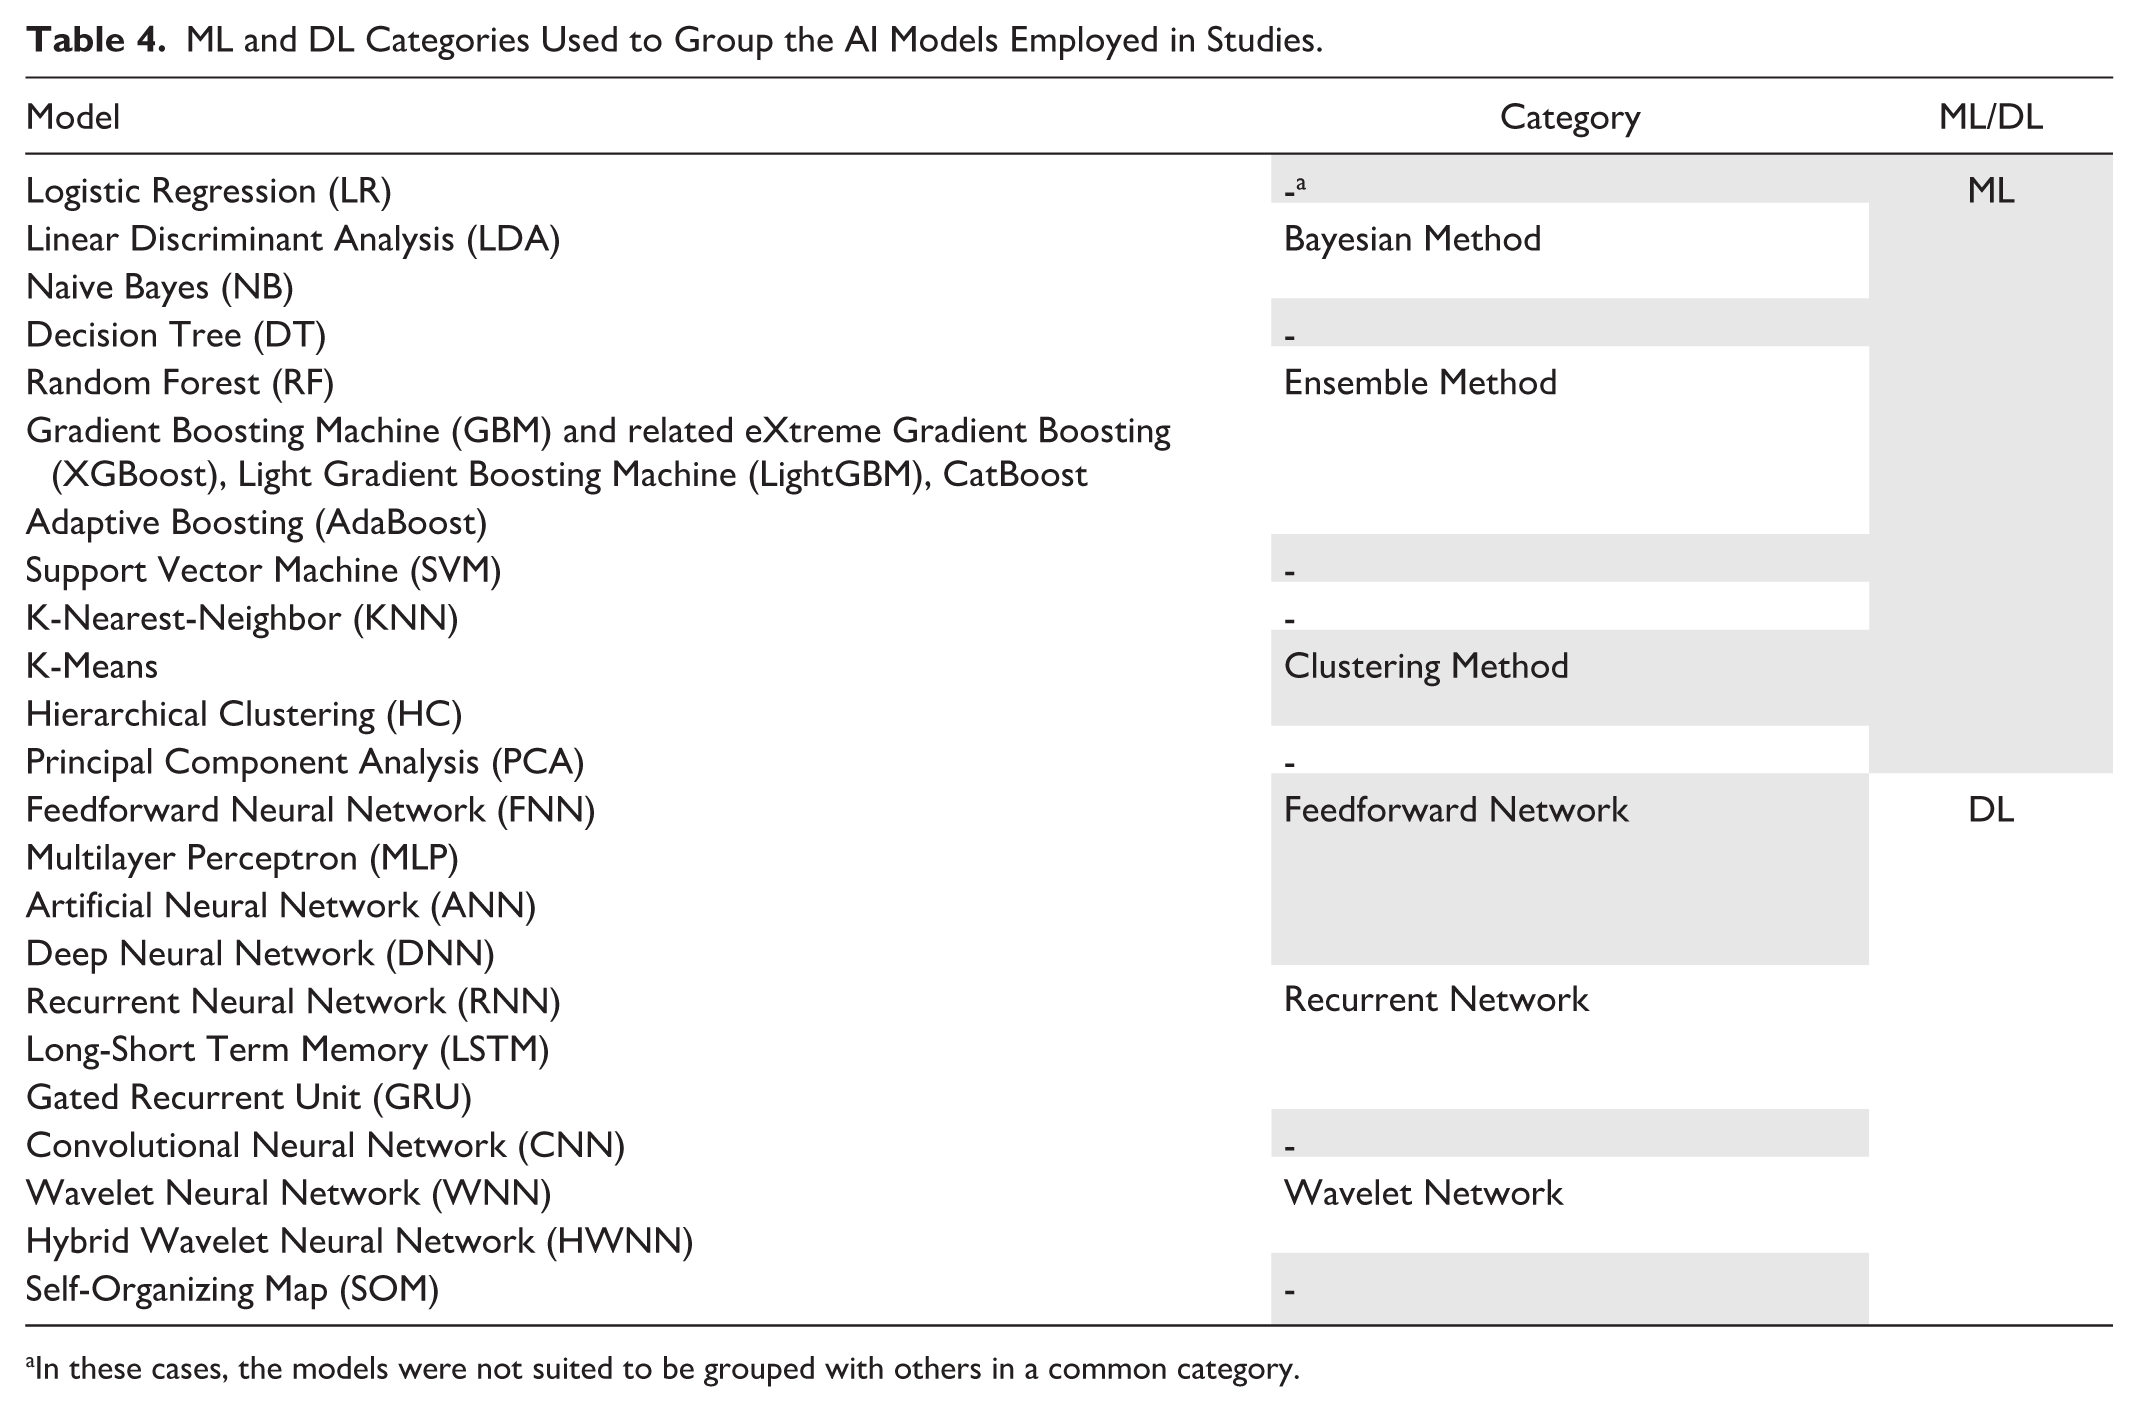
In these cases, the models were not suited to be grouped with others in a common category.
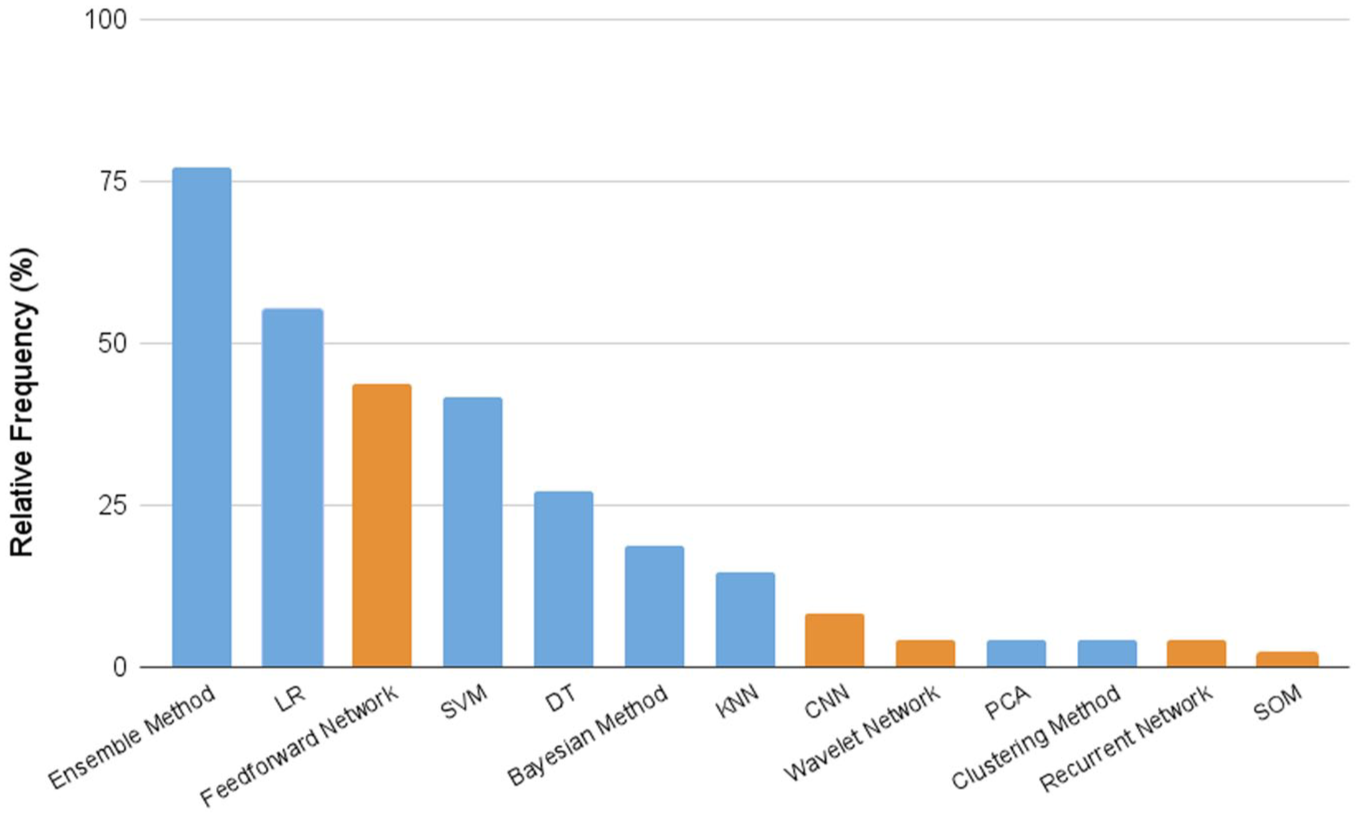
Percentage frequency of the defined ML and DL model categories over the number of studies exploiting AI methods (n = 48). Light blue bars refer to ML models; orange bars to DL models.
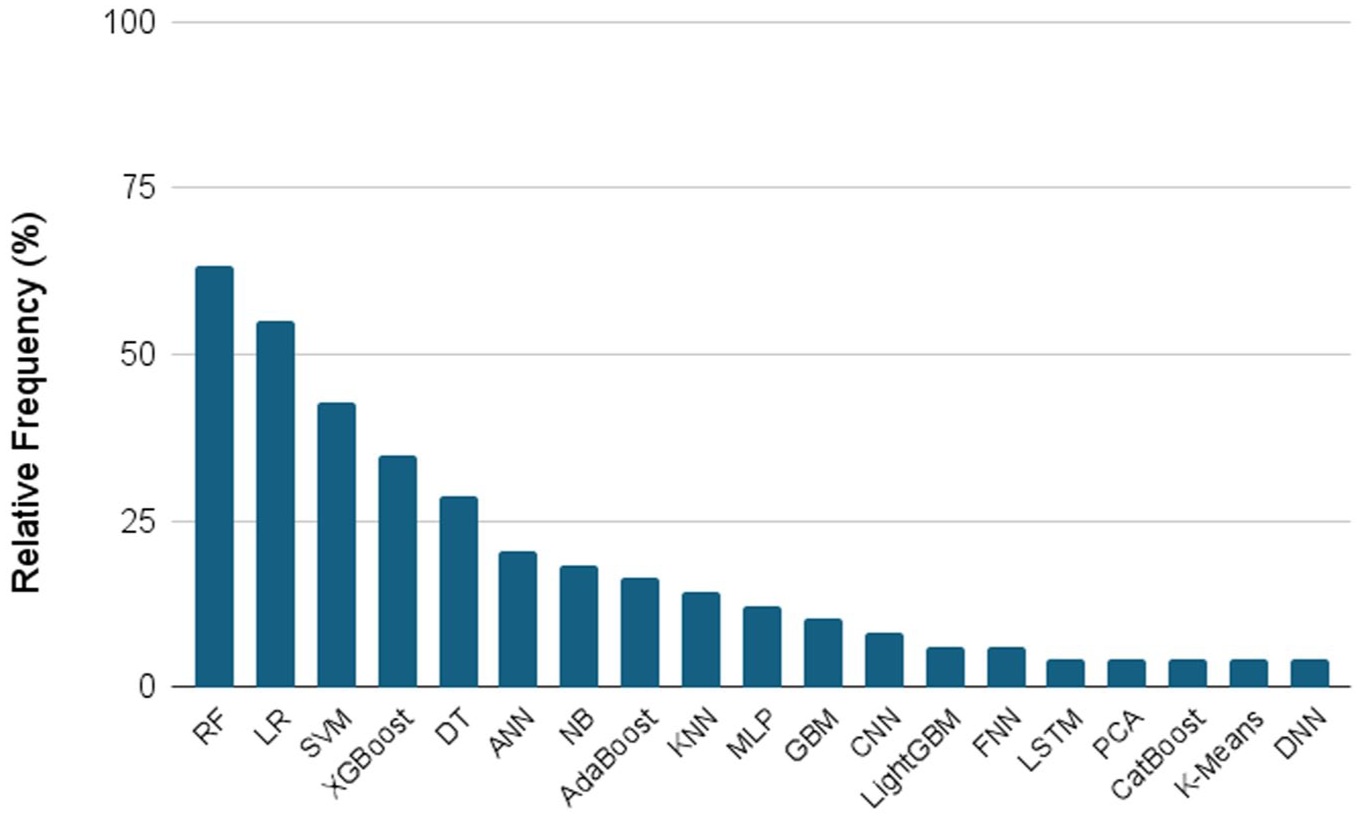
Percentage frequency of the specific AI models over the number of studies exploiting AI methods (n = 48). Only models employed in at least two studies are considered.
Predictor Variables
To identify potential patterns in predictors’ selection, we grouped the variables considered in the studies into ten categories (demographic data, basic clinical data, comorbidity, glucose measure, biochemical parameter, pharmacological data, international coding standard, omics data, imaging data, and signal). Moreover, we further grouped the studies as using structured or unstructured data based on the variables’ type. Imaging data and signal categories were classified as unstructured data, while the predictors included in all the other categories were classified as structured data. Some examples of predictors for each category are reported in Supplementary Table 3. Textual data, such as medical reports or clinical notes, were not explored in any of the studies. This finding aligns with the absence of Natural Language Processing (NLP) techniques or the use of LLMs. The heat map shown in Figure 6 provides an overview of the use of the different data categories for each of the complications predicted in the considered studies. The most used data categories included basic clinical information, demographic characteristics, and biochemical parameters, while omics data and unstructured data were rarely used. Specifically, we observed that only four studies (8%) exploited the predictors from the unstructured data type group.12,32,36,40
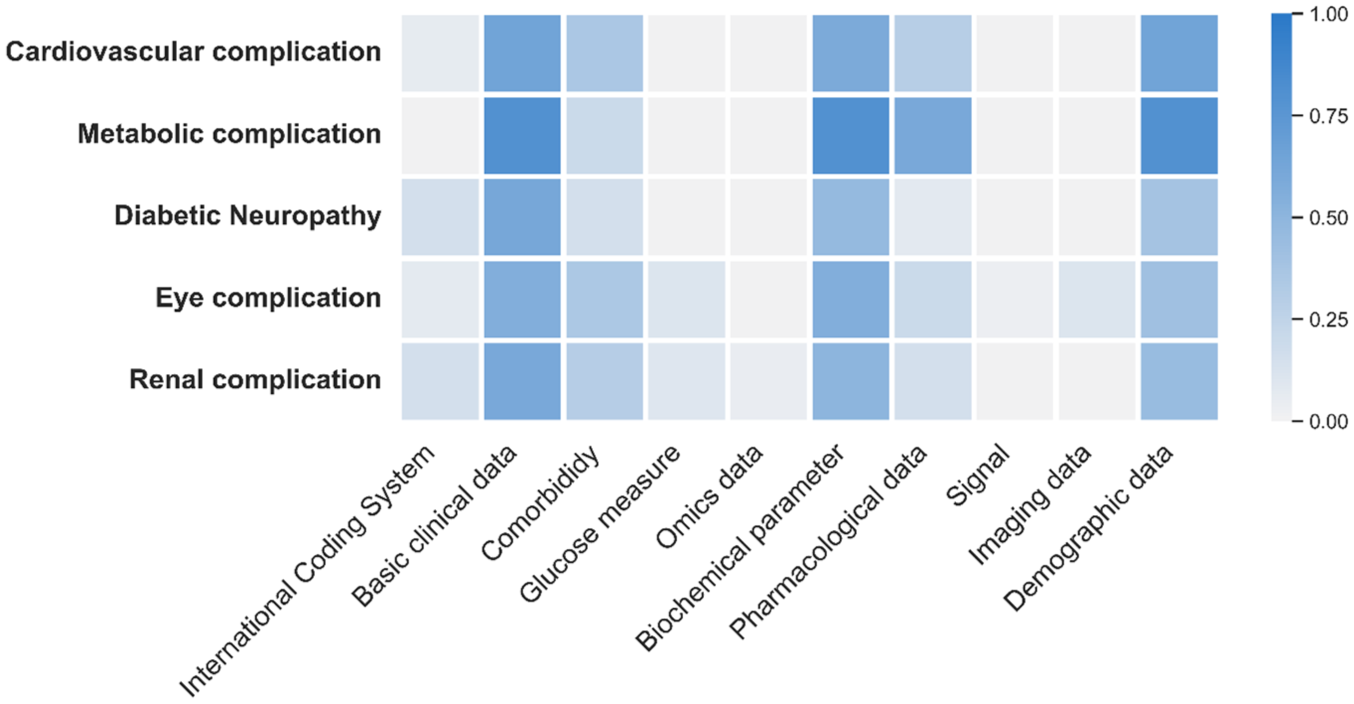
Heat map of the categories used to group the predictor variables (x-axis) employed in studies by complication category (y-axis). The color bar represents the relative frequency of predictors, ranging from 0 (indicating the predictor was never used) to 1 (indicating the predictor was used in all cases).
Evaluation Metrics
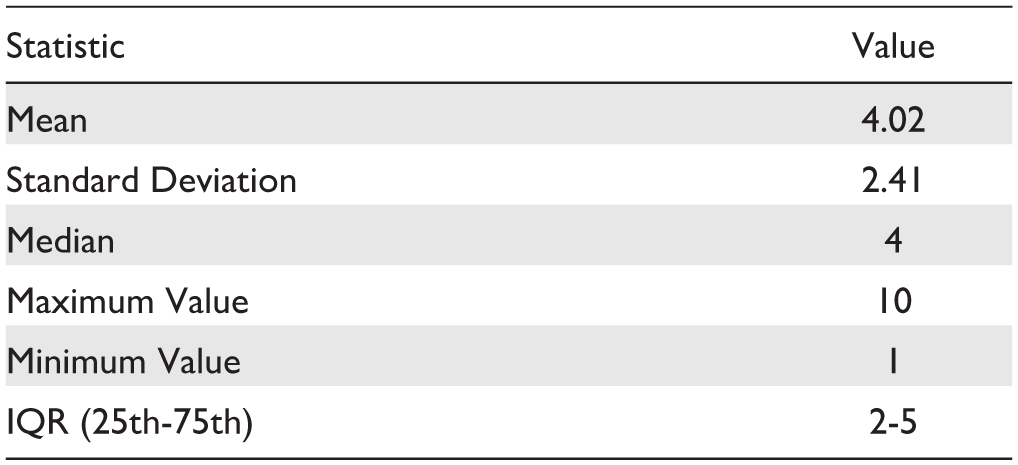
Descriptive statistics (mean, standard deviation, median, 25th and 75th percentiles) of the ROC AUC values reported in the studies as the best metric performance achieved by the AI models are shown in Table 5. We compared these results across the different categories of complications and the two validation strategies (internal and external). Concerning the external validation strategy, the mean and standard deviation values are shown only for Eye complication and Renal complication categories, as external validation results were available from only a single study for each of the remaining categories. We statistically investigated the difference in ROC AUC values between the two validation frameworks (internal and external) for Eye and Renal complication categories using the Mann-Whitney U test. The results (P-values) are shown in Table 5. This analysis generally demonstrated a good predictive ability of AI models, with a median ROC-AUC of 0.84 across all complication categories under internal validation. However, performance decreased in external validation, with 0.76 as the median ROC-AUC value, as confirmed by the overall test comparing ROC AUC values in internal and external evaluation without distinguishing the specific complication categories (P = .0039).
Mean, Standard Deviation, Median, 25th and 75th Percentiles of the Best ROC AUC Values Achieved by AI Models for Each Complication Category and Each Type of Validation Strategy (Internal or External).
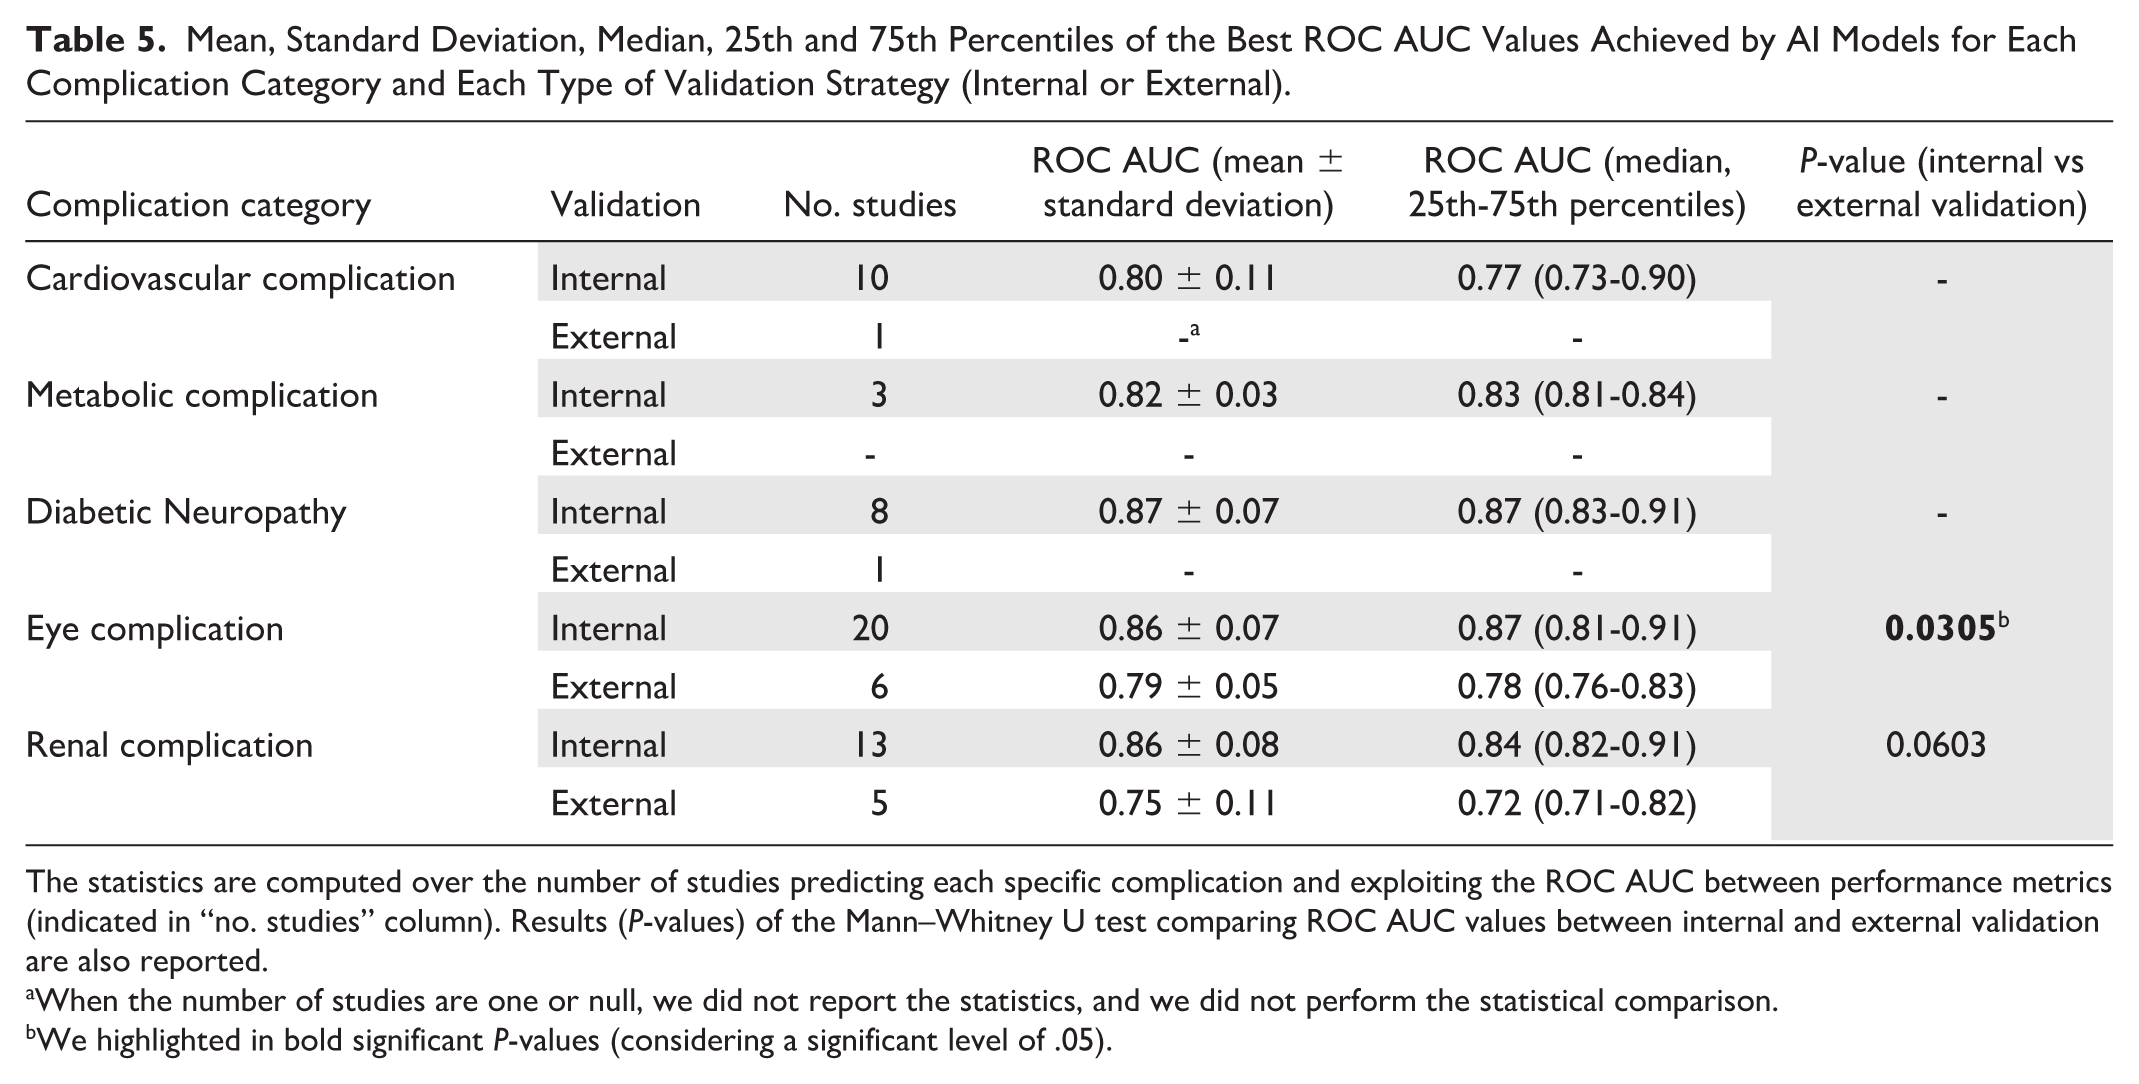
The statistics are computed over the number of studies predicting each specific complication and exploiting the ROC AUC between performance metrics (indicated in “no. studies” column). Results (P-values) of the Mann–Whitney U test comparing ROC AUC values between internal and external validation are also reported.
When the number of studies are one or null, we did not report the statistics, and we did not perform the statistical comparison.
We highlighted in bold significant P-values (considering a significant level of .05).
The comparison between AI models and traditional statistical approaches was possible only for two among the six studies employing both methodologies. Only Belur Nagaraj et al 29 and Aminian et al 52 provided AUC values achieved by Cox proportional hazards regression models. In both cases, AI models performed better.
Feature Importance
Twenty-six studies (53%) conducted a feature importance investigation, identifying the variables that most influenced the AI models in predicting complications. Figure 7 shows the eight variables most frequently included in the top-three predictors ranking, based on the feature importance investigations. These eight variables resulted in the first three positions of feature importance ranking in at least two studies. For each one, the relative percentage frequency can be observed. Age and glycated hemoglobin (HbA1c) emerged as the most important variables in almost 50% of studies conducting this type of investigation (n = 26).
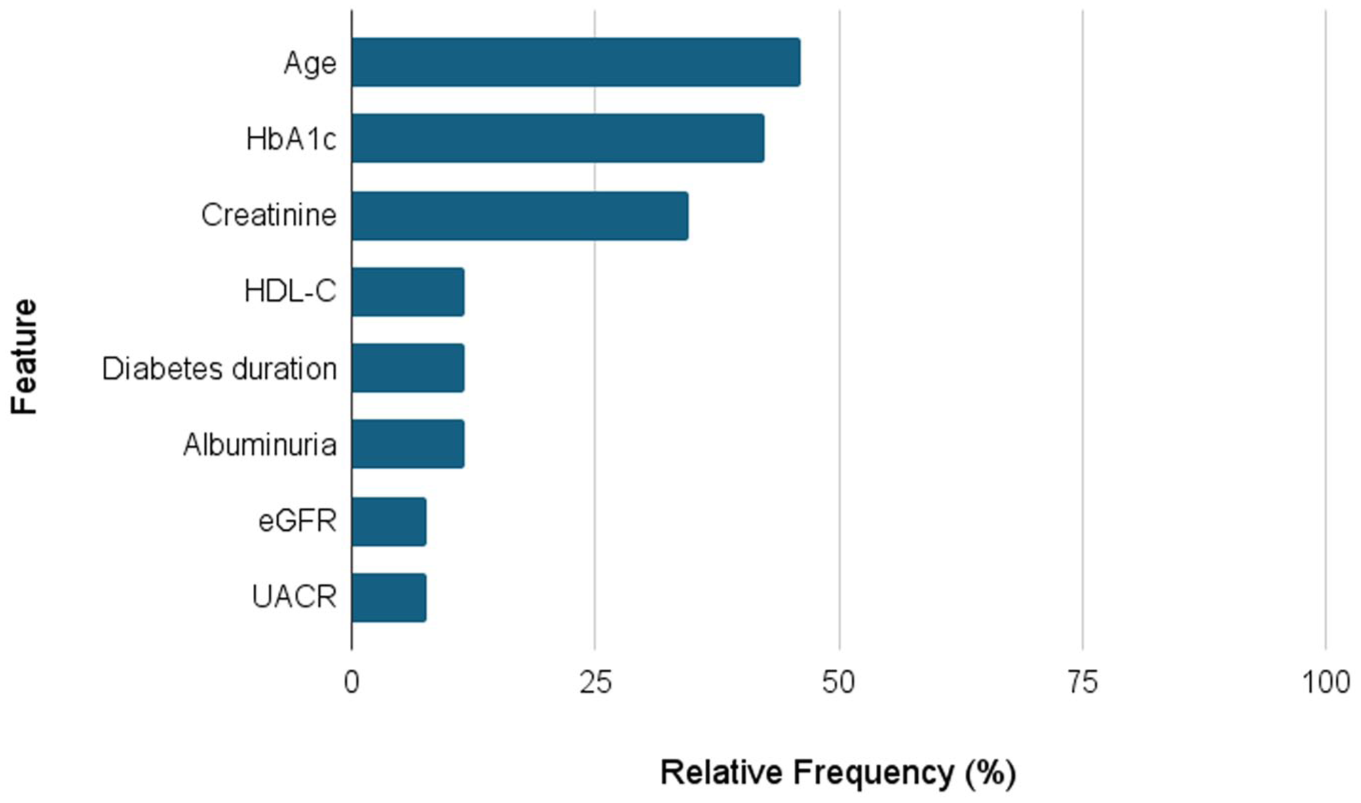
The percentage frequency of the eight variables identified in the top-three predictors ranking from the feature importance investigation in at least two studies. The percentage is computed based on the number of studies conducting this type of investigation (n = 26). HbA1c refers to the glycated hemoglobin, HDL-C to High-Density Lipoprotein Cholesterol, eGFR to estimated glomerular filtration rate, and UACR to urinary albumin-creatinine ratio.
Discussion
In this systematic review, we aimed to identify key methodological trends concerning the use of AI to predict diabetes complications and explore the use of recent technological innovations in this field. The 49 studies included in our analysis outlined a wide variety of conditions employed as prediction outcomes, demonstrating an established interest in applying these approaches to different disease domains. The five complication categories defined to group all the predicted conditions were well-represented in the studies, except for the Metabolic complication, which was much less investigated. The general good ROC-AUC performances reported by the studies confirm that these approaches can play an effective role in the early detection of dangerous diabetes progression. However, from a methodological perspective, several limitations can be identified in the current body of research on this topic. First, we need to consider that the reported results mostly refer to small samples of patients. Internal validation strategies, which were the most adopted, require splitting the data set into at least two subsets, ensuring that model validation is performed on a portion of data that is independent from the training set. This procedure impacts the sample size used for validation and reduces the robustness of the results and their generalizability. The lower performances observed in the external validations support this consideration. Moreover, despite the large number of ML and DL models experimented by the studies, the implemented pipelines appear highly consistent. This potentially stems from the almost exclusive use of structured data. Although the implemented approaches demonstrated the high capacity of AI models in handling different clinical and semantic domain data sets, their high potential for processing complex and unstructured data has yet to be fully exploited. Among the included studies, only a small subset developed or applied models for image and signal processing. Moreover, no study investigated the use of textual data, which still represents a relevant source of clinical information. In this context, NLP strategies and LLMs, which did not emerge in the proposed methodologies, could introduce a novel methodological perspective. These considerations underscore that, despite the rich existing literature in this field, several future directions remain to be explored to fully unlock the potential of AI models. A notable need is to leverage data sources that remain underutilized due to their unstructured nature. In this regard, foundation models present a promising solution, as they can be applied without the extensive, task-specific training that typically relies on large, labeled data sets.
Another important consideration regarding the analyzed studies concerns the limited attention given to the practical application of the models in clinical settings. Studies tended to focus primarily on technical development, often neglecting how the proposed models could be used in real-world practice. The lack of focus on clinical impact is further reflected in the absence of evaluations regarding model reliability and trustworthiness. Demonstrating the actual utility of AI models to support their integration into real-world clinical workflows requires these targeted evaluations, together with transparent reporting of models’ hyperparameters (provided in only 51% of studies), accessible data, and systematic use of high-dimensional and unstructured sources.
Supplemental Material
sj-docx-1-dst-10.1177_19322968251384314 – Supplemental material for Artificial Intelligence for Diabetes Complication Prediction: A Systematic Review of Current Applications and Future Directions
Supplemental material, sj-docx-1-dst-10.1177_19322968251384314 for Artificial Intelligence for Diabetes Complication Prediction: A Systematic Review of Current Applications and Future Directions by Francesca Pescol, Pietro Bosoni, Stefania Ghilotti, Pasquale De Cata, Lucia Sacchi and Riccardo Bellazzi in Journal of Diabetes Science and Technology
Footnotes
Abbreviations
AdaBoost, adaptive boosting; AI, artificial intelligence; ANN, artificial neural network; CNN, convolutional neural network; DL, deep learning; DNN, deep neural network; DT, decision tree; eGFR, estimated glomerular filtration rate; FNN, feedforward neural network; GBM, gradient boosting machine; GRU, gated recurrent unit; HbA1c, glycated hemoglobin; HC, hierarchical clustering; HDL-C, high-density lipoprotein cholesterol; HWNN, hybrid wavelet neural network; IQR, interquartile range; KNN, K-nearest-neighbor; LDA, linear discriminant analysis; LightGBM, light gradient boosting machine; LLMs, large language models; LR, logistic regression; LSTM, long-short term memory; ML, machine learning; MLP, multilayer perceptron; NB, Naïve Bayes; NLP, natural language processing; PCA, principal component analysis; RF, random forest; RNN, recurrent neural network; ROC AUC, receiver operating characteristic area under the curve; SOM, self-organizing map; SVM, support vector machine; UACR, urinary albumin-creatinine ratio; WNN, wavelet neural network; XGBoost, eXtreme gradient boosting.
Declaration of Conflicting Interests
The authors declared no potential conflicts of interest with respect to the research, authorship, and/or publication of this article.
Funding
The authors disclosed receipt of the following financial support for the research, authorship, and/or publication of this article: Authors acknowledge funding support provided by the Italian project PRIN “Using AI-based technologies to improve the clinical trial process.” CUP: J53D23012470008 funded by the European Union—Next Generation EU.
Supplemental Material
Supplemental material for this article is available online.
References
Supplementary Material
Please find the following supplemental material available below.
For Open Access articles published under a Creative Commons License, all supplemental material carries the same license as the article it is associated with.
For non-Open Access articles published, all supplemental material carries a non-exclusive license, and permission requests for re-use of supplemental material or any part of supplemental material shall be sent directly to the copyright owner as specified in the copyright notice associated with the article.