
Abstract
Importance and Aims:
Diabetic microvascular complications significantly impact morbidity and mortality. This review focuses on machine learning/artificial intelligence (ML/AI) in predicting diabetic retinopathy (DR), diabetic kidney disease (DKD), and diabetic neuropathy (DN).
Methods:
A comprehensive PubMed search from 1990 to 2023 identified studies on ML/AI models for diabetic microvascular complications. The review analyzed study design, cohorts, predictors, ML techniques, prediction horizon, and performance metrics.
Results:
Among the 74 identified studies, 256 featured internally validated ML models and 124 had externally validated models, with about half being retrospective. Since 2010, there has been a rise in the use of ML for predicting microvascular complications, mainly driven by DKD research across 27 countries. A more modest increase in ML research on DR and DN was observed, with publications from fewer countries. For all microvascular complications, predictive models achieved a mean (standard deviation) c-statistic of 0.79 (0.09) on internal validation and 0.72 (0.12) on external validation. Diabetic kidney disease models had the highest discrimination, with c-statistics of 0.81 (0.09) on internal validation and 0.74 (0.13) on external validation, respectively. Few studies externally validated prediction of DN. The prediction horizon, outcome definitions, number and type of predictors, and ML technique significantly influenced model performance.
Conclusions and Relevance:
There is growing global interest in using ML for predicting diabetic microvascular complications. Research on DKD is the most advanced in terms of publication volume and overall prediction performance. Both DR and DN require more research. External validation and adherence to recommended guidelines are crucial.
Introduction
Diabetes, particularly when accompanied by conditions such as hypertension and hyperlipidemia, increases the risk of the microvascular complications of diabetic retinopathy (DR), diabetic kidney disease (DKD), and diabetic neuropathy (DN). These complications are major contributors to the morbidity and mortality associated with diabetes, leading to severe outcomes such as amputations, end-stage renal disease (ESRD), and vision loss.1,2 Given the significant clinical and economic impact of these conditions, the development and utilization of predictive models, particularly those leveraging machine learning and artificial intelligence (ML/AI), have become crucial. These models are instrumental in healthcare for several reasons: They predict disease progression allowing for earlier interventions, enable personalized treatment strategies, and assist in judicious resource allocation. 3 ML/AI models, by analyzing extensive electronic health record (EHR) data, can identify complex patterns more effectively than traditional methods, offering rapid and insightful disease predictions. 3
Our study addresses a gap in current research of ML/AI prediction models, which often isolates specific microvascular complications or lacks in-depth evaluation of high-performing model features.4,5 We present a comprehensive review that encompasses all three major complications (DR, DKD, and DN), focusing on patients with type 2 diabetes (T2D), where multiple risk factors play a significant role in complication development. This review aims to (1) summarize current research on ML models for predicting microvascular complications, (2) compare and contrast various ML approaches, and (3) highlight features of ML models that offer the highest predictive value. This approach not only provides a comparative analysis of ML algorithms across different complications but also deepens our understanding of the factors that may enhance the predictive utility of ML/AI models.
Methods
Study Design and Article Selection
We conducted a literature search on PubMed using the following MeSH terms: “Machine Learning/Artificial intelligence” AND (“diabetic retinopathy” OR “diabetic neuropathy” OR “diabetic nephropathy” OR “diabetic foot”). Details of our search strategy are in the Supplemental Document. We selected articles meeting eligibility criteria published from January 1990 to July 2023. We adhered to the SANRA scale in both the study design and the reporting of results. 6
Eligibility Criteria
We included longitudinal studies, such as randomized controlled trials, prospective or retrospective cohort studies, and registries, evaluating ML models for predicting microvascular complications (DR, DKD, and DN). As our focus was on predicting the onset of microvascular complications, we excluded studies centered on microvascular complication detection (ie, cross-sectional analysis) and image-based screening (eg, AI-based retinal detection). We also excluded case-control and genetic studies. We included studies with unspecified diabetes types, assuming a majority had T2D; however, we excluded those solely involving type 1 or gestational diabetes patients. We aimed to review and evaluate prediction models for microvascular complications in ambulatory settings, and therefore, excluded studies on short-term outcomes during hospitalization, such as imminent amputations in diabetic foot ulcer patients. We excluded studies lacking predictive performance measures such as c-statistic, accuracy, or positive predictive values (PPVs)/negative predictive values (NPVs). We included meta-analyses that provided external validation and assisted in cross-referencing to identify additional eligible studies.
Data Extraction
For eligible studies, we collected details such as author, country, publication year, design, and type of microvascular complication(s). We also noted each model’s validation method (internal/external), cohort sizes, cohort descriptions, predictor variables, the ML algorithm used, prediction horizon, and performance measures, including c-statistic, accuracy, PPV, NPV, positive likelihood ratio (PLR), negative likelihood ratio (NLR), and the F1-Score. As most evaluated studies tended to report c-statistics and omitted other measures of model performance, we focused the analysis on that metric. When the prediction horizon was not explicitly stated, we extracted the mean or median follow-up time reported in the study. Internal validation was defined as both development and validation within the same cohort, while external validation involved a distinct cohort from a different institution, population, or country. Studies using temporal validation (ie, evaluating individuals from the same cohort but in a different time frame) were categorized as internal validation, regardless of how the studies labeled them. 7
The methods for internal validation were classified into one or more of the following: split-sample (hold-out method), bootstrapping (bagging), cross-validation (k-fold, nested), temporal validation, or not specified. We categorized ML/AI algorithms as linear regression (LinReg), including generalized additive models; logistic regression (LogReg), including multinomial logistic regression; tree-based methods (Random Forest [RF], Decision Trees [DT], Gradient Boosting Machines [GBM], XGBoost, LightGBM); Support Vector Machines (SVM); K-Nearest Neighbors (K-NN); Neural Networks (NN); ensemble methods (ie, AdaBoost); Survival Analysis (SA), including Cox, accelerated failure, competing risk, Fine and Gray, and Weibull models; and probabilistic models (Naïve Bayes [NB] and Markov Models). We collected and managed study data using REDCap electronic data capture tools hosted by Johns Hopkins University.8,9
Predictor Variables
When studies reported results from several ML models using clinically available predictors, we extracted data from all these models. For studies evaluating novel biomarkers alongside clinically available predictors, we focused only on the most fully adjusted models. We extracted predictor variables as specified in the studies, either as exact variables (eg, A1C, blood pressure) or broad categories (eg, diagnoses, labs, medications). We reclassified variables representing similar concepts for analysis (eg, weight and waist circumference), as detailed in Supplemental Table 9.
Outcome Definition
We collected information on the precise outcomes used to define each microvascular complication. Diabetic retinopathy was defined by one or more of the following: retinopathy detected via dilated fundoscopy, blindness, vitrectomy, retinal photocoagulation, and others (typically a diagnostic code for retinopathy). Diabetic kidney disease definitions included microalbuminuria, macroalbuminuria, albuminuria not otherwise specified (NOS), chronic kidney disease (CKD) diagnosis, CKD progression markers (serum creatinine doubling, estimated glomerular filtration rate [eGFR] drop, CKD stage decline), ESRD (dialysis or renal therapy), and renal disease-related death. Diabetic neuropathy was defined through the Michigan Neuropathy Screening Instrument Score (NSIS), physical examination findings (such as vibratory sensory loss, absent ankle jerk reflex, loss of protective sensation), electromyography/nerve conduction studies (EMG/NCS) results, lower extremity amputation, or neuropathy diagnostic codes. Many ML models used a composite of these individual outcomes.
Statistical Analysis
Data normality was assessed using skewness and kurtosis tests. Non-normally distributed data were summarized with medians and interquartile ranges, while normally distributed data were reported using means and standard deviations. For each ML algorithm, we calculated the mean, minimum, and maximum c-statistic across model types and microvascular outcomes. Analyses were conducted separately for internal and external validation results, with subgroup analyses focusing on individual outcome definitions, the number of predictor variables, and prediction horizons. Statistical analyses were performed using STATA (Release 18), RStudio (2020), and Python.
Results
We identified 74 studies that met our eligibility criteria. Of these, 66 studies presented the original version of the ML model,10-75 and an additional eight studies externally validated these models.76-83 This yielded results for 256 and 124 internally and externally validated ML models, respectively. Study designs, outcomes, and countries of origin are detailed in Supplemental Table 1, with ML model details in Supplemental Tables 2 to 7. The most common study designs were retrospective cohorts (49.2%), prospective cohorts (28.4%), randomized controlled trials (13.4%), and registries (9.0%). The frequency of study types by microvascular complication is shown in Supplemental Figure 3, and the individual and composite outcome definitions used in the ML models are in Supplemental Figures 5 and 6.
Global Trends in ML Prediction Models for Microvascular Complications
Figure 1 shows an increasing trend in using ML-based models for predicting microvascular complications, with a notable surge in DKD studies since 2010. This rise aligns with the general growth in ML applications in endocrinology. 84 While AI-based retinal image detection using ML has grown significantly, the trend for ML-based predictions of incident retinopathy and neuropathy has been stable.
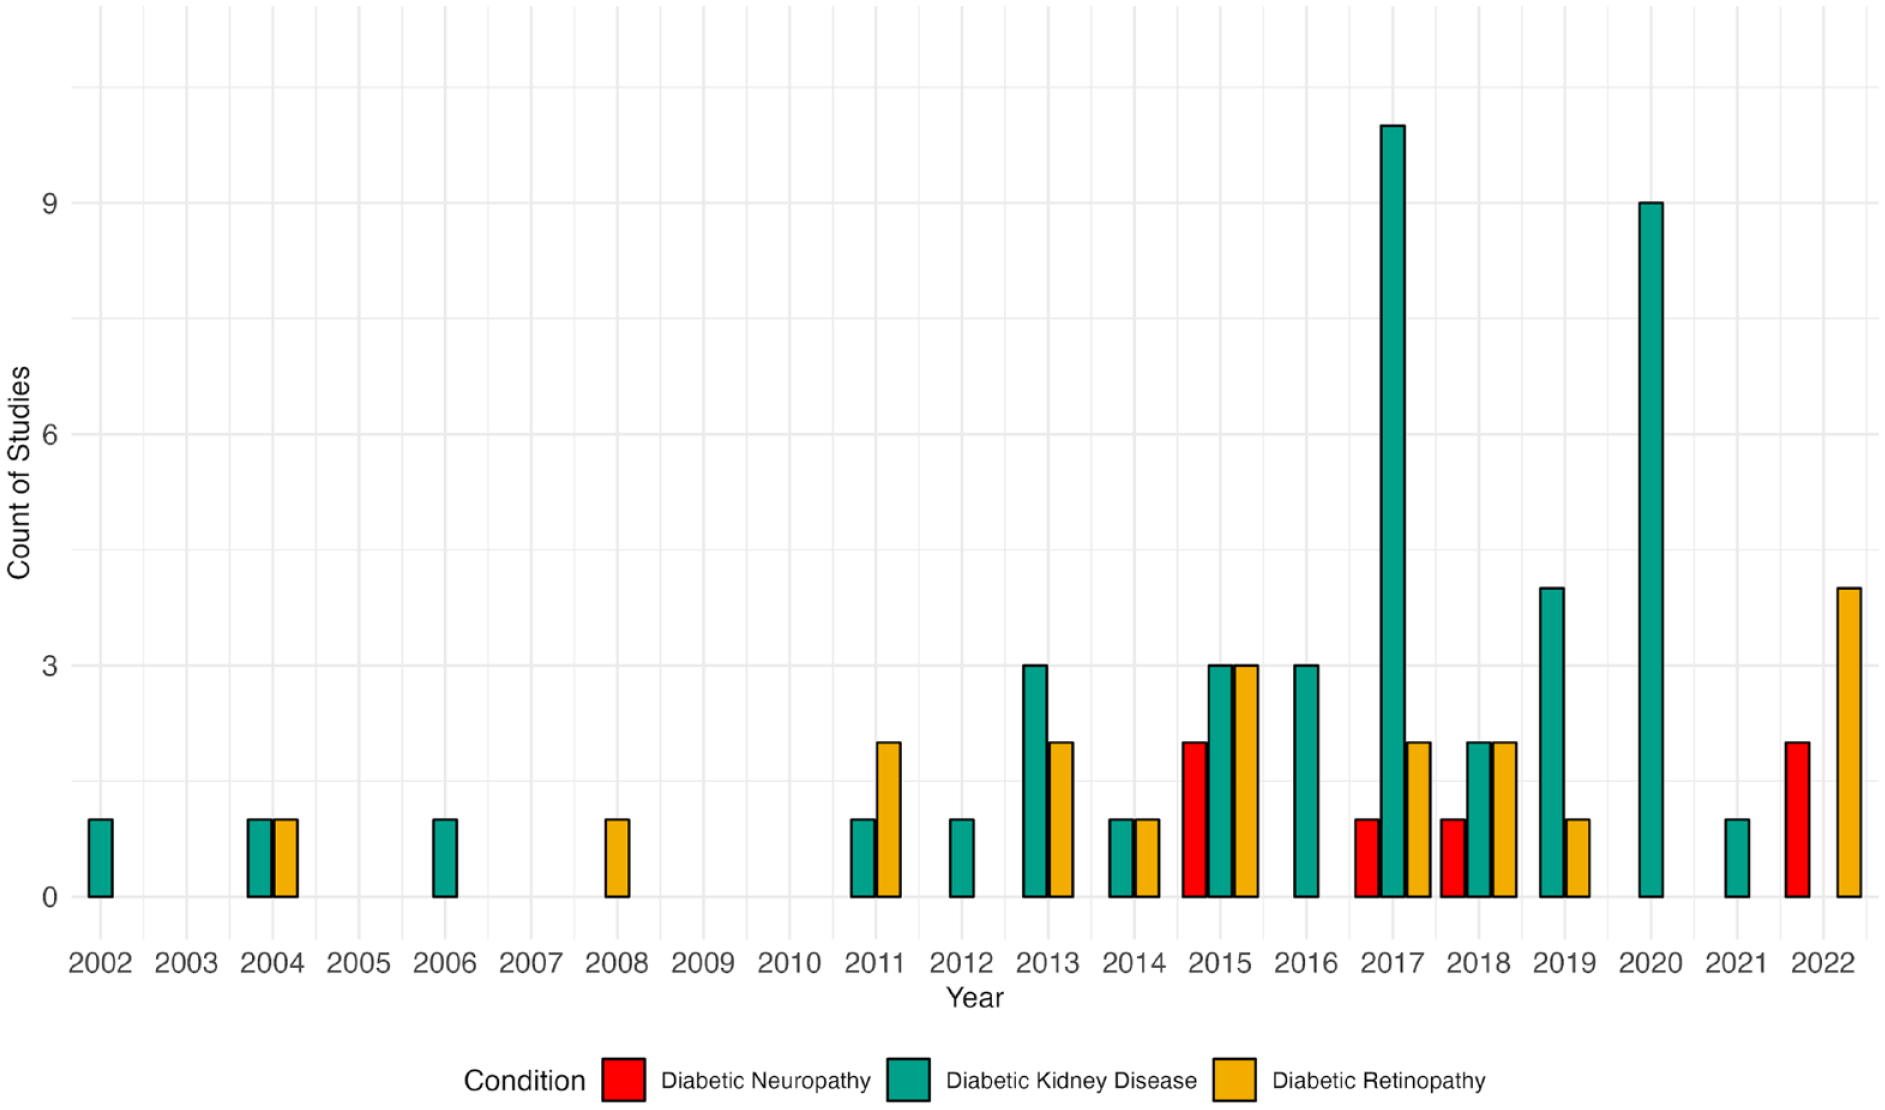
Trend in publications of machine learning models by microvascular complications from 2002 to 2023. Symbols indicate the number of publications per year for diabetic retinopathy, diabetic kidney disease, and diabetic neuropathy. For 2023, the number of publications corresponds to the first seven months of the year.
Publications on ML models for predicting microvascular complications show global involvement, with 31 countries represented in the studies (Figure 2). The total numbers of contributing countries for DR, DKD, and DN are 16, 27, and 6, respectively. The United Kingdom leads in DR research with 41.3% of publications, followed by the United States (15.3%) and Italy (15.0%). The DKD research landscape is more varied, with the United States (18.3%) and China (17.7%) leading, followed by Australia, the United Kingdom, Japan, and Taiwan. Diabetic neuropathy research is dominated by Italy, the United States, and the United Kingdom, contributing over 80% of publications.
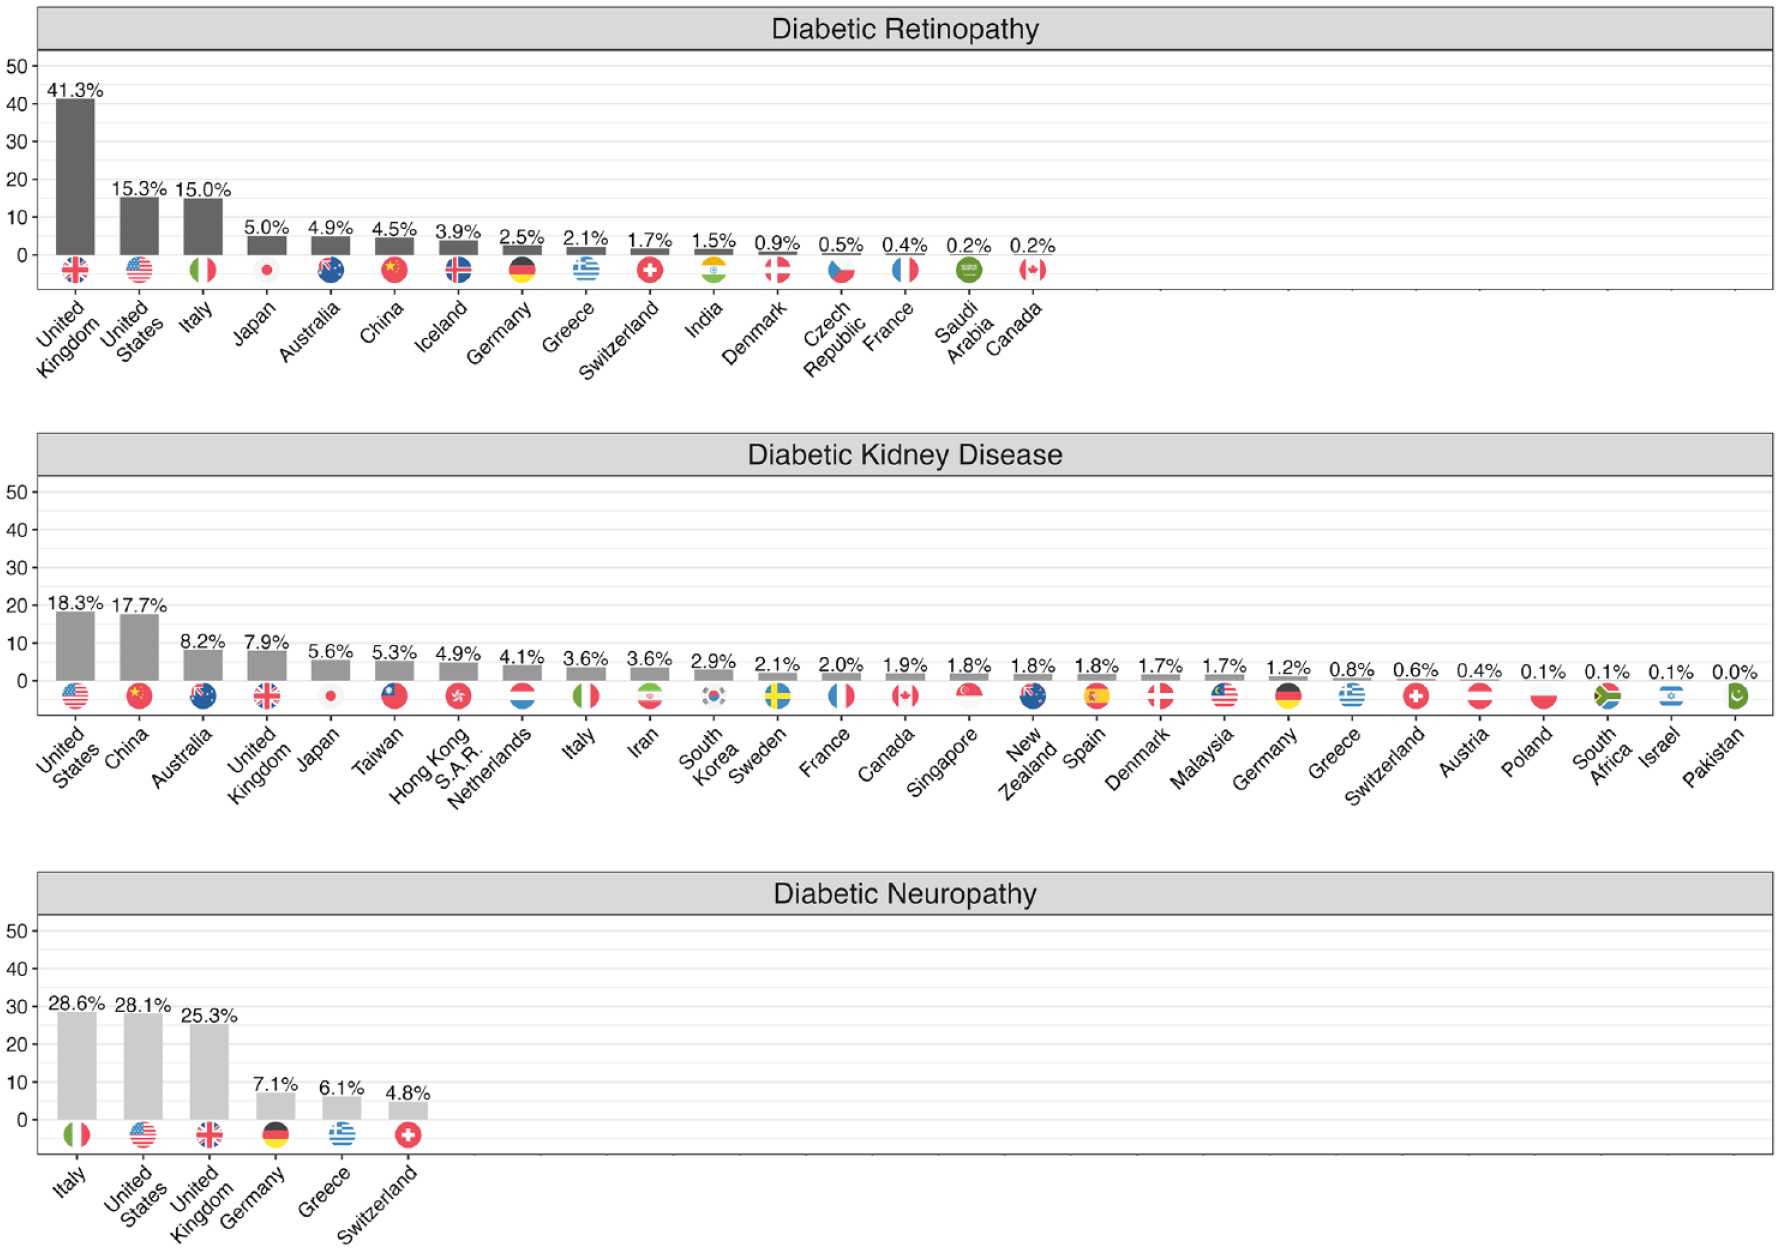
Country of affiliation for study authors by microvascular complication. Results reflect the proportion of studies reporting on the outcomes of diabetic retinopathy, diabetic kidney disease, and diabetic neuropathy. The data utilized for generating this visualization were acquired from PubMed and PubMed Central. We employed a combination of manual curation and the application of text mining functions that were developed using R software version 4.1.2. To arrive at the ultimate proportions of ancestries, we calculated them individually for each distinct study and subsequently aggregated them.
Model Characteristics and Predictive Performance
Table 1 summarizes the key findings of the ML models. Of the included studies, 256 models underwent internal validation, and 124 had external validation. The c-statistic was the main performance metric, reported for 47 DR, 181 DKD, and 28 DN models in internal validation, and for 39 DR, 81 DKD, and four DN models in external validation. For internal validation, 19.1% of DR, 41.9% of DKD, and 23.6% of DN models omitted the 95% confidence interval; for external validation, the absence of 95% confidence interval (CI) was less frequent, missing in 10.3% of DR, 17.2% of DKD, and none of the DN models. In addition, some studies mislabeled internal validation as external validation. Validation methods are detailed in Supplemental Figure 4.
Summary of Key Findings of Machine Learning Models by Microvascular Complication.
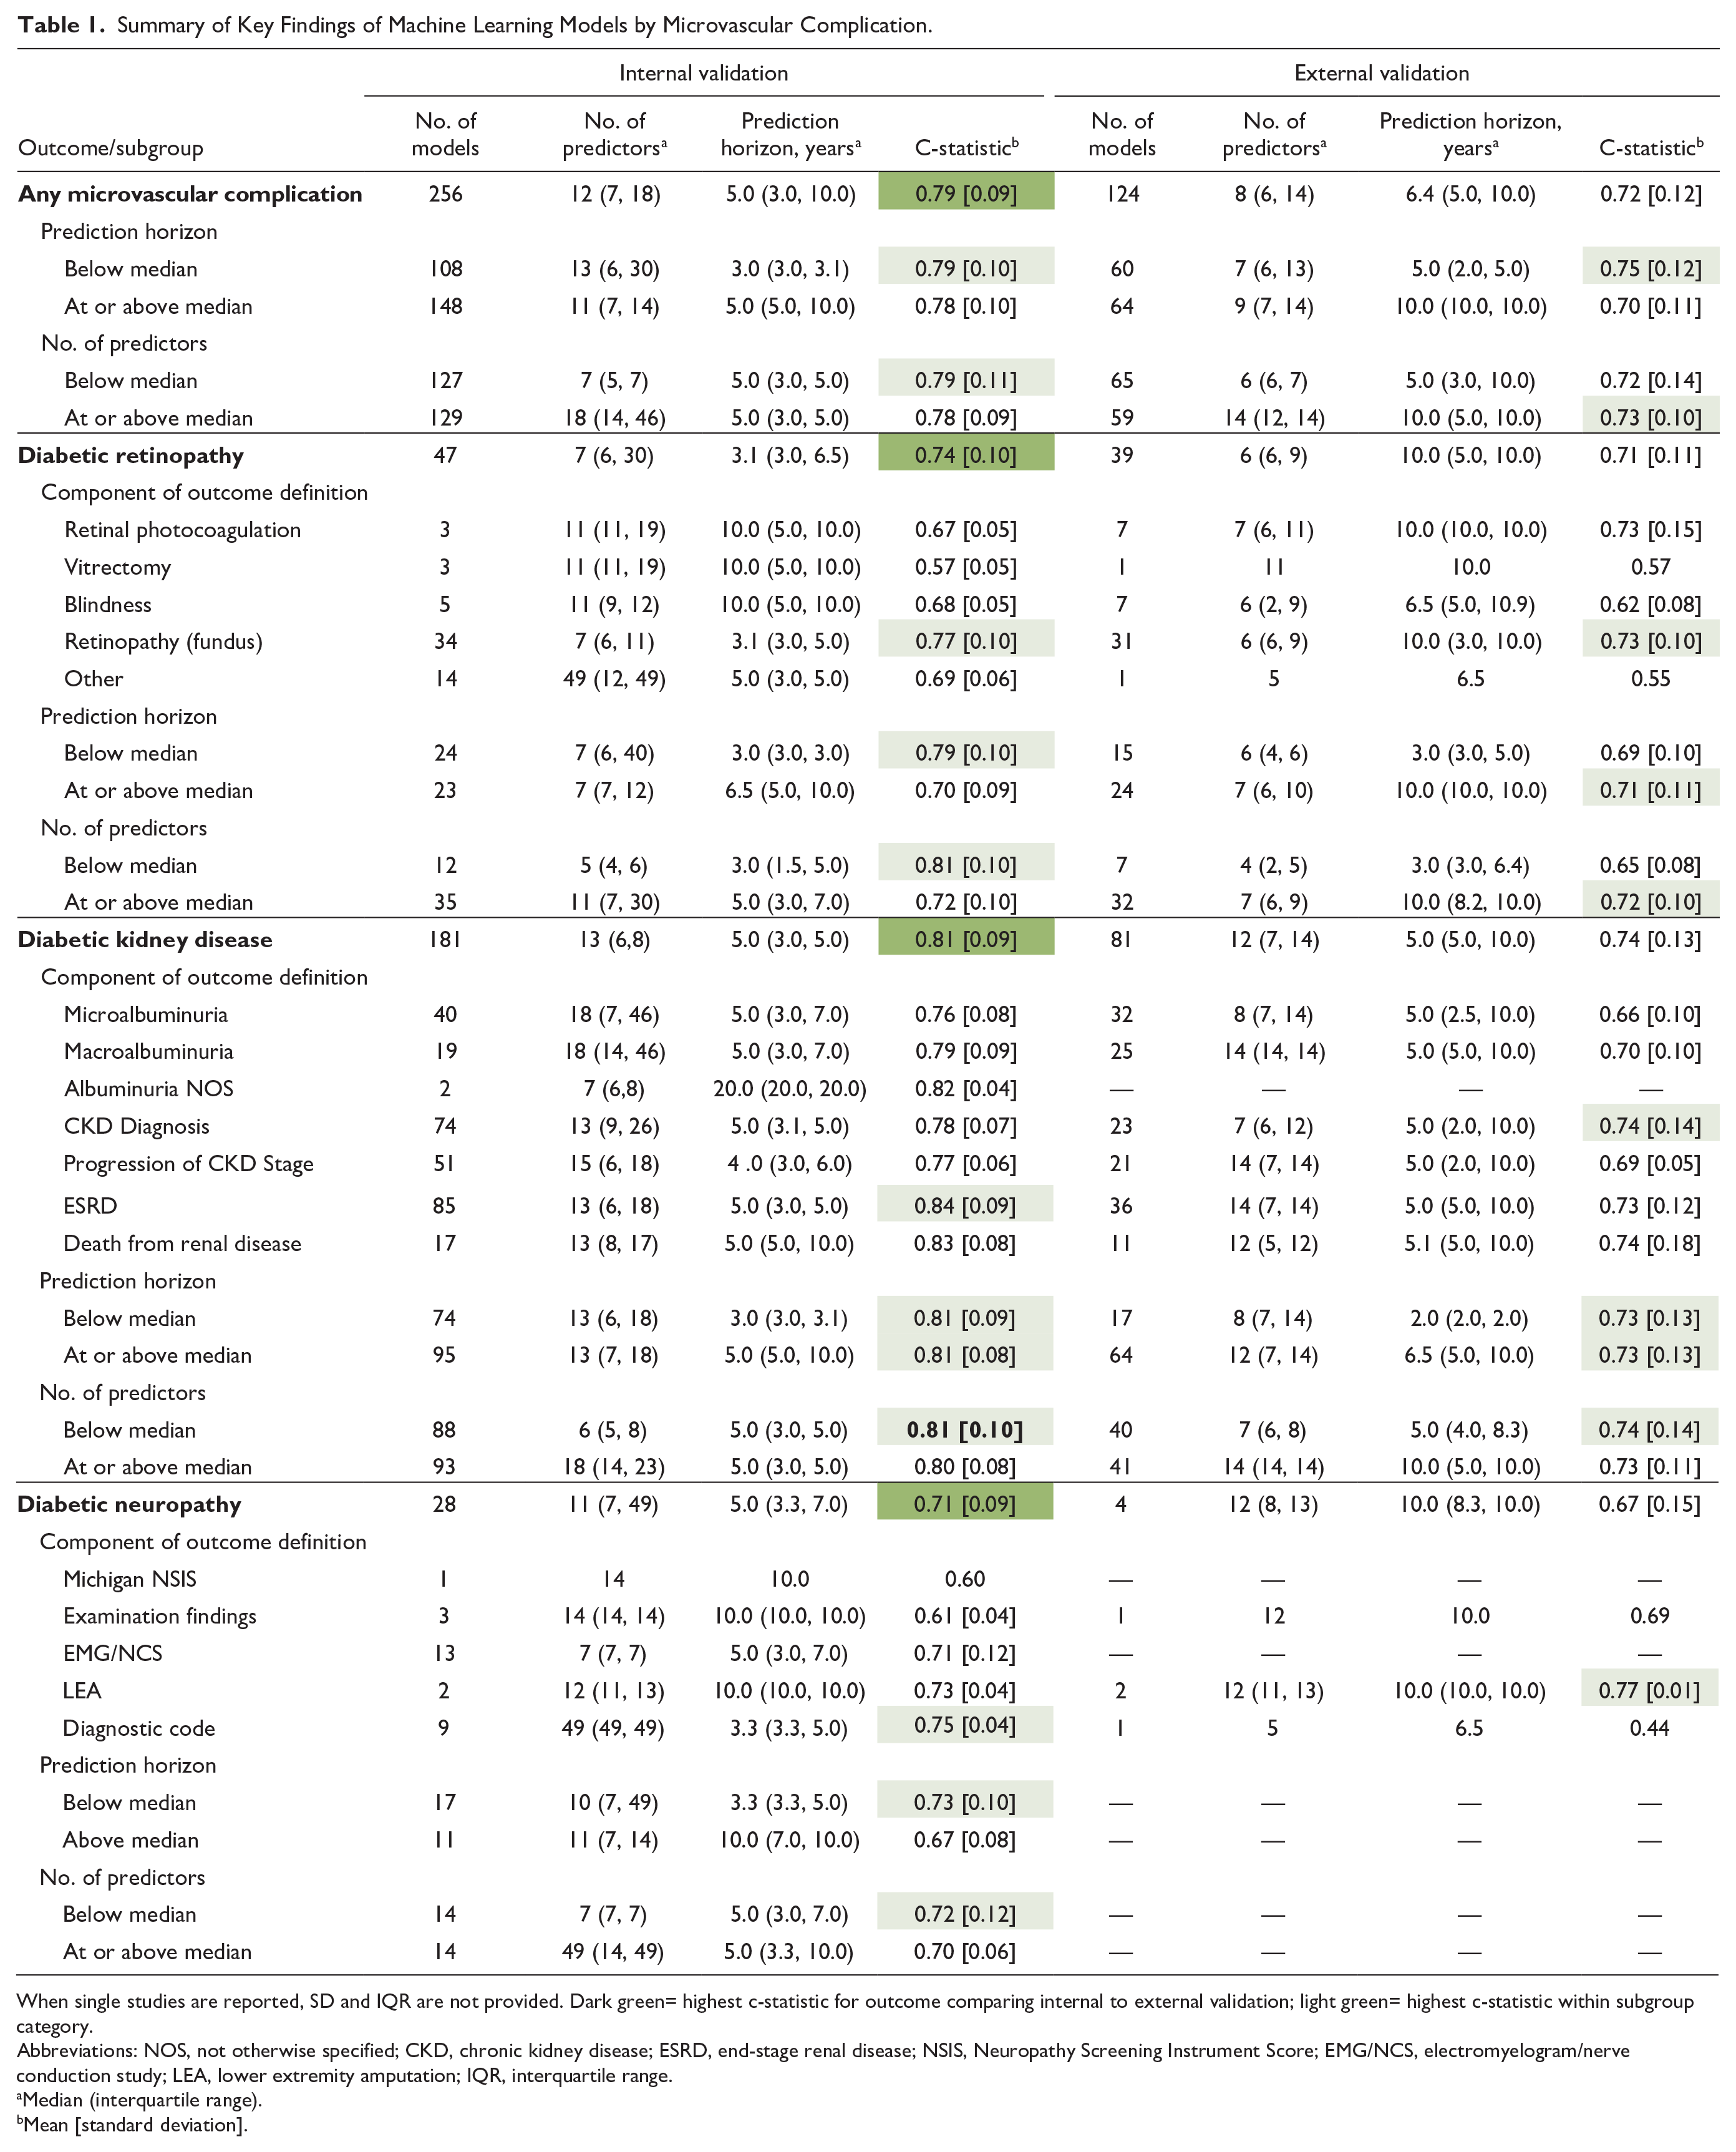
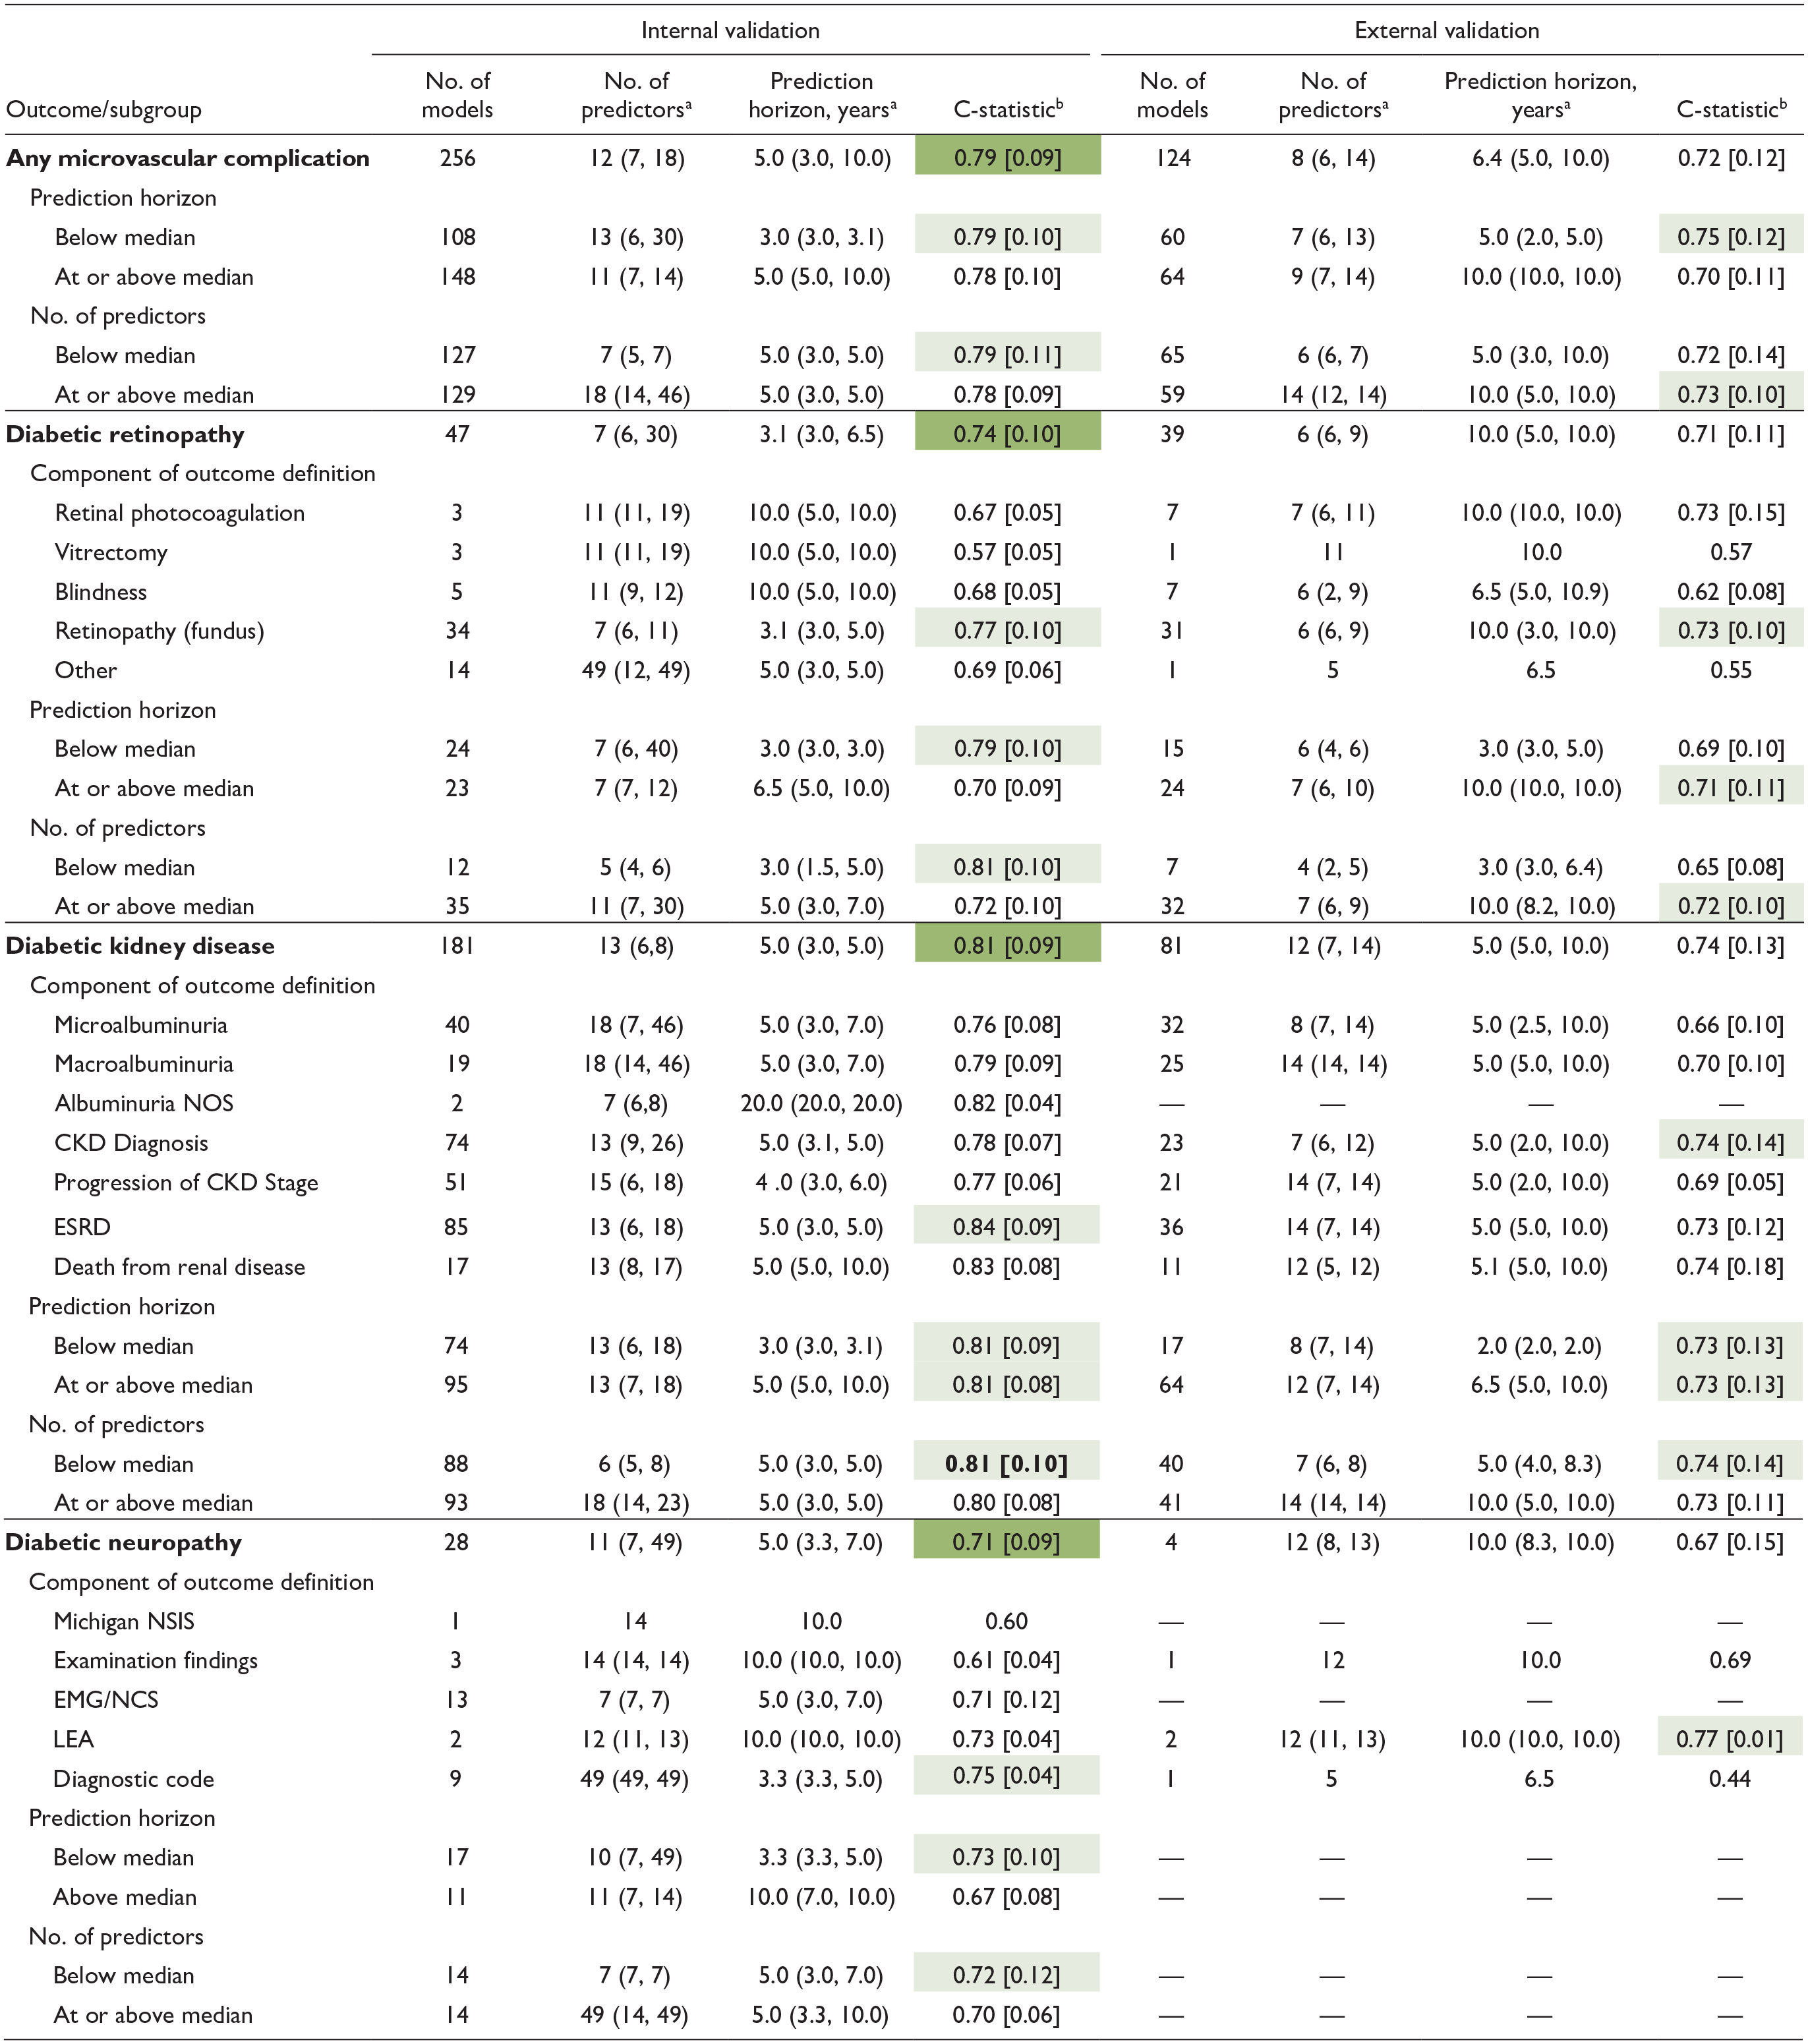
When single studies are reported, SD and IQR are not provided. Dark green= highest c-statistic for outcome comparing internal to external validation; light green= highest c-statistic within subgroup category.
Abbreviations: NOS, not otherwise specified; CKD, chronic kidney disease; ESRD, end-stage renal disease; NSIS, Neuropathy Screening Instrument Score; EMG/NCS, electromyelogram/nerve conduction study; LEA, lower extremity amputation; IQR, interquartile range.
Median (interquartile range).
Mean [standard deviation].
On average, models had 12 predictors for internal validation and eight for external validation, with prediction horizons of 5 and 6.4 years, respectively. The mean [standard deviation] c-statistics were 0.79 (0.09) for internal and 0.72 (0.12) for external validation. Models with shorter prediction horizons and fewer predictors typically demonstrated better discrimination. Outcome definitions are detailed in Supplemental Figures 5 and 6.
In internal validation, DKD models showed the highest discrimination with a mean c-statistic of 0.81 (0.09), followed by DR at 0.74 (0.10) and DN at 0.71 (0.09). This trend persisted in external validation. Specifically, 181 DKD models were internally validated (c-statistic 0.81 [0.09]) and 81 externally (c-statistic 0.74 [0.13]), with models including ESRD as an outcome achieving the highest internal predictive performance. For DR, 47 models underwent internal validation and 39 external validation, resulting in mean c-statistics of 0.74 (0.10) and 0.71 (0.11), respectively. Models incorporating retinopathy diagnosed via dilated fundoscopy outperformed others. Diabetic neuropathy was represented by 28 internal models and four external ones, achieving c-statistics of 0.71 (0.09) and 0.67 (0.15), respectively.
We investigated the impact of prediction horizon on model performance. In internal validation, the median prediction horizons for DR, DKD, DN, and all complications were 3.1, 5.0, 5.0, and 5.0 years, respectively, and for external validation, they were 10.0, 5.0, 10.0, and 6.4 years. Diabetic retinopathy models with shorter horizons showed higher discrimination, with c-statistics of 0.79 (0.10) for models below the five-year median versus 0.70 (0.10) for those at or above it. Diabetic kidney disease model performance was not significantly affected by the prediction horizon, but for DN, shorter horizons led to higher discrimination, with c-statistics of 0.73 (0.10) versus 0.67 (0.08).
We assessed whether the number of predictor variables influences model performance, stratifying results by complication, and whether predictor counts were below or at/above the median. In internal validation, the median numbers of predictors for DR, DKD, DN, and all microvascular complications were 7, 13, 11, and 12, respectively; for external validation, they were 6, 12, 12, and 8. Diabetic retinopathy models with fewer predictors showed better performance (0.79 vs 0.70). The number of predictors did not significantly affect DKD model performance. For DN, models with fewer predictors performed slightly better, with scores of 0.72 (0.12) versus 0.70 (0.06).
Predictor Variables
Figure 3 displays a heatmap of the predictor variables used in the ML models. Common predictors across all complications include age, sex, smoking, body mass index (BMI), blood pressure, A1C, and creatinine. For DR, unique predictors include diabetes duration and retinopathy history. Diabetic kidney disease models frequently use variables like urine albumin-creatinine ratio (UACR), HDL (high-density lipoprotein) cholesterol, estimated glomerular filtration rate (eGFR), cardiovascular diseases (CVD), triglycerides, LDL (low-density lipoprotein) cholesterol, and uric acid. Diabetic neuropathy models typically incorporate race/ethnicity, socioeconomic factors, hypertension, diabetes duration, and hemoglobin.
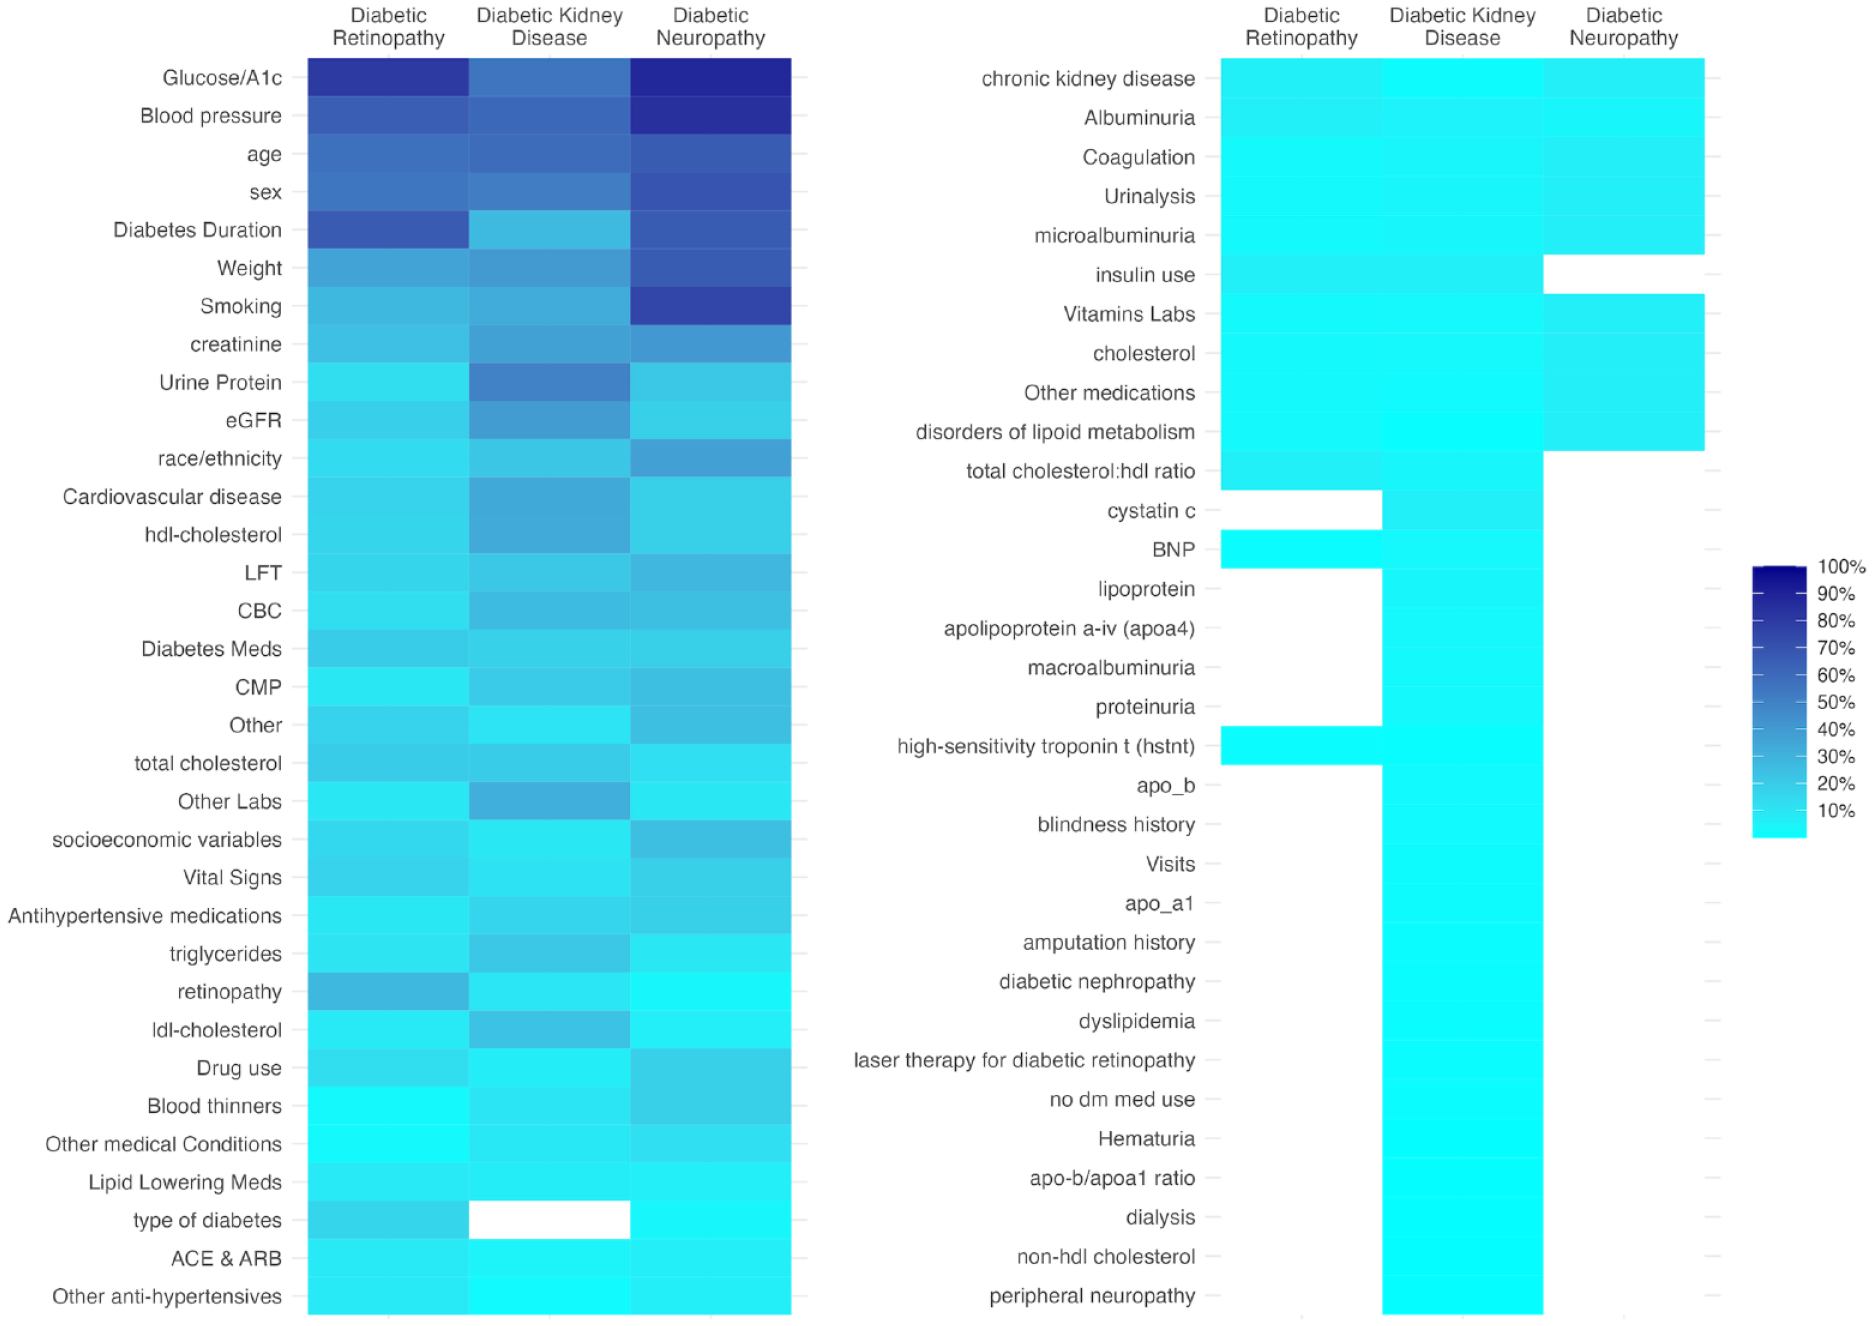
Heat map of predictor variables included in machine learning models by microvascular complication. Proportion of models using the category of predictor variable.
Performance of Predictor Variables
Determining the independent predictive value of specific variables for microvascular complications would require studies to compare models with different combinations of predictors, while keeping other factors constant (eg, validation cohort, prediction horizon, outcome definition). Due to the variability in prediction models across studies, it was beyond the scope of this review to quantitatively assess the relative influence of specific predictors. However, insights were gleaned from previous meta-analyses that externally validated various prediction models for DR and DKD, using different predictor combinations while maintaining other parameters constant. Specifically, for DR, in validation studies with the Hoorn Diabetes Care System prospective cohort using Cox models, 85 a set of predictors for DR outcomes showed superior performance: gender, diabetes duration, A1C, systolic blood pressure, albuminuria, creatinine clearance, and DR. 15 For DKD, validated with the same cohort and modeling technique and focusing on microalbuminuria (UACR ≥ 30 mg/g) over two-, five-, or 10-year horizons, a distinct combination of predictors proved more effective 81 : ethnicity, A1C, systolic blood pressure, UACR, eGFR, DR, baseline anti-hypertensive medication, and waist circumference. 17
Predictive Performance by ML Technique
Figure 4 presents the internal validation performance of ML techniques for each microvascular complication, with external validation results in Supplemental Figure 2. The frequency of ML techniques and specific performance metrics are in Supplemental Figure 1 and Table 8, respectively.
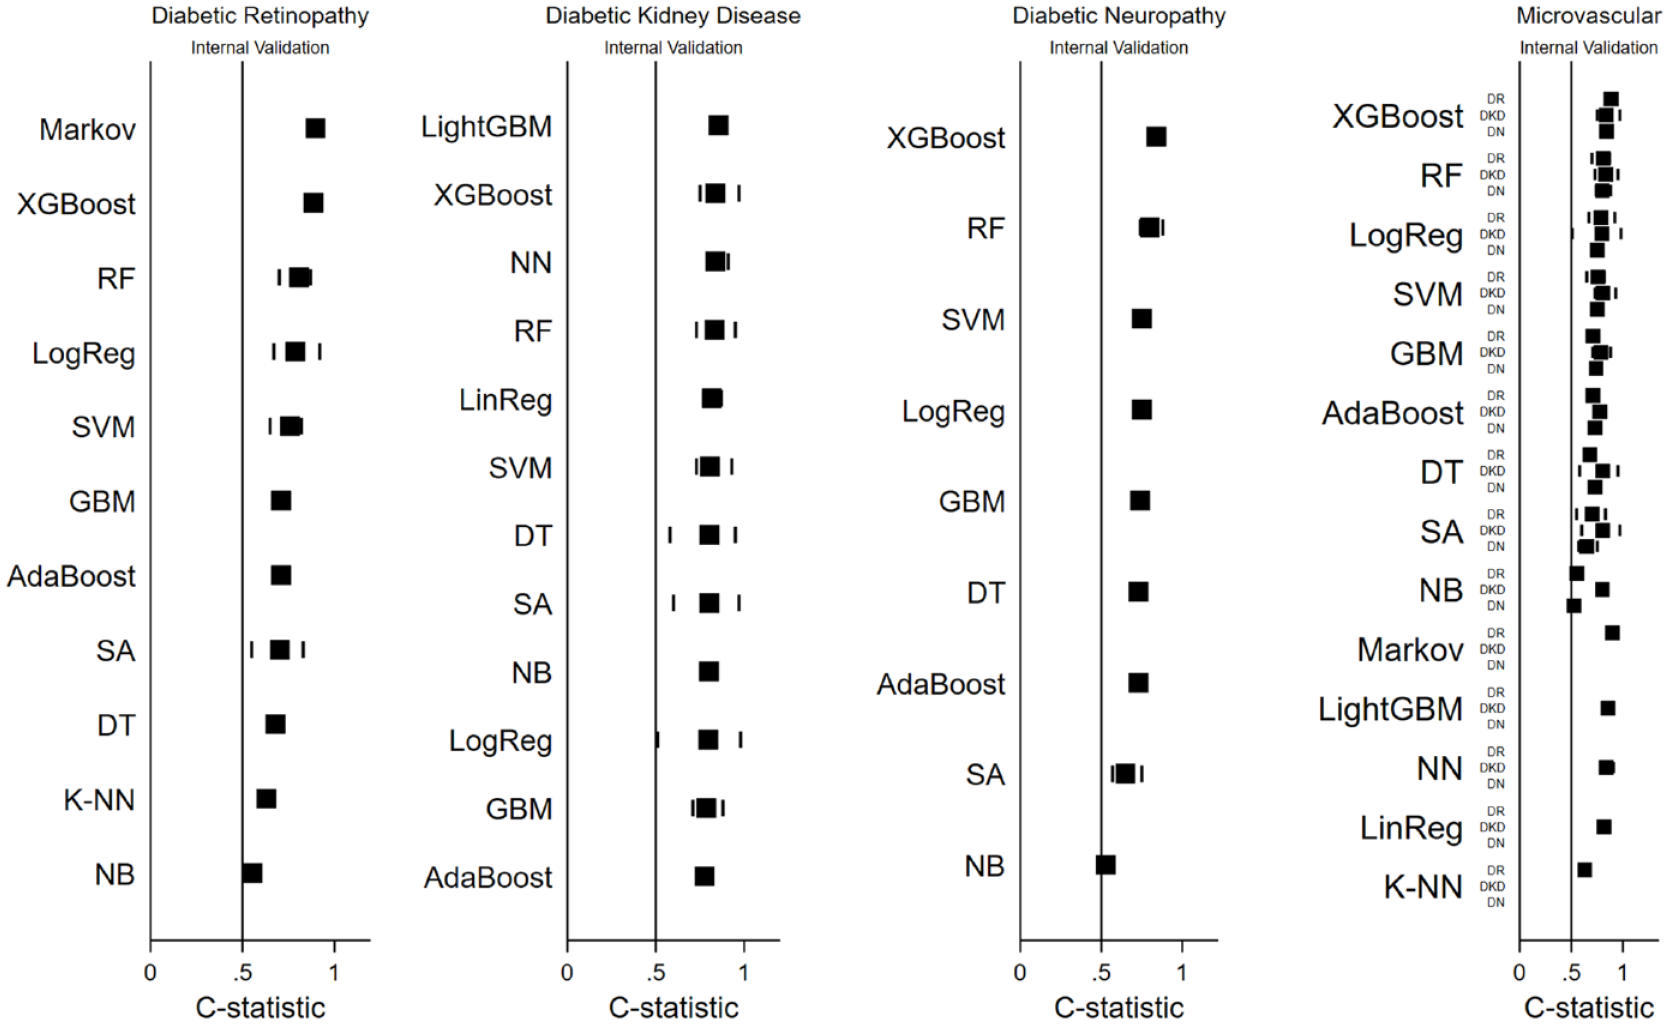
Model performance by ML technique for microvascular complications. Black squares indicate mean c-statistic; lines indicate minimum and maximum c-statistic for each ML model.
The number of models per technique is indicated by “N” values. For DR, top-performing ML techniques were the Markov model (N = 3), XGBoost (N = 2), and RF (N = 5), while K-NN (N = 1) and Naïve Bayes (N = 3) had the lowest performance. In DKD, LightGBM (N = 2), XGBoost (N = 13), and Neural Network (N = 5) were top performers, with Gradient Boosting Machine (N = 5) and AdaBoost (N = 2) showing the lowest, yet still relatively high, discrimination. For DN, XGBoost (N = 1), RF (N = 4), and Support Vector Machine (N = 4) performed best, whereas Survival Analysis (N = 7) and Naïve Bayes (N = 1) had lower discriminative ability. Commonly, XGBoost, RF, and Logistic Regression consistently showed high discrimination across all complications, while Survival Analysis and Naïve Bayes underperformed.
Similar observations were made in studies that kept other model characteristics constant while only varying their machine learning technique.32,44,60,62,67,69,71,73 For example, in the case of DR, the study by Zhao et al 62 compared five ML techniques: XGBoost (area under the curve [AUC]: 0.91 [0.9–0.93]), RF (AUC: 0.87 [0.86–0.89]), Logistic Regression (AUC: 0.81 [0.79–0.83]), SVM (AUC: 0.80 [0.78–0.82]), and K-NN (AUC: 0.63 [0.6–0.66]). In the case of DKD, the study by Dong et al 60 compared seven ML techniques: LightGBM (AUC: 0.82 [0.75–0.88]), AdaBoost (AUC: 0.81 [0.74–0.87]), Neural Network (AUC: 0.80 [0.73–0.87]), Logistic Regression (AUC: 0.80 [0.73–0.87]), XGBoost (AUC: 0.78 [0.71–0.85]), Support Vector Machine (AUC: 0.79 [0.72–0.86]), and DT (AUC: 0.58 [0.5–0.67]).
Discussion
In this comprehensive comparative review of ML-based prediction models for microvascular complications, we identified key trends and methodological findings from 74 longitudinal studies. The global reach of these studies, spanning 31 countries, underscores the international interest in this burgeoning field of research. Among the microvascular complications, the greatest volume of validated models and overall prediction performance were observed for DKD. Predictive performance was invariably better on internal validation compared with external validation, as expected due to fundamental issues related to homogeneity of development cohorts, data set similarities, and overfitting. Model performance was influenced by the type and number of predictor variables, outcome definitions, prediction horizon, and the ML techniques used. Notably, XGBoost, RF, and Logistic Regression emerged as top-performing techniques across microvascular complications, although other techniques—such as LightGBM, and NN—also excelled for individual microvascular complications. In contrast, DT, Survival Analysis, K-NN, and Naïve Bayes had poorer predictive performance. Many studies offered only minimal performance metrics, such as the c-statistic (and often without confidence intervals), limiting the scope for detailed meta-analyses.
We speculate that the superior performance of DKD prediction models relative to DR and DN might stem from several reasons. One key factor is the use of large, prospective, multinational data sets with diverse type 2 diabetes patients. 3 Diabetic kidney disease models benefit from a global development perspective, whereas DR models are mainly concentrated in North America, Europe, and East Asia. Despite advancements in ML-driven AI for retinal image recognition, DR prediction using EHR data has not seen similar growth. Diabetic neuropathy prediction models are even less widespread. Diabetic kidney disease models also stand out for their detailed staging of outcomes, unlike DR models that focus on later disease stages. The availability of clinical biomarkers (such as creatinine, eGFR, and urine albumin) in DKD may have enabled clearer differentiation between stages, improving predictive accuracy of ML models for DKD compared with DR and DN. 3
Furthermore, model performance may be influenced by the type of predictors used. 3 For DKD, typical predictors included age, sex, blood pressure, A1C, weight, smoking, creatinine, urine albumin-to-creatinine ratio, eGFR, HDL, LDL, triglycerides, and cardiovascular risk. Diabetic retinopathy models incorporated predictors such as age, sex, blood pressure, A1C, duration of diabetes, history of retinopathy, and diabetes type. Additional predictors for DKD are ethnicity, duration of diabetes, and DR, 52 while DR unique predictors include history of pregnancy and cataract surgery. 86 No study in this review concurrently incorporated all these predictors for either DKD or DR, suggesting that including more of these overlapping factors may improve model performance.
Beyond selecting clinically relevant predictors, it is also important to choose predictors that are stable over time, integrate seamlessly with the EHR as discrete data, are accurately measured, and are generalizable across diverse patient populations. 3 For example, the presence of microvascular complications can provide insights into the duration of diabetes and the level of glycemic control. Such predictors tend to be more time-stable than baseline glucose or A1C levels, especially over long prediction durations. Due to the annual lab and imaging screenings recommended for monitoring DKD and DR, a wealth of EHR data is available for these microvascular complications. 87 Furthermore, with advances in AI-based image detection, enhanced DR screening and standardized reporting are on the horizon. 88 The relatively lower predictive performance for DN models is not unexpected given the lack of definitive biomarkers for DN, potential inconsistencies in recording neuropathy examination findings in the EHR (often not as discrete data), and the absence of a standardized system to monitor DN progression.
The prediction horizon is another fundamental factor for model performance. Longer horizons pose challenges in maintaining accuracy due to new data and secular trends. For instance, introduction of renal protective drugs like SGLT-2 inhibitors alters patient trajectories. An ideal prediction horizon should balance between being sufficiently long to observe the event of interest and short enough to keep baseline predictors relevant. 3 For example, the five- and 10-year incidence rates for any DR in T2D are 20% and 75%, respectively, suggesting a five-year horizon for DR prediction; conversely, a 10-year horizon may be more suitable for diabetic macular edema, especially in newly diagnosed patients. 89
In our study, the prediction horizon’s impact varied with the outcome. Shorter horizons generally yielded better performance, but DKD is an exception, likely because ESRD is a common outcome with a low incidence rate, potentially inflating the c-statistic performance due to high NPV. 90 Therefore, researchers should consider providing additional metrics such as PLR and NLR, which are less influenced by of outcome prevalence. 91
The type of ML techniques may also play a role in model performance. Key differentiators among ML techniques include their ability to (1) capture complex interactions and handle nonlinearity, (2) manage missing data, (3) prevent overfitting and reduce misclassification errors, (4) optimize computational efficiency, and (5) maintain model interpretability. Our analysis aimed to assess how these techniques affect model performance, acknowledging that factors beyond modeling technique can influence outcomes. We found that XGBoost, RF, and Logistic Regression had the highest average c-statistics across all microvascular complications. XGBoost and RF, both ensemble ML algorithms, improve performance by integrating decisions from multiple models. These methods, in contrast to traditional logistic regression, which assumes a linear relationship between the outcome and predictor variables and struggles with missing data, demonstrate enhanced discrimination capabilities.92,93
In addition, the Markov model demonstrated high predictive accuracy for DR, while LightGBM and NN excelled in DKD prediction. However, the Markov model’s accuracy, primarily validated internally in three models, requires external validation confirmation. 94 LightGBM, akin to XGBoost, is efficient and effective with extensive EHR data. 95 Neural Networks, as unsupervised models, excel in identifying feature interactions and manage nonlinear relationships in large medical data sets. 96
Conversely, K-NN, Naïve Bayes, and Survival Analysis showed lower predictive accuracy for microvascular complications. K-NN struggles with numerous predictors, leading to misclassification and computational intensity. 97 Naïve Bayes’ assumption of independent predictor variables is often unrealistic in microvascular complications. 98 Survival analysis, such as Cox models, assume constant hazard ratios, unsuitable for diabetic complications where risk factors vary over time. Alternative ML techniques might better capture complex patterns and nonlinear relationships in diabetic complications.
Our analysis identified a significant discrepancy in validation methods across studies. Many authors mislabeled their validation as “external” when it resembled split-sample validation within the same cohort used for training. This distinction is crucial for understanding model generalizability. Split-sample validation, dividing data into training and validation sets, assesses model reliability but lacks the robustness of true external validation. External validation tests the model on a completely different data set, often from another institution or region, highlighting its applicability across diverse patient groups and clinical scenarios. 99
Our findings build on a 2021 meta-analysis focused on microvascular complications, particularly DKD and DR. 5 This analysis showed that only 25% of 71 studies underwent external validation. In the DR subset, only six studies used ML techniques, with internal validation c-statistics of 0.82 for logistic regression and 0.75 for Cox. For DKD, of 96 equations from 30 studies, only 17 used ML, with a c-statistic of 0.77. No ML techniques were used in 18 studies on ESRD, showing c-statistics of 0.87 internally and 0.86 externally. The meta-analysis highlighted a lack of external validation and a need for more ML studies. Our study revealed that many of these initially reported studies underwent external validation in subsequent meta-analyses.78,81
In conclusion, ML shows promise for precision medicine in diabetes, aiding treatment decisions and early detection. Our study emphasizes the need for rigorous design, including using diverse cohorts for internal and independent ones for external validation, selecting efficient ML techniques for multidimensional EHR data, focusing on clinically relevant outcomes, setting appropriate time horizons, and choosing predictors for their ease of collection, bias minimization, stability, and predictive value. Future research should follow established guidelines and focus on integrating ML models into EHRs to assess impact on clinical outcomes, such as microvascular complications.
Supplemental Material
sj-docx-1-dst-10.1177_19322968231223726 – Supplemental material for Machine Learning Models for Prediction of Diabetic Microvascular Complications
Supplemental material, sj-docx-1-dst-10.1177_19322968231223726 for Machine Learning Models for Prediction of Diabetic Microvascular Complications by Sarah Kanbour, Catharine Harris, Benjamin Lalani, Risa M. Wolf, Hugo Fitipaldi, Maria F. Gomez and Nestoras Mathioudakis in Journal of Diabetes Science and Technology
Footnotes
Abbreviations
AUC-ROC, area under the receiver operating curve; BMI, body mass index; CVD, cardiovascular diseases; CKD, chronic kidney disease; CI, confidence intervals; DT, Decision Trees; DKD, diabetic kidney disease; DN, diabetic neuropathy; DR, diabetic retinopathy; EMG/NCS, electromyography/nerve conduction studies; EHR, electronic health record; ESRD, end-stage renal disease; eGFR, estimated glomerular filtration rate; GBM, Gradient Boosting Machines; K-NN, K-Nearest Neighbors; LinReg, linear regression; LogReg, logistic regression; ML/AI, machine learning/artificial intelligence; NSIS, Michigan Neuropathy Screening Instrument Score; NB, Naïve Bayes; NLR, negative likelihood ratio; NPV, negative predictive value; NN, Neural Networks; NOS, not otherwise specified; PLR, positive likelihood ratio; PPV, positive predictive value; RF, Random Forest; RCT, randomized controlled trial; Stata, Stata Statistical Software; SA, survival analysis; T2D, type 2 diabetes; UACR, urine albumin-creatinine ratio.
Declaration of Conflicting Interests
The author(s) declared no potential conflicts of interest with respect to the research, authorship, and/or publication of this article.
Funding
The author(s) disclosed receipt of the following financial support for the research, authorship, and/or publication of this article: N.M. received funding from the NIDDK (K23DK111986). M.G. and H.F. received funding from the Swedish Heart-Lung Foundation (20190470), Swedish Research Council (EXODIAB, 2009-1039; 2018-02837), Swedish Foundation for Strategic Research (LUDC-IRC, 15-0067), and EU H2020-JTI-lMl2-2015-05 (Grant agreement number 115974—BEAT-DKD).
Supplemental Material
Supplemental material for this article is available online.
References
Supplementary Material
Please find the following supplemental material available below.
For Open Access articles published under a Creative Commons License, all supplemental material carries the same license as the article it is associated with.
For non-Open Access articles published, all supplemental material carries a non-exclusive license, and permission requests for re-use of supplemental material or any part of supplemental material shall be sent directly to the copyright owner as specified in the copyright notice associated with the article.