
Abstract
Background:
Data-driven models of the glucose-insulin metabolism have recently emerged as an effective framework for realistic virtual patient modeling in diabetes. The growing demand for personalized therapies requires precise and individualized models that align naturally with machine learning models trained on patient-specific data. Using deep generative models such as generative adversarial networks opens new possibilities for incorporating previously unmodeled physiological phenomena into simulations.
Methods:
In this study, we developed a new extended version of our conditional Wasserstein generative adversarial network model by incorporating aerobic exercise intensity data from the T1DEXI dataset, along with insulin administration and carbohydrate consumption data. We use an aerobic physical activity model to describe the effects of immediate and prolonged exercise on glycemia from recorded discrete intensity levels. This enables the network to retain contextual information about recent aerobic physical activity. A total of 1479 days of data from 56 patients, including 308 exercise sessions, were used to train and validate our model.
Results:
We evaluated the model to ensure that it replicates real-world data from the T1DEXI study in terms of mean blood glucose, time below range, time in range, time above range, and time in tight range, both in aggregate and when separated by active and sedentary days. In addition, the model reproduces aerobic exercise-induced glucose drops.
Conclusions:
This new model provides a more reliable, extended framework for in silico trials that incorporate physical activity scenarios, which has the potential to be used in the design and validation of automated insulin delivery.
Introduction
Physical activity (PA) is a pillar of healthy lifestyle, particularly for individuals living with type 1 diabetes (T1D): it enhances insulin sensitivity, supports cardiovascular health, and reduces overall insulin requirements. 1 Insulin doses must be adjusted, as exercise alters glucose levels both during the activity and in the hours that follow, even when insulin delivery is automated.2,3 Ignoring PA in therapeutic decision-making may result in suboptimal insulin management, unnecessary hypoglycemic or hyperglycemic episodes, and a less personalized treatment strategy. Explicitly including PA information in models of the glucose-insulin system can improve simulation tools and decision support systems, helping individuals safely integrate exercise into their diabetes management routines. 4
Existing literature on modeling the effects of exercise on glucose dynamics for T1D has predominantly relied on traditional physiological modeling approaches. Such approaches include extensions of the Bergman Minimal Model, 5 integration of PA into white-box physiological frameworks, 6 and control-oriented methods employing first-order transfer functions with time delays to represent exercise-induced glucose disturbances. 7 Physiological models remain a cornerstone in this and other related fields. They offer a transparent representation of physiological mechanisms, 8 enabling clinicians to interpret and trust the model’s behavior. Despite this, they face substantial limitations. Primarily, these models often rely on simplified assumptions for a multitude of their components. Such assumptions include linear responses, constant metabolic rates, and uniform physiological parameters across individuals. Static parameters typically include fixed insulin sensitivity, glucose effectiveness or response rates that do not adapt to changing physiological conditions, such as varying exercise intensities or types. This rigidity complicates the personalization of models and shows the inherent conflict present between model complexity and data collection in the clinical environment. 9 The UVA/Padova model is among the most widely adopted physiological models for simulation,8,10 including nonlinear components for insulin-dependent glucose utilization and absorption, but still features fixed physiological parameters and linear components. The calibration of such models also demands the acquisition of invasive, multi-level data, which is often inaccessible, limiting their practical scalability. 11
Given the high variability of PA within and between individuals, only a handful of explicit PA simulators exist. Clinicians instead rely on empirical rules such as the consensus guidelines established by Riddell et al. 12 Most published PA modules are ad hoc solutions that are directly attached to glucose-insulin models that have already been developed. For instance, Dalla Man et al, 6 simulate both immediate and delayed exercise effects, yet they assumed unverified sensitivity dynamics and primarily tracked activity through heart rate (HR). Heart rate does correlate with exercise intensity but returns to its baseline minutes after exercise and is influenced by age, fitness, hydration, and venous return. Consequently, it provides minimal information regarding the prolonged glycemic impact.13,14 These shortcomings leave a clear gap for more faithful, data-driven representations.
Data-driven approaches offer a more flexible alternative. 15 In particular, generative models can capture the joint distribution of physiological and behavioral variables, allowing simulation of individual variability and lifestyle patterns. Generative adversarial networks (GANs) can approximate complex systems, 16 and their variants can generate realistic data when conditioned to drivers such as insulin or meals. 17 We have already shown that GANs reproduce glucose trajectories with high fidelity.18,19
Inter-patient and intra-patient variability are inherent to the physiology of real T1D patients. To represent this variability, generative models have previously been used to capture the unpredictability of factors such as glucose levels or the rate of carbohydrate appearance. 20 Interest is growing in precision-medicine applications: 21 time-series GANs for personalized insulin dosing22,23 and data augmentation for glucose prediction.24,25
Adding inputs naively can degrade data-driven models. 26 In earlier work, we developed two GAN-based virtual twins, in which events are transformed into physiologically meaningful vectors. The first model, a pixel-to-pixel GAN, translated one-dimensional plasma insulin (PI) values into grayscale images, then back into blood glucose (BG) images, generating BG curves conditioned solely on PI dynamics. 18 The subsequent sequence-to-sequence GAN included PI, as well as replacing raw meal announcements with carbohydrate rate of appearance (RA). Shifting inputs 90 minutes captured physiological delays, while a Wasserstein loss and 1D convolutional layers learned temporal structure and produced realistic BG trajectories. 19
The present study aims to extend this framework to aerobic PA. A bi-exponential filter converts discrete intensity readings into a continuous signal that represents both the immediate glucose drop during exercise and the prolonged post-exercise rise in insulin sensitivity. 27 This PA signal becomes a third conditioning input to the GAN, enabling simultaneous modeling of short- and long-term exercise effects.
To the best of our knowledge, this is the first time that a data-driven model of aerobic PA for glycemic simulation has been proposed. Furthermore, we extend the GAN-based methodology by incorporating a third input to condition the generation of glucose values while preserving realistic behavior. Finally, we propose a method for intensity-based translation of PA sessions to represent both long-term and short-term aerobic exercise–induced glucose dynamics, incorporating it as an input to the GAN.
Methods
Dataset
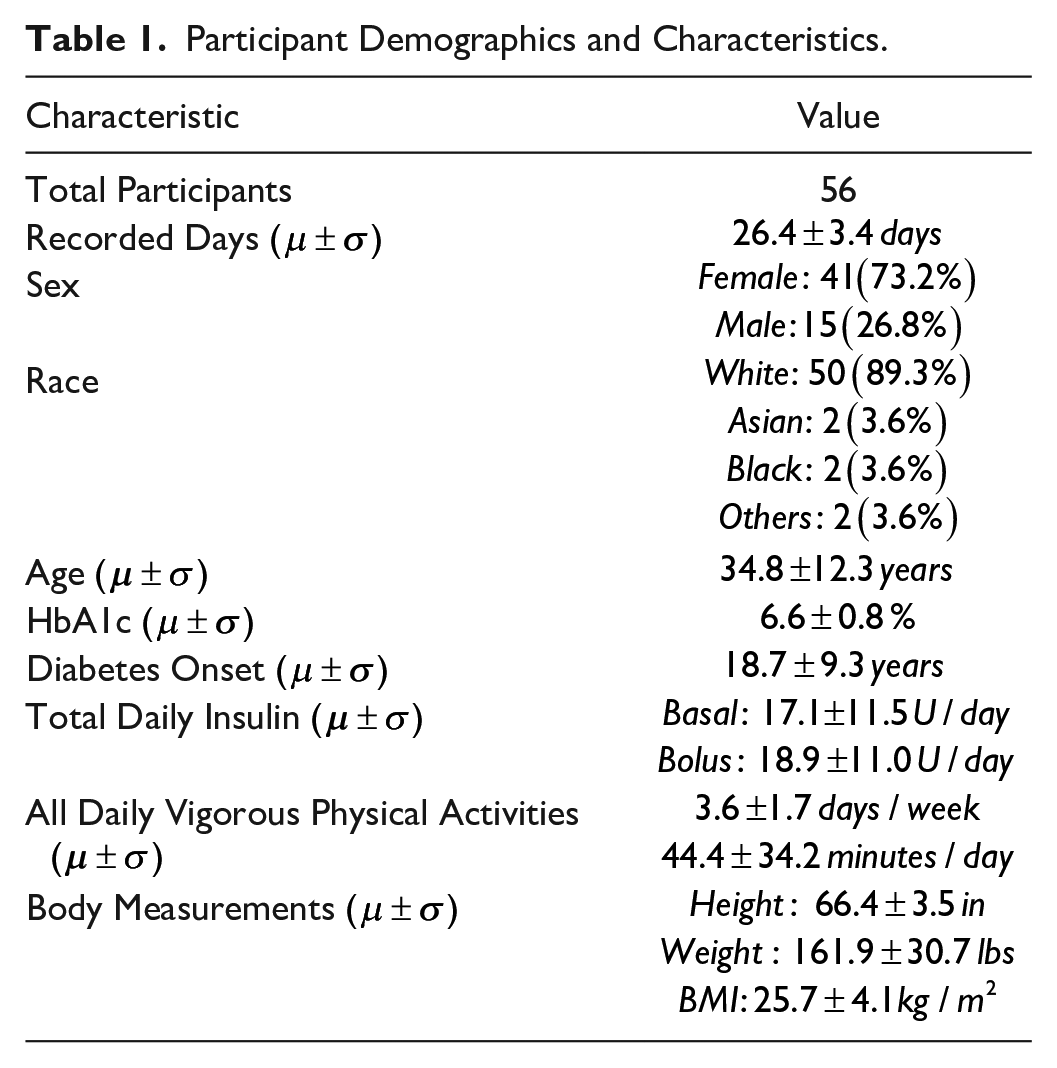
The T1DEXI study 27 monitored adults with T1D for a period of four weeks, during which they engaged in six video-guided aerobic, interval, or resistance workouts. Participants recorded numerous data, including continuous glucose monitoring (CGM), insulin delivery, carbohydrate intake, and exercise intensity. In the present study, we analyzed 56 individuals who met the following criteria: (1) completed ≥ 1 prescribed aerobic workout, (2) used a standard open-loop insulin pump. Prescribed aerobic exercise in T1DEXI was defined a priori by 30-minute study videos designed to keep HR at 70% to 80% of age-predicted HRmax. Participants simply performed these prelabeled sessions.
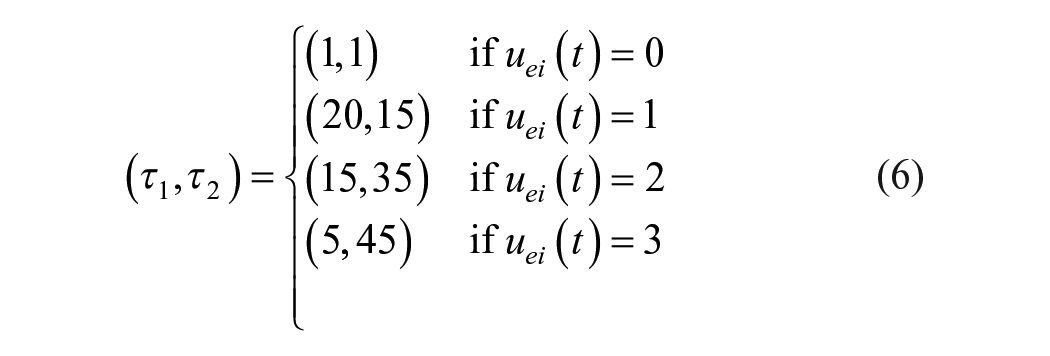
The intensity of exercise was extracted directly from the participant-reported activity intensity levels recorded in the T1DEXI dataset. Exercise logs classified each session as “light” (0), “moderate” (1), or “vigorous” (2). For modeling we shift labels to 1-3 (Supplemental Table S1). Baseline characteristics appear in Table 1.
Participant Demographics and Characteristics.
Data Processing and Integration
Raw XPT files (CGM, insulin, carbs, PA intensities, HR, etc) were merged, and CGM values and pump hourly basal rates were resampled to 5 minutes (see pipeline in Figure 1). Duplicates within 5 minutes were dropped, gaps of less than 30-minute spline-interpolated, and CGM readings below 40 mg/dL were removed. Series with more than 100 consecutive missing samples were split into distinct patient IDs.
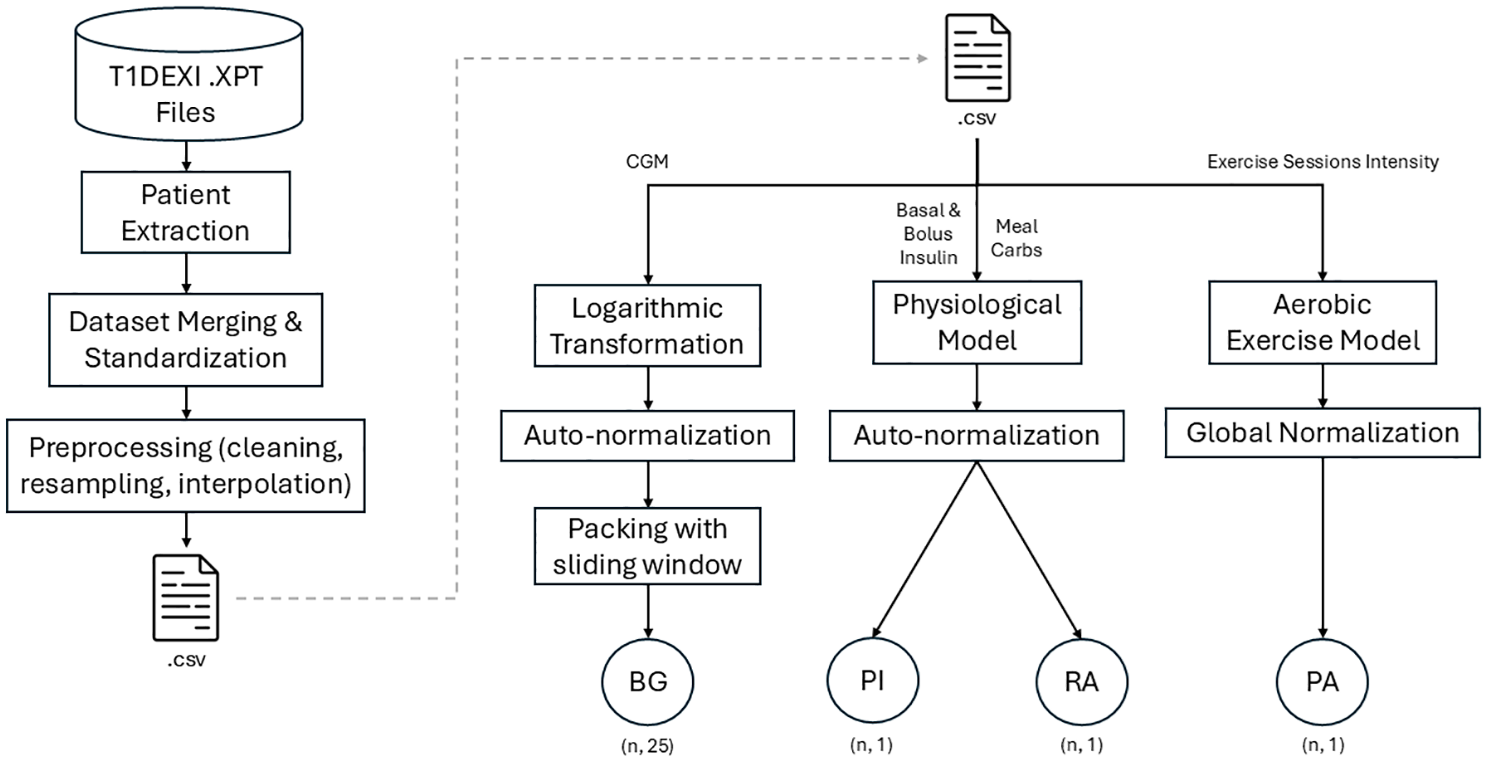
Schematic representation of the data extraction and preprocessing.
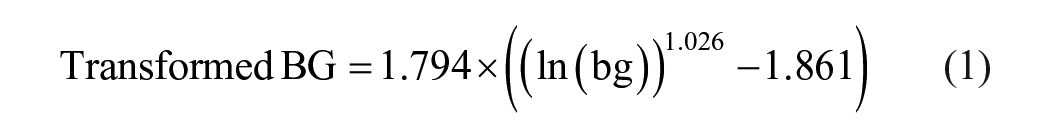
The cleaned table was saved as a CSV file. Then, discrete inputs were converted to continuous curves (see subsections 2.2.1 and 2.2.2). Blood glucose data were log-transformed to balance hypoglycemic and hyperglycemic events. 28 This log-transformation aimed to improve the representation of hypoglycemic events, which were underrepresented compared with hyperglycemic events.
Auto-normalization was applied to BG, PI, and RA. These were min-max scaled for each patient to the range [−1, 1], guaranteeing a full span per individual. Meanwhile, PA was scaled once for the entire dataset. This ensured, only level 3 sessions reached ±1. After scaling, BG values were grouped into sliding-window vectors of length 25 to match the model’s prediction horizon shape.
Physiological modeling
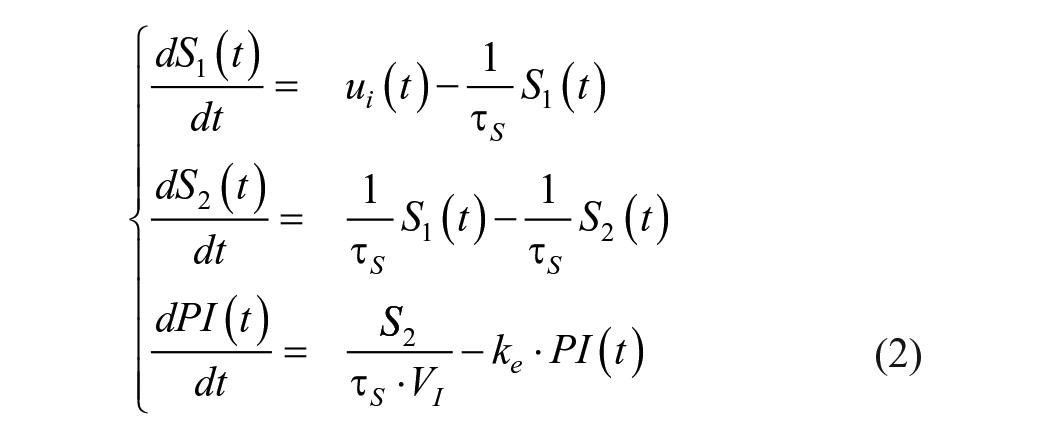
Discrete insulin and carbohydrate inputs were converted into continuous absorption curves using the short-acting insulin and meal absorption models described by Hovorka.
29
Specifically, the model defined by equation (2) gives us the insulin concentration in plasma or PI. In our notation, the original symbol for insulin state
where
Carbohydrate absorption is modeled using equation (3) to produce a continuous rate of appearance
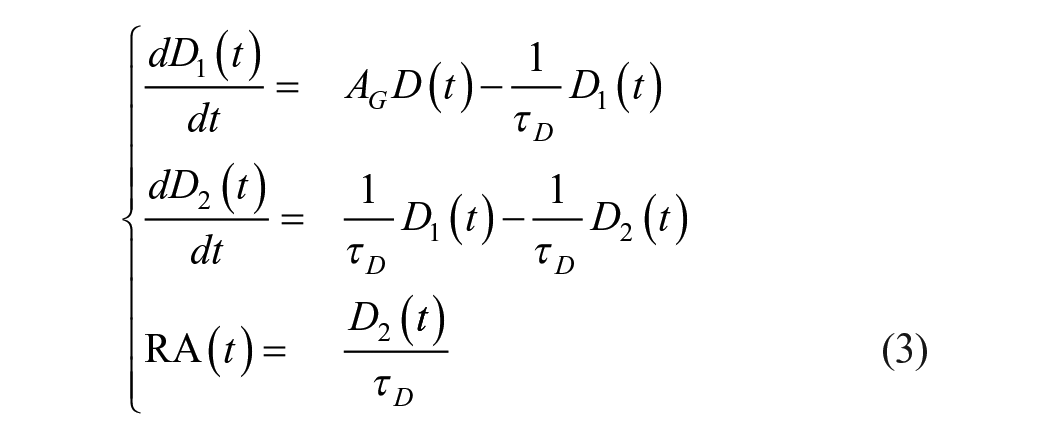
where
PA modeling
The aerobic exercise module is a preprocessing step that converts the discrete intensity log into a single, dimensionless PA signal conveying both the acute and long-term effects of a workout. The model’s objective is not to mechanistically describe physiological processes in detail, but rather to provide the GAN with a single, compact variable that captures “recent exercise history.”
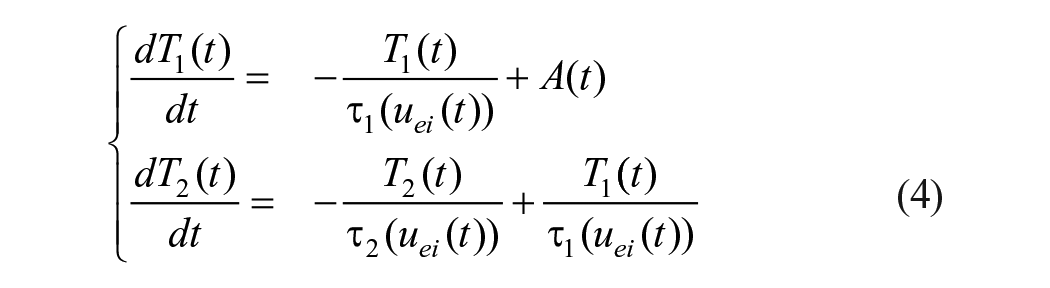
where
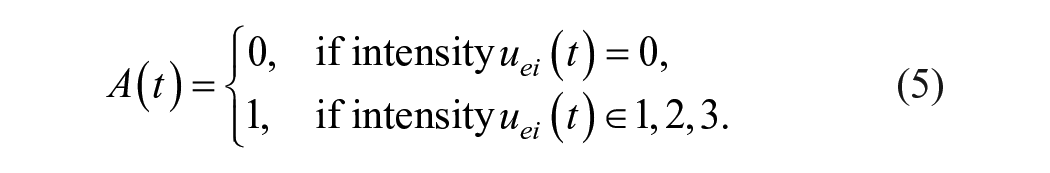
The first compartment
System Architecture
Building on the previously validated conditional Wasserstein GAN (cWGAN) framework, 30 we adopt a sequence-to-sequence design (Figure 2). Both the generator and the critic are conditioned on three physiological streams: RA, PI, and PA.
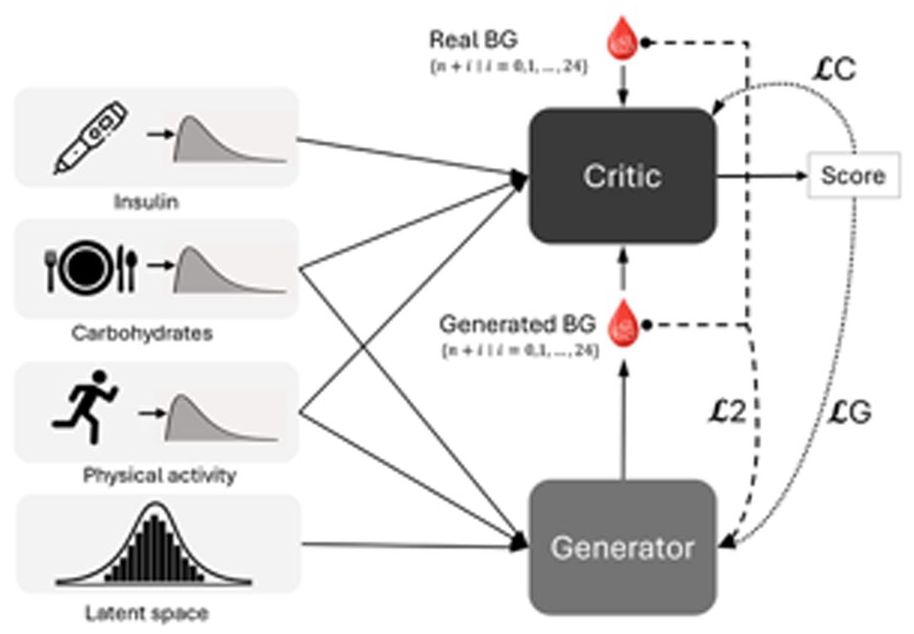
Diagram of the GAN model.
The generator (Supplemental Figure S4) concatenates a five-dimensional Gaussian latent vector with the single-time-point inputs
The critic (Supplemental Figure S5) receives the same conditional triplet plus a 25-point BG vector that is alternately real or generated. Five
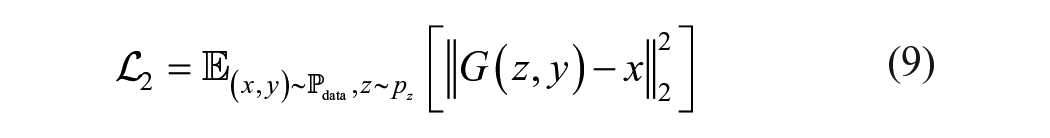
Loss functions
Training the cWGAN relies on three complementary objectives.
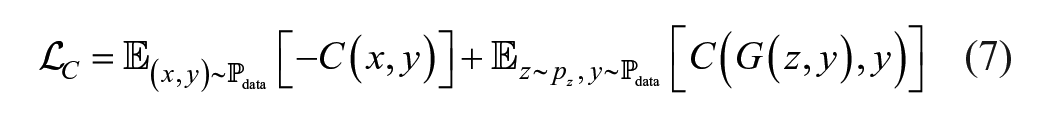
where

where

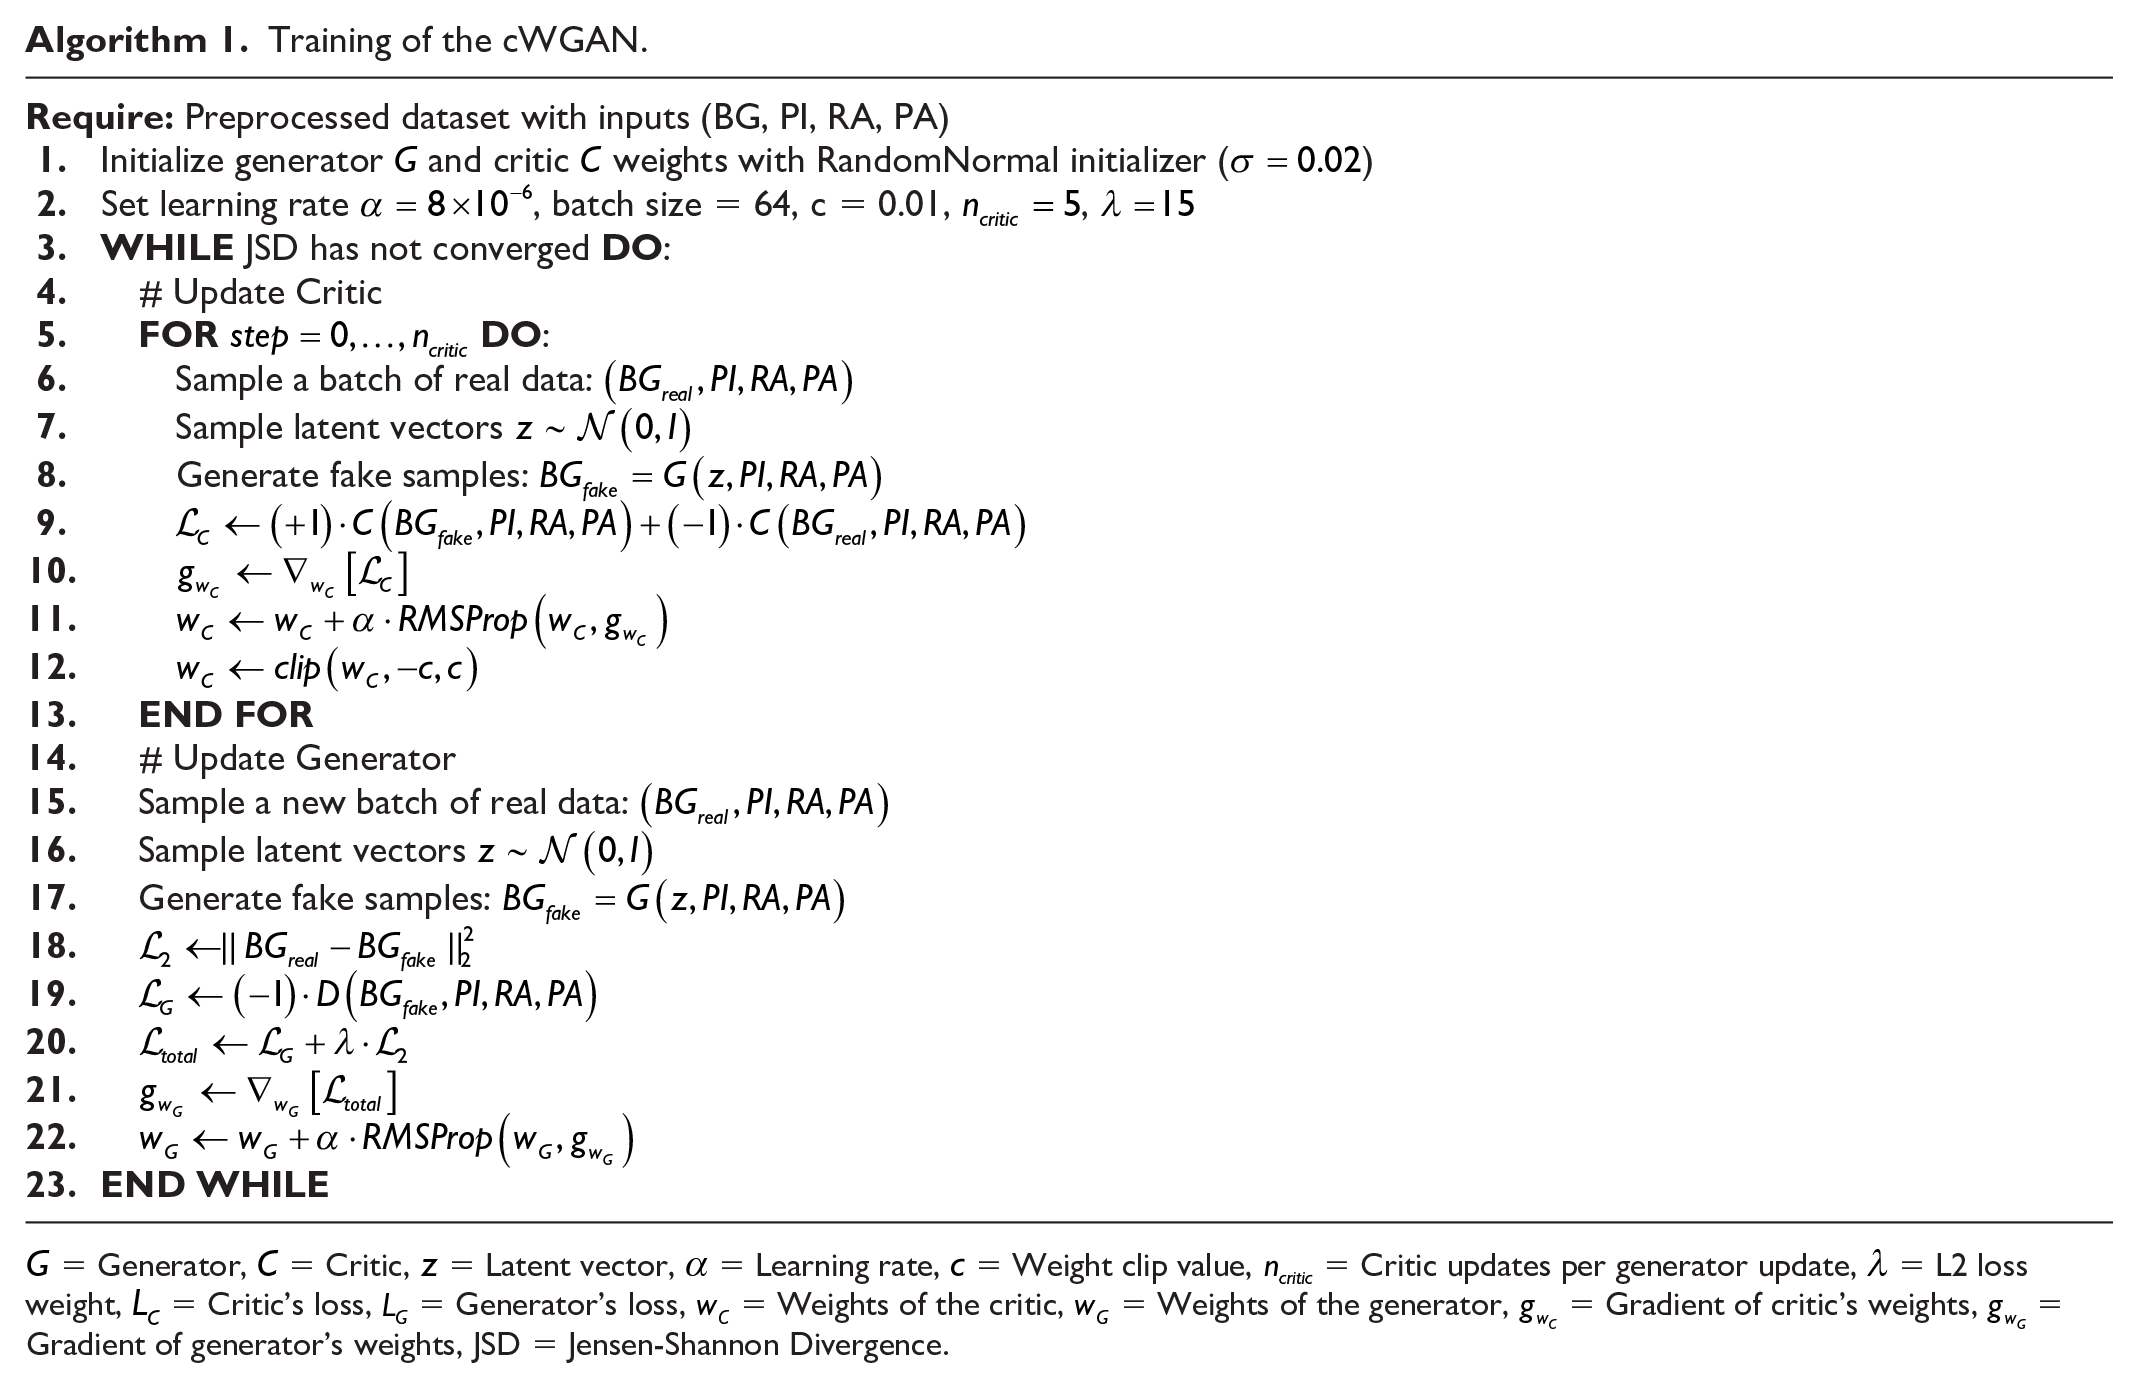
Training procedure
We used Python 3.9.19 with TensorFlow version 2.10 running on an RTX 4070 Ti. Specific training parameters included a batch size of 64, learning rates of
Training of the cWGAN.
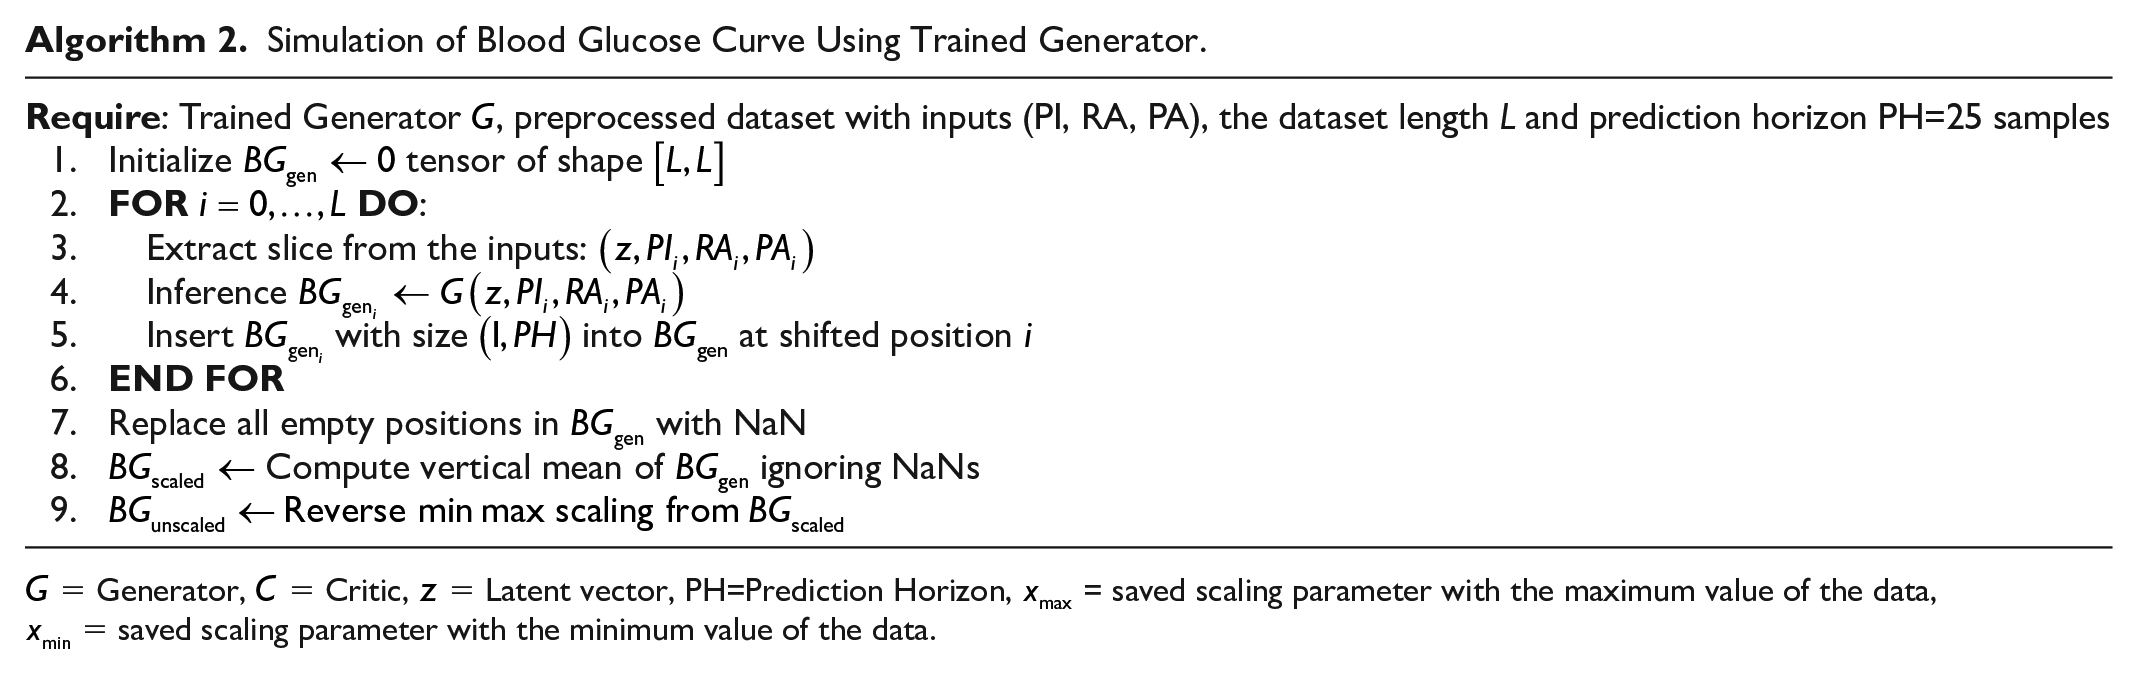
Simulation of Blood Glucose Curve Using Trained Generator.
Validation
Model plausibility is assessed in three stages. First, statistical equivalence is tested by comparing mean BG, coefficient of variation, time below range (TBR), time in range (TIR), time above range (TAR), and time in tight range (TITR) between real and generated days. The Shapiro-Wilk test is used to check normality, and two-sided Student’s t-tests are used to check for group differences. Structural similarity is visualized using t-distributed stochastic neighbor embedding (t-SNE) on real and synthetic windows. The physiological response to exercise is examined by calculating the glucose drop for each workout, a validation strategy also used by Fushimi et al. 31 This is defined as the difference between the 10-minute pre-exercise baseline and the nadir during activity. These drops and the previously mentioned glycemic metrics are then contrasted across active versus sedentary days, and real versus generated patients. An active day is defined as the 24-hour period following the end of an exercise activity, while sedentary periods are any days that fall outside this definition.27,32 Finally, we probe causal consistency through convergent cross-mapping (CCM), to confirm that PI, RA, and PA drive the generated BG dynamics.
Results
After training, the generator alone is used to produce glucose traces based on real conditional inputs. Statistical validation began with Shapiro-Wilk tests, which confirmed normality for all metrics except TBR (see Supplemental Table S2). Two-tailed Student’s t-tests on these metrics (Table 2) revealed that there are no statistically significant differences between synthetic and real glycemic metrics
Comparative of Median (q1-q3) Glycemic Outcomes for Generated Versus Real Data Grouped by Patients (56 patients).
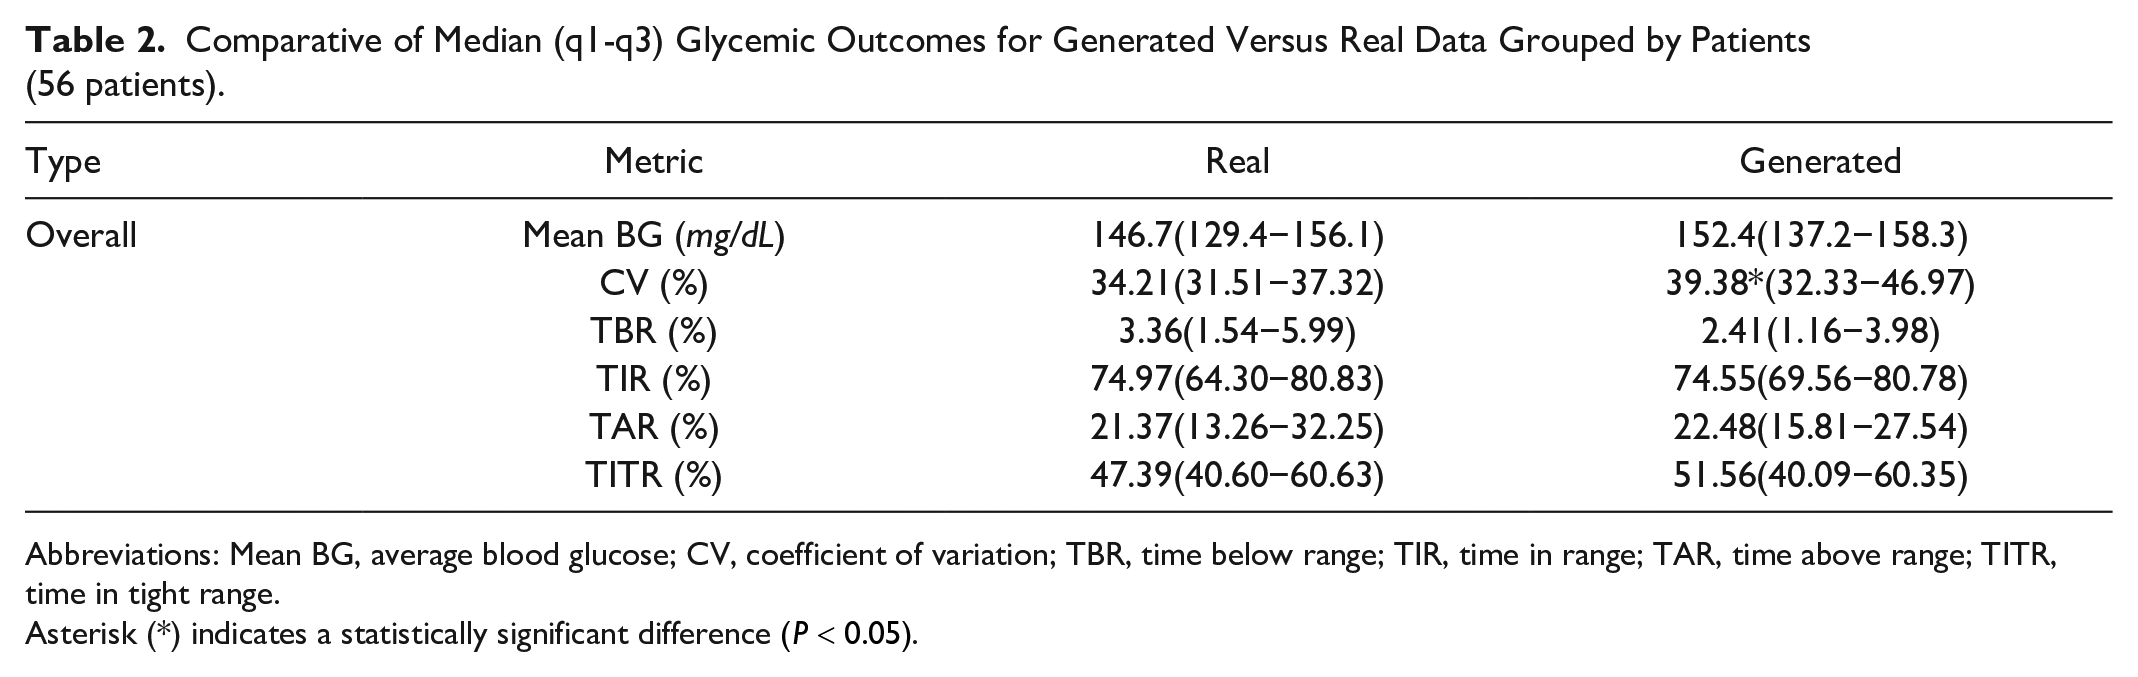
Abbreviations: Mean BG, average blood glucose; CV, coefficient of variation; TBR, time below range; TIR, time in range; TAR, time above range; TITR, time in tight range.
Asterisk (*) indicates a statistically significant difference
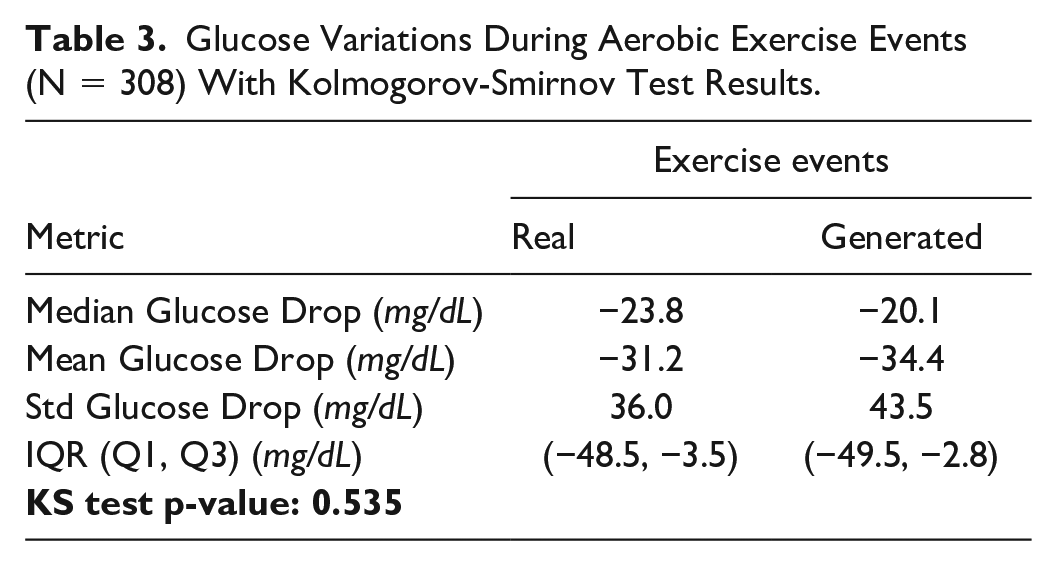
Exercise validation first contrasted glucose drops during cardiovascular activity (Table 3). Since the Shapiro-Wilk test rejected the normality assumption for both real and synthetic glucose, we applied an independent two-sample Kolmogorov-Smirnov test between the two distributions of glucose drops, which found no significant difference between real and generated glucose responses to exercise (
Glucose Variations During Aerobic Exercise Events (N = 308) With Kolmogorov-Smirnov Test Results.
We then compared glycemic metrics between real and generated data, splitting active and sedentary days (Table 4). When comparing active against sedentary days, we observed that mean BG, CV, and TAR were decreased, whereas TBR, TIR, and TITR increased, for both real and generated cohorts. Again, CV was the only metric to show statistically significant difference, being overestimated in generated patients.
Comparative Glycemic Outcomes for Generated Versus Real Data Grouped by Patients (56 patients) in Active and Sedentary States.
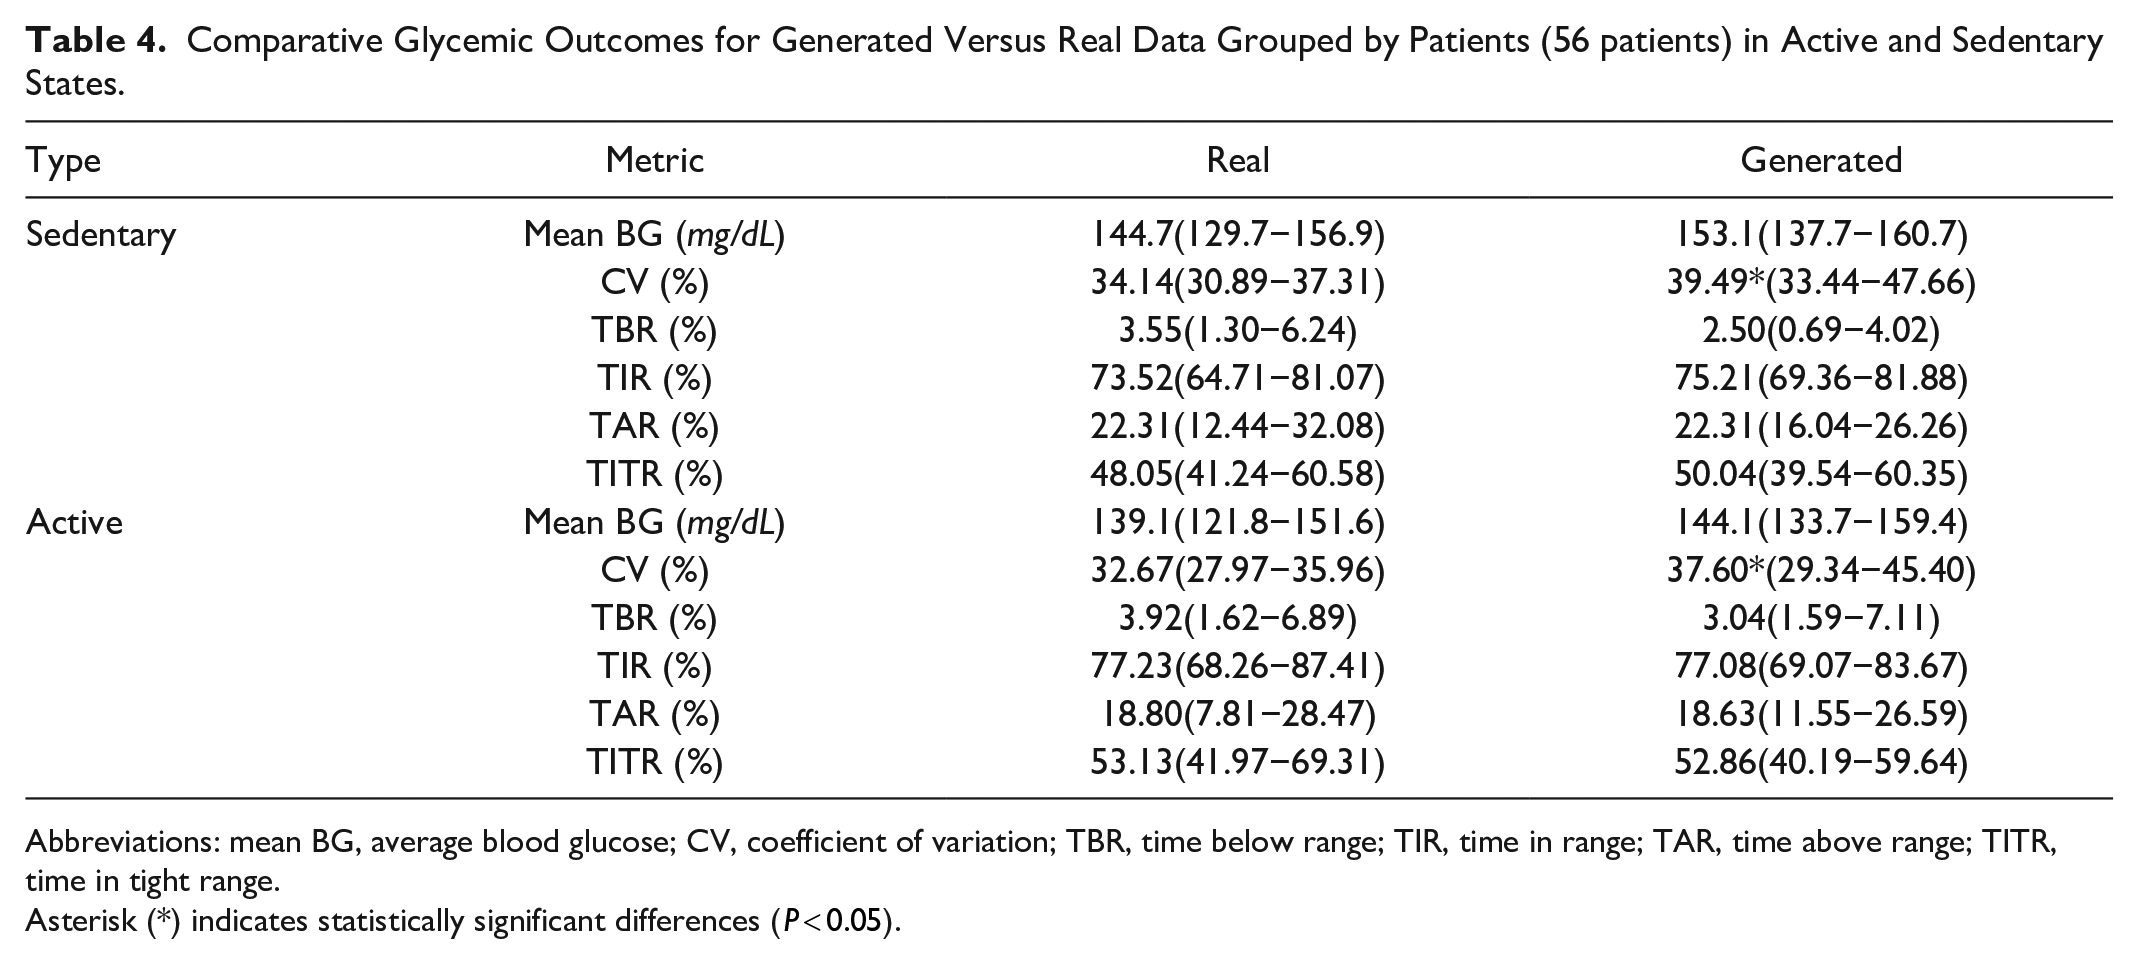
Abbreviations: mean BG, average blood glucose; CV, coefficient of variation; TBR, time below range; TIR, time in range; TAR, time above range; TITR, time in tight range.
Asterisk (*) indicates statistically significant differences (
Figure 3 shows real and generated blood glucose over three days for a sample patient, including input data. The range includes two days with exercise and one without.
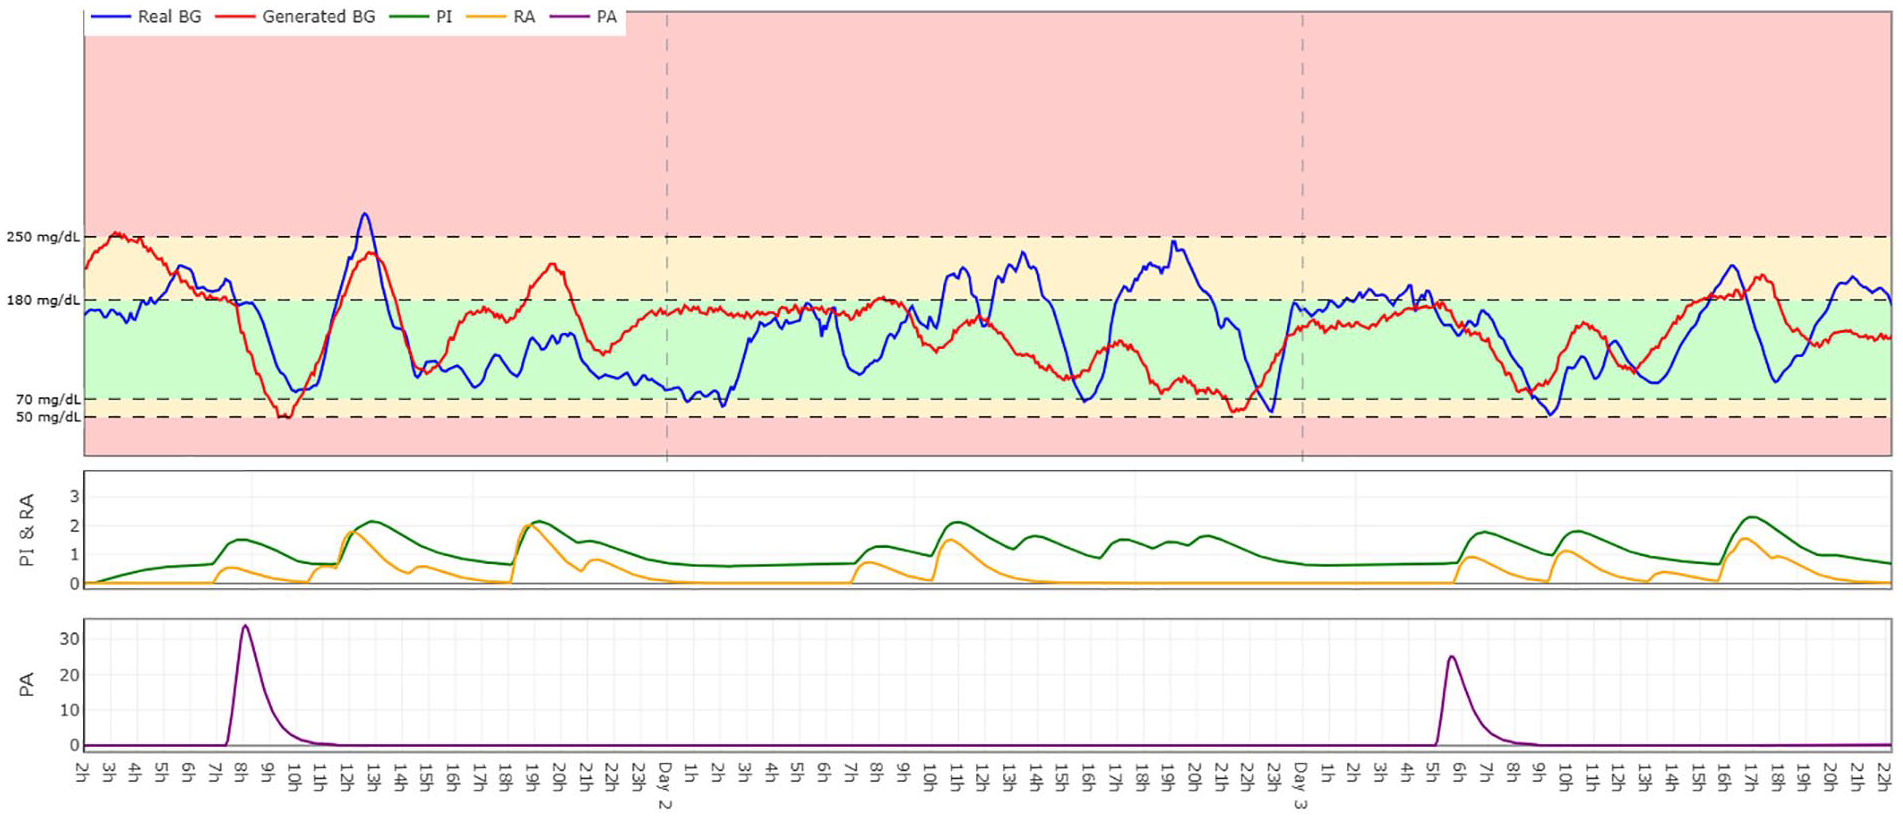
Comparison of real (blue) and generated (red) blood glucose values for Patient 187 over a three-day period. Includes corresponding inputs: PI (green), RA (yellow), and PA (purple). Explore the interactive version at https://timeseries-bg-viz.vercel.app/.
A three-dimensional (3D) t-SNE embedding was used for qualitative distribution analysis (Figure 4). The overlap of real and synthetic point clouds indicates the cWGAN’s ability to replicate the underlying data structure.
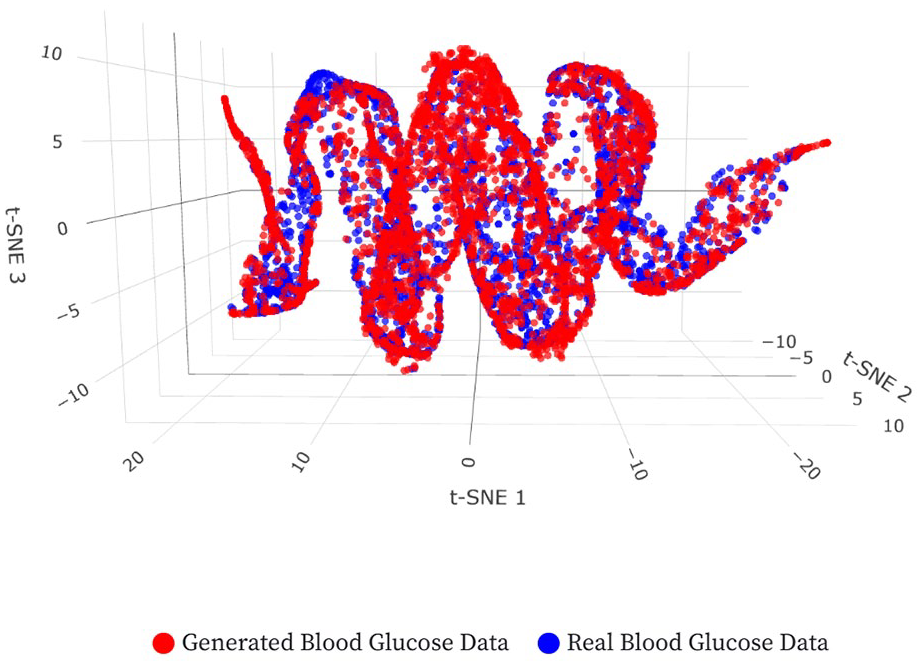
A 3D t-SNE visualization. The axes represent the components learned by the t-SNE dimensionality reduction technique. These axes do not correspond to physical variables but are inferred representations of the data’s intrinsic patterns. Explore the interactive version at: https://tsne-bg-viz.vercel.app/.
Causality was assessed via CCM. The causality coefficients for each input (PI, RA, and PA) are shown in Figure 5. All three inputs exhibit a statistically significant causal effect on glucose, while also demonstrating comparable causal influence on both real and generated glucose dynamics.
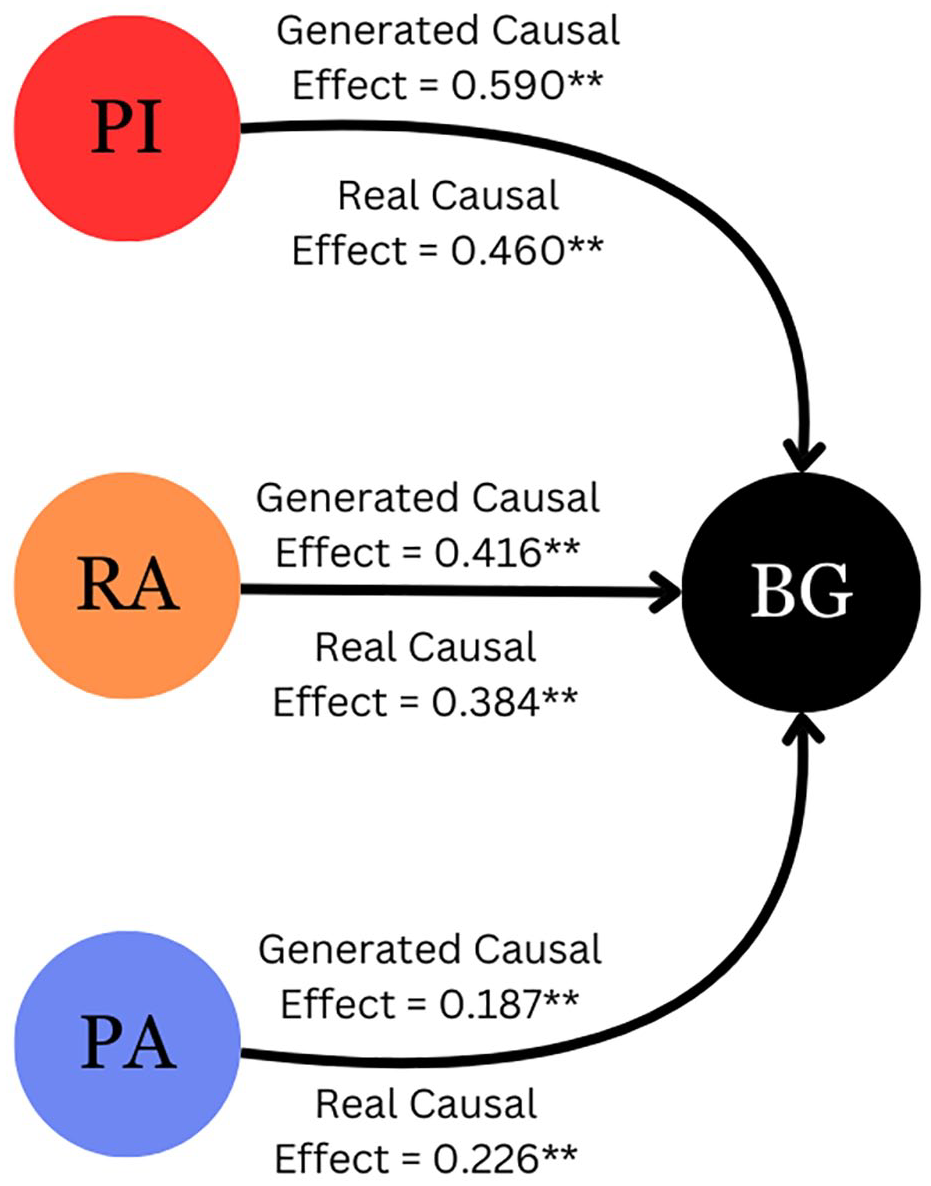
Diagram of causality in the model computed using Convergent Cross Mapping between inputs and outputs.
Discussion
In this study we expanded our data-based virtual twins with PA information. This resulted in a more generalizable tool than previous black-box solutions. Despite overestimated CV, and a slight increase in mean BG, the model reproduces exercise-induced glucose drops. These discrepancies may partly stem from the populational nature of the model, which assumes a uniform response from a heterogeneous cohort. The model captures the long-term effects during active days, mimicking the expected decrease in mean BG and TAR, with the corresponding time distributed into higher TBR, TIR, and TITR.
Blood glucose, PI, and RA were auto-scaled to
Causality tests using CCM overcome Granger’s limits for weakly coupled variables. Convergent cross-mapping confirmed measurable causal links from all three inputs to BG (
Nonetheless, the model is valid under the conditions for which it was developed: 30-minute guided aerobic exercise sessions carried out by the study cohort of T1D patients with open-loop insulin pumps. Extrapolation beyond these bounds may yield inaccurate predictions. Interval and resistance exercises, multiple daily injections, and hybrid closed-loop therapies have yet to be modeled. Adding nonlinear exercise filters and individual metabolic parameters could sharpen realism, and an explicit two-way interaction between insulin and PA should replace the current fixed-decay model. Tailoring the model to each patient could also improve its performance.
One notable feature of our approach is that we use the entire dataset to train our generative model. Unlike deterministic predictors, which map inputs to a single target and are judged by test-set accuracy, generative GANs differ, they learn the entire joint distribution and create synthetic samples drawn from that distribution. Thus, classic train/validation/test splits are not well suited. To faithfully capture all the variability and rare events in the data, the generative model benefits from all available examples. Several works in related fields using deep neural networks 35 and GANs,36,37 as well as in diabetes using probabilistic modeling for eating patterns, 38 demonstrate the use of the entire dataset.
This generative approach aligns with the observed intra-patient variability in T1D, where glucose responses vary even with the same inputs. Therefore, our GAN appends a Gaussian noise vector to each insulin-carbohydrate-exercise tuple. This latent encoding captures plausible physiological states, enabling the network to learn the full conditional distribution
We projected glucose profiles onto a 3D t-SNE map, where nearby points exhibit similar short-term evolution. While the absolute geometry of the clouds (loops and arcs) primarily reflects the natural diurnal rhythm, what matters is how the two point clouds co-occupy regions of that shape. The two point clouds overlap with comparable density across the manifold, confirming that the GAN preserves the underlying temporal structure.
Future work will train equivalent modules for the interval and resistance-training records of the T1DEXI dataset, enabling comprehensive simulation across multiple exercise modalities.
Conclusions
We present the first data-driven virtual twin that incorporates aerobic exercise, insulin, and carbohydrate intake for individuals with T1D. Trained on 1479 real-world days from the T1DEXI study, our cWGAN learns
Our results confirm that GAN-based virtual twins can represent the intertwined dynamics of insulin, meals, and PA. This provides a scalable foundation for personalized decision support and in silico trials.
Supplemental Material
sj-docx-1-dst-10.1177_19322968251364291 – Supplemental material for Including Aerobic Exercise Into Data-Based Virtual Twins for Glycemic Simulation
Supplemental material, sj-docx-1-dst-10.1177_19322968251364291 for Including Aerobic Exercise Into Data-Based Virtual Twins for Glycemic Simulation by Oriol Bustos, Omer Mujahid, Iván Contreras, Aleix Beneyto and Josep Vehi in Journal of Diabetes Science and Technology
Footnotes
Acknowledgements
None.
Abbreviations
BG, blood glucose; CGM, continuous glucose monitoring; CV, coefficient of variation; cWGAN, conditional Wasserstein generative adversarial network; GANs, generative adversarial networks; HR, heart rate; PA, physical activity; PI, plasma insulin; RA, rate of appearance of carbohydrates; T1D, type 1 diabetes; TAR, time above range; TBR, time below range; TIR, time in range; TITR, time in tight range; t-SNE, t-distributed stochastic neighbor embedding.
Declaration of Conflicting Interests
The author(s) declared no potential conflicts of interest with respect to the research, authorship, and/or publication of this article.
Funding
The author(s) disclosed receipt of the following financial support for the research, authorship, and/or publication of this article: This work was funded by grant 2024-PROD-00051 funded by AGAUR, by grant PID2022-137723OB-C22 funded by MCIN/AEI/ and by 2021 SGR 01598 funded by the Autonomous Government of Catalonia.
Supplemental Material
Supplemental material for this article is available online.
References
Supplementary Material
Please find the following supplemental material available below.
For Open Access articles published under a Creative Commons License, all supplemental material carries the same license as the article it is associated with.
For non-Open Access articles published, all supplemental material carries a non-exclusive license, and permission requests for re-use of supplemental material or any part of supplemental material shall be sent directly to the copyright owner as specified in the copyright notice associated with the article.