
Abstract
Background:
Continuous glucose monitoring (CGM) has the potential to improve glucose control in critically ill patients, provided that its trend accuracy is reliable. We evaluated the trend accuracy of a subcutaneous CGM system (Dexcom G6) compared with intermittent arterial blood gas (ABG) measurements in intensive care unit (ICU) patients receiving insulin.
Methods:
We enrolled 40 adult ICU patients receiving insulin and organ-supportive therapies. We assessed trend accuracy using the Rate Error Grid Analysis (R-EGA) and the Diabetes Technology Society Trend Accuracy Matrix (DTS-TAM), overall, across different ABG levels, and over time from CGM initiation.
Results:
A total of 2701 paired CGM-ABG trends were analyzed, with a median (IQR) time difference between readings of 83 (65-125) minutes. Overall, 99.7% of trends were classified in R-EGA Zone A and 0.3% in Zone B. On DTS-TAM analysis, 98.6% of trends fell in the No Risk category, while 1.7% were in the adjacent Mild-to-Moderate Risk categories. Trends were more frequently categorized as Mild-to-Moderate Risk when ABG values were <100 mg/dL (5.56 mmol/L) (3.6%) compared with 100 to 180 mg/dL (5.56 to 10 mmol/L) (1.3%) or >180 mg/dL (10 mmol/L) (1.6%). During the first 24 hours of CGM use, 2.9% of trends fell into the Mild-to-Moderate Risk categories, compared with 0.9% beyond 24 hours.
Conclusions:
In critically ill patients receiving insulin, CGM demonstrated high overall trend accuracy relative to ABG. Trend accuracy was reduced at lower glucose ranges and during the initial 24 hours of CGM use.
Introduction
Over the past decades, continuous glucose monitoring (CGM) has emerged as a standard tool for managing glucose levels and guiding insulin therapy in individuals with diabetes. The CGM devices provide near-continuous glucose data, allowing better glycemic control and reduction of glucose variability and hypoglycemic events.1-3 Despite its established utility in diabetes management, CGM has not been adopted as a standard monitoring tool in critically ill patients receiving insulin in the intensive care unit (ICU).4,5
Glucose management in the ICU is inherently challenging due to the dynamic nature of critical illness. Factors such as rapid shifts in metabolic demand, the administration of hyperglycemic drugs, and varying nutritional inputs necessitate frequent adjustments to insulin therapy to maintain glucose levels within a target range. Arterial blood gas (ABG) measurements remain the gold standard for glucose monitoring in ICU settings, offering high accuracy. However, these measurements are intermittent and labor-intensive, leaving critical windows of glycemic fluctuation unmonitored. The CGM could potentially fill this gap by providing continuous data and enabling earlier interventions.
Existing studies evaluating CGM in ICU settings have focused on point accuracy, defined as agreements between CGM values and reference glucose measurements. These studies have reported suboptimal point accuracy in certain scenarios, especially during the first hours after CGM initiation, during high-dose vasopressor therapy, and when blood glucose levels deviate significantly from the target range.6-8 While such limitations may hinder CGM use for standalone glucose monitoring, the ICU setting offers an opportunity to complement CGM with periodic ABG validation. This approach could mitigate concerns over point accuracy, provided the CGM trend accuracy—the ability to reliably detect glucose directionality and rate of change (RoC)—is robust.
Trend accuracy is particularly critical in the ICU, where rapid and unpredictable glucose shifts are common. Reliable CGM trend data could enable early warnings for impending hypo- or hyperglycemia, providing an additional layer of safety and improving glucose management protocols. Despite its clinical relevance, CGM trend accuracy has not been systematically assessed in the ICU setting. Consequently, we conducted a secondary analysis of a prospective study to evaluate the trend accuracy of a modern CGM device compared to intermittent ABG measurements in critically ill patients, overall, across different ABG intervals, and over time from CGM initiation.
Methods
The study was performed in accordance with the ethical standards laid down in the 1964 Declaration of Helsinki and its later amendment. The Swedish Ethical Review Authority approved the study (approval numbers 2020-03513 and 2024-01327-02). Delayed informed consent was obtained from the patient or next of kin. The original study was registered at https://clinicaltrials.gov (NCT05255783).
Study Design
We conducted a secondary analysis of a prospective, observational study of 40 adult (≥18 years) patients admitted to ICU at the Karolinska University Hospital, Stockholm, Sweden, between November 11, 2021, and May 5, 2023. Patients were included if they had an indwelling arterial catheter in situ, had intravenous insulin infusion commenced in the previous 6 hours due to blood glucose >180 mg/dL (10 mmol/L), received vasopressor infusion, invasive mechanical ventilation, and were expected to stay in the ICU at least two days. 6
Glucose Monitoring and Control
For patients meeting the inclusion criteria, the factory-calibrated Dexcom G6 CGM sensor (Dexcom Inc, San Diego, California) was applied on the abdomen and activated by a research nurse. After an initial warm-up period of 2 hours, the sensor began transmitting CGM values to a handheld receiver. No manual sensor calibrations were performed during the study period. Routine ABG was measured on the Radiometer ABL 800 Flex analyzer (Radiometer Medical, Brønshøj, Denmark). 9 Insulin therapy was guided by ABG levels to a target level between 108 and 180 mg/dL (6 and 10 mmol/L). While bedside nurses determined the timing of ABG analyses, they were advised, per the local clinical protocol, to perform them hourly during insulin therapy.
Data Collection
Each time an arterial blood sample was collected for ABG analysis, the corresponding CGM level was recorded, generating a data set with paired ABG and CGM values. Demographic data, physiological and biochemical parameters, and treatment variables were recorded as previously described. 6
Trend Accuracy Analysis
We assessed trend accuracy according to the Rate Error Grid Analysis (R-EGA) and the Diabetes Technology Society Trend Accuracy Matrix (DTS-TAM).10,11 The RoC between CGM values and between ABG values, respectively, was calculated according to the following equation:

in which Glun is the nth glucose reading recorded at time tn and Glun – 1 is the preceding glucose reading recorded at time tn – 1. We decided a priori to exclude RoCs with a time difference (tn − tn – 1) greater than 180 minutes. The R-EGA plot compares CGM RoCs with ABG RoCs and is divided into five zones, in which zones A and B indicate accurate trends or benign errors, zone C indicates rapid CGM RoC but slow ABG RoC, zone D indicates rapid ABG RoC not detected by CGM, and zone E indicates that CGM and ABG RoC go in opposite direction. 10
The DTS-TAM uses a 5 × 5 matrix to analyze the concurrence of CGM RoC with reference glucose RoC in the following five categories: <−2 mg/dL/min, −2 to <−1 mg/dL/min, −1 to +1 mg/dL, >+1 to +2 mg/dL/min, and >+2 mg/dL/min. The matrix groups CGM-trends into five levels of clinical risk: no risk (CGM trend same as reference trend), mild risk (CGM underestimates reference trend by one to three categories), moderate risk (CGM overestimates reference trend by one to three categories), high risk (CGM underestimates reference trend by three to four categories), and extreme risk (CGM overestimates reference trend by three to four categories). The matrix also emphasizes the higher clinical risk of CGM overestimations compared to underestimations, especially at glucose levels below 100 mg/dL (5.56 mmol/L), where hypoglycemia poses significant danger. 11
We assessed the DTS-TAM for the entire range of ABG values, for ABG values below 100 mg/dL (5.56 mmol/L), for ABG values from 100 to 180 mg/dL (5.56 to 10.0 mmol/L), and for ABG values above 180 mg/dL (10.0 mmol/L). Since point accuracy (Mean Absolute Relative Difference [MARD]) improves after 24 to 48 hours since sensor initiation,6,12 we analyzed the DTS-TAM during the first 24 hours and after more than 24 hours since CGM start, respectively. As a sensitivity analysis, the DTS-TAM assessment across the full range of ABG values was limited to trends with a sampling interval of 15 to 45 minutes, as previously recommended. 11 For completeness, we also present point accuracy using DTS Error Grids 11 for all CGM/ABG data pairs, as well as for subsets stratified by ABG level, time since sensor start, and sampling intervals of 15 to 45 minutes.
We analyzed data using STATA version 16.1 (StataCorp LLC, College Station, Texas). Data were summarized as n (%), median (IQR), or as median with 95% confidence interval (CI) obtained using a binomial method.
Results
Patients
We included 40 patients with a median (IQR) age of 71 (63-75) years. Overall, 23 (57.5%) were males and 18 (45.0%) had known diabetes. All patients received mechanical ventilation and vasopressor infusion. All but one patient received intravenous insulin infusion. Detailed patient and process of care characteristics were recently published. 6 We collected 2946 paired CGM and ABG readings obtained from the 40 patients, which generated 2906 RoCs. We excluded two duplicate RoCs and 203 RoCs with a time difference of more than 180 minutes between readings. Therefore, we included 2701 RoCs with a median (IQR) time between consecutive samples of 83 (65-125) minutes (Supplemental Figure S1). A total of 110 (4.1%) ABG values were below 100 mg/dL (5.56 mmol/L), 2146 (79.5%) were between 100 and180 mg/dL (5.56-10.0 mmol/L), and 445 (16.5%) were above 180 mg/dL (10.0 mmol/L).
Trend Accuracy
The median (95% CI) absolute difference between CGM and ABG RoCs was 0.089 (0.085-0.093) mg/dL/min (0.0049 [0.0047-0.0052] mmol/L/min). On R-EGA analysis, 99.7% of RoCs were in zone A and 0.3% in zone B (Figure 1).
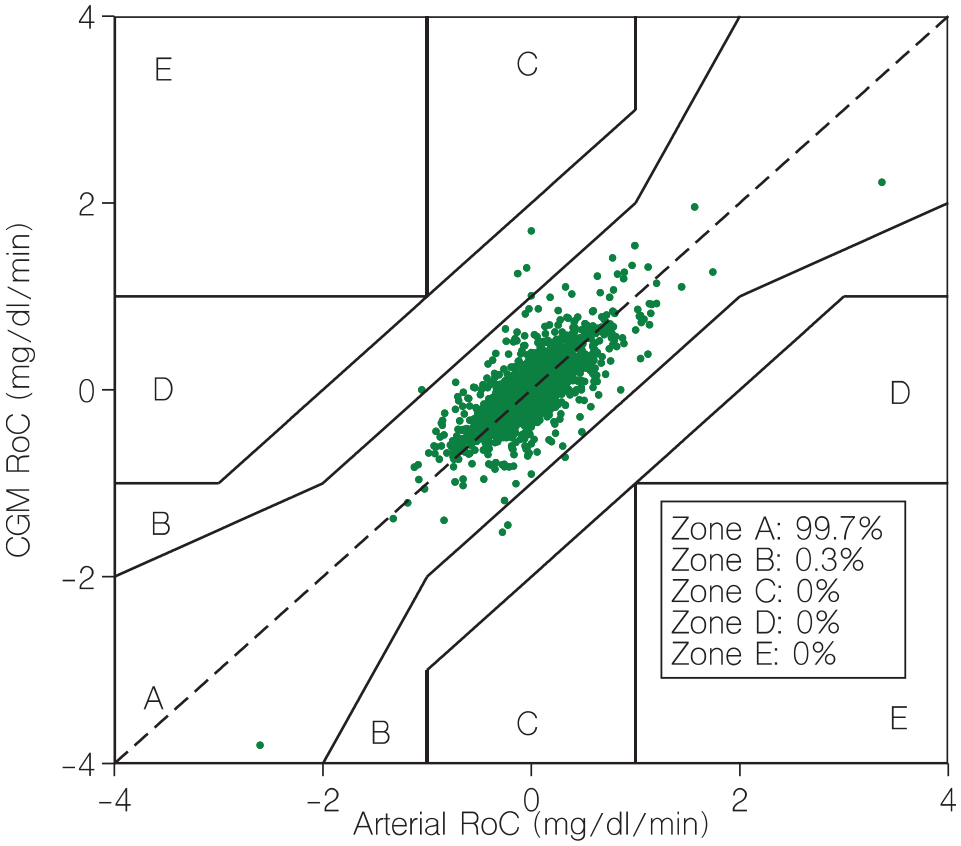
Rate error grid. CGM, continuous glucose monitor; RoC, rate of change. Zone A indicates accurate trends. Zone B indicates benign errors. Zone C indicates rapid CGM RoC but slow arterial RoC. Zone D indicates rapid arterial RoC not detected by CGM. Zone E indicates that CGM and arterial RoC go in opposite direction.
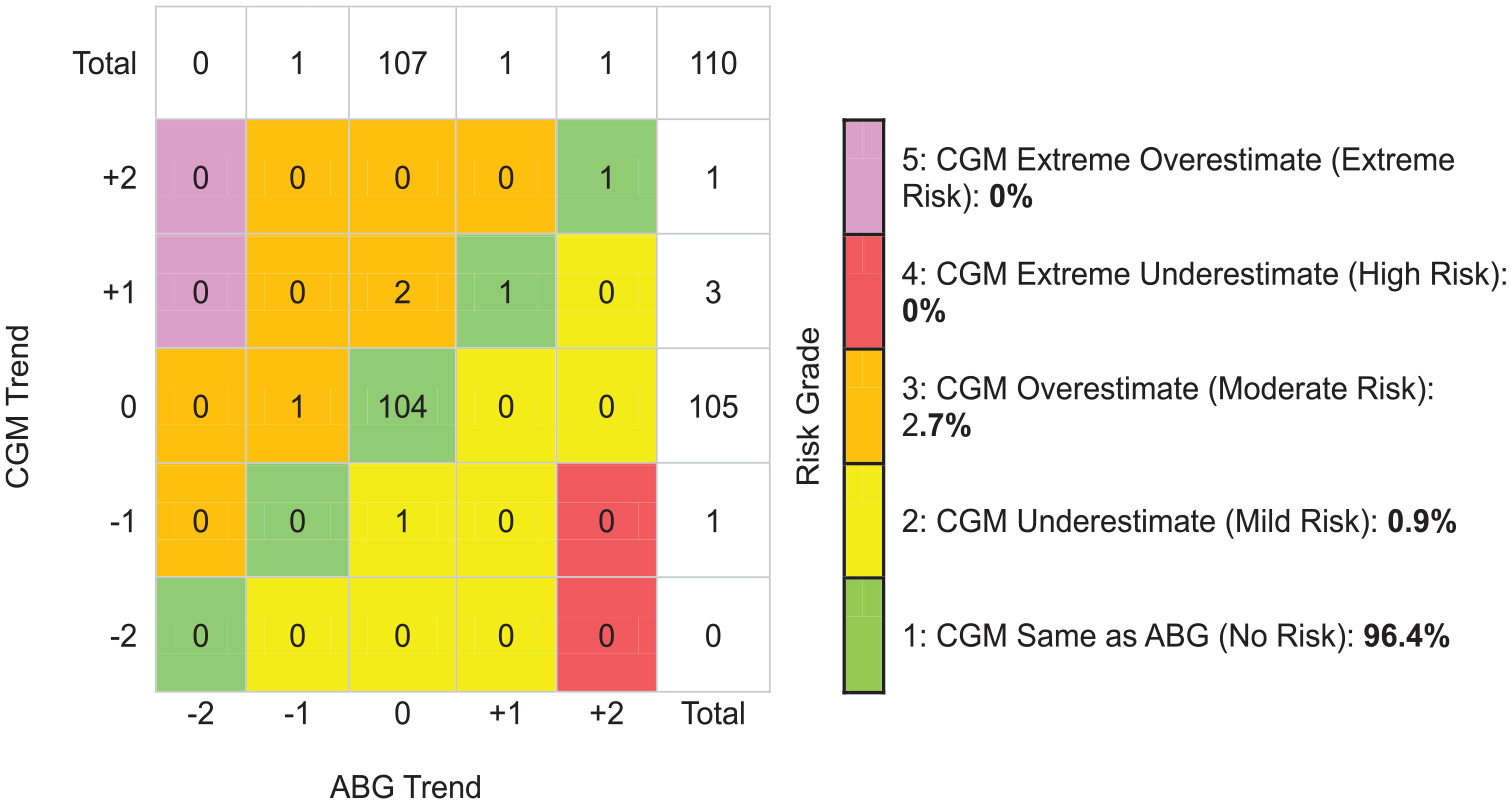
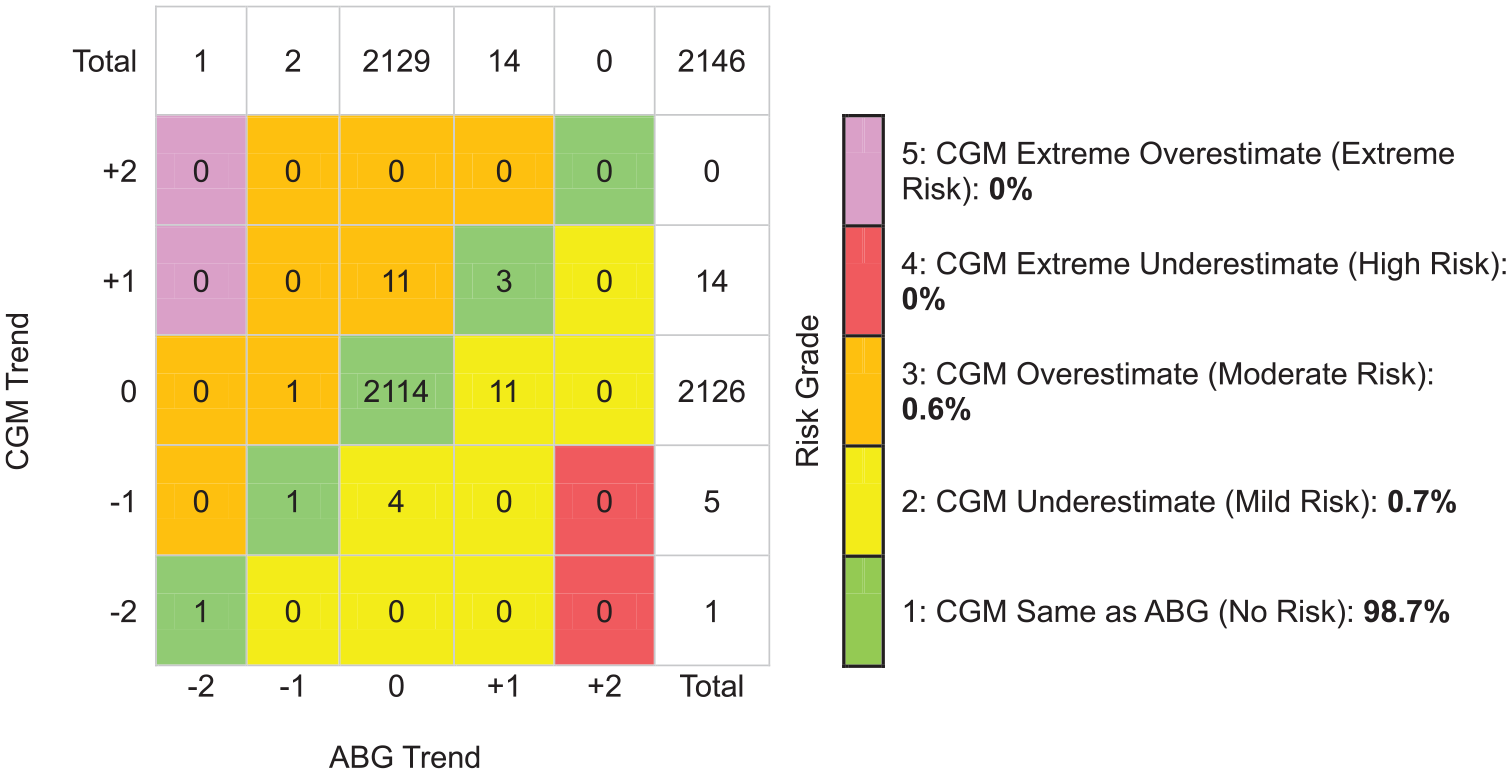
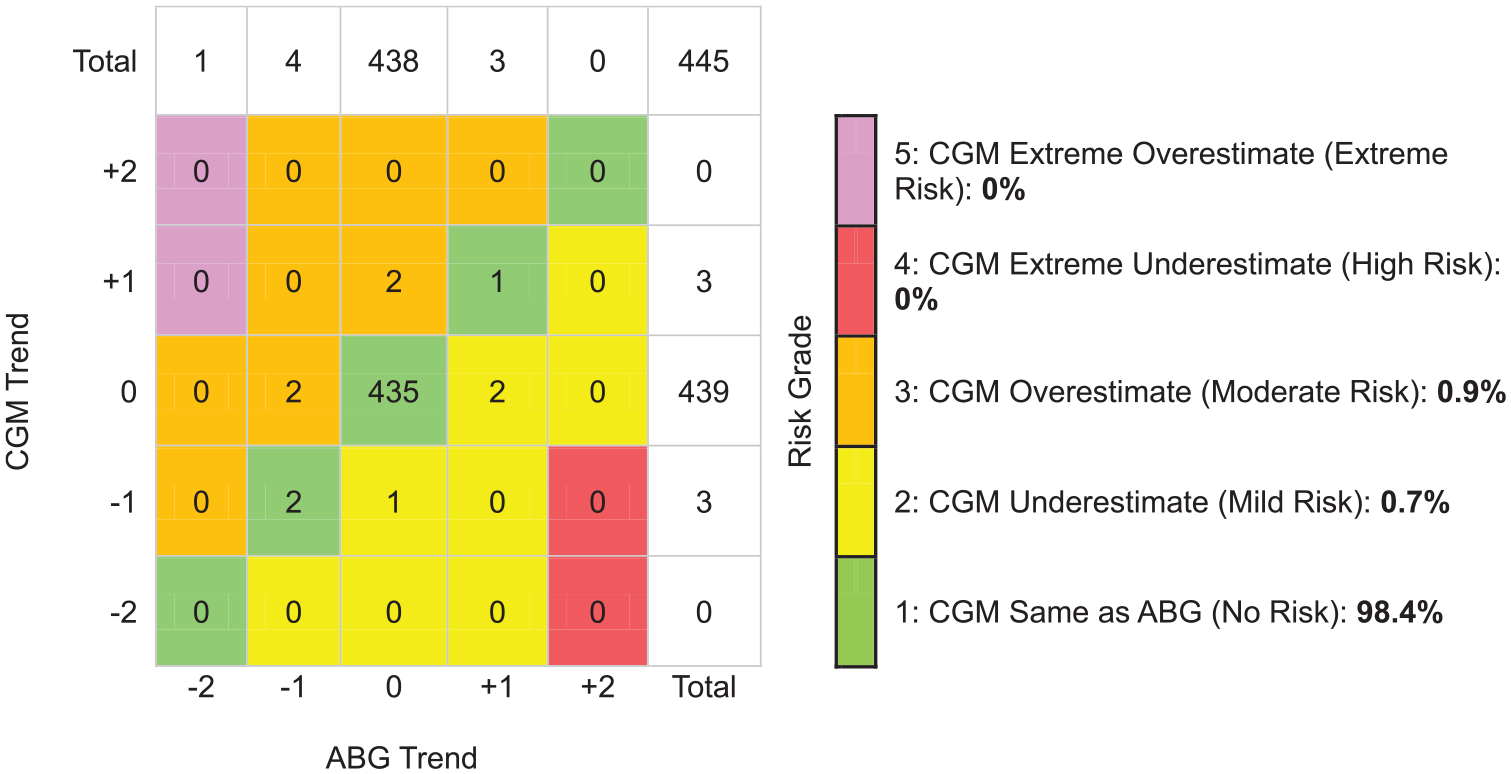
On DTS-TAM analysis, assessing the entire glucose range, 98.6% of trend readings had similar glucose directionality and RoC (Risk Grade 1). The CGM underestimated (Mild Risk Grade 2) or overestimated (Moderate Risk Grade 3) the ABG trend by 1 category in 19 (0.7%) instances each. No trend readings were found in High-Risk Grade 4 or Extreme Risk Grade 5 (Figure 2). For ABG values below 100 mg/dL (5.56 mmol/L), 2.7% of trend readings were found in Moderate Risk Grade 3 and 96.4% in the No Risk zone (Figure 3). The proportion of trend readings found in the No Risk zone was similar when assessing ABG values between 100 and 180 mg/dL (5.56-10.0 mmol/L) and ABG values above 180 mg/dL (10.0 mmol/L) (Figures 4 and 5). On DTS-TAM analysis restricted to the first 24 hours after sensor initiation, 97.1% of trend readings were found in the No Risk zone (Supplemental Figure S2). Beyond 24 hours, 99.1% of trend readings were found in the No Risk zone (Supplemental Figure S3). In the sensitivity analysis, restricted to 155 trends with a sampling interval of 15 to 45 minutes, 91.6% of trend readings were found in the No Risk zone, 4.5% were found in the Mild Risk zone, and 3.9% were found in the Moderate Risk zone (Supplemental Figure S4). Excluded trends with a time difference greater than 180-minute data were all contained in the No Risk zone (data not shown). Point accuracy according to DTS Error Grid analysis for all CGM/ABG data pairs, as well as for subsets stratified by ABG level, time since sensor start, and sampling intervals of 15 to 45 minutes, is shown in Supplemental Figure S5-S11.

Trend accuracy matrix (Diabetes Technology Society) for the entire range of arterial glucose values. +2 indicates that glucose is rising >2 mg/dL/min (0.11 mmol/L/min). +1 indicates that glucose is rising >1 mg/dL/min (0.056 mmol/L/min) and ≤2 mg/dL/min (0.11 mmol/L/min). 0 (zero) indicates that glucose changes ≤1 mg/dL/min (0.056 mmol/L/min). −1 indicates that glucose is falling >1 mg/dL/min (0.056 mmol/L/min) and ≤2 mg/dL/min (0.11 mmol/L/min). −2 indicates that glucose is falling >2 mg/dL/min (0.11 mmol/L/min). Abbreviations: ABG, arterial blood glucose; CGM, continuous glucose monitor.
Trend accuracy matrix (Diabetes Technology Society) for arterial glucose values below 100 mg/dL (5.56 mmol/L). +2 indicates that glucose is rising >2 mg/dL/min (0.11 mmol/L/min). +1 indicates that glucose is rising >1 mg/dL/min (0.056 mmol/L/min) and ≤2 mg/dL/min (0.11 mmol/L/min). 0 (zero) indicates that glucose changes ≤1mg/dL/min (0.056 mmol/L/min). −1 indicates that glucose is falling >1 mg/dL/min (0.056 mmol/L/min) and ≤2 mg/dL/min (0.11 mmol/L/min). −2 indicates that glucose is falling >2 mg/dL/min (0.11 mmol/L/min). Abbreviations: ABG, arterial blood glucose; CGM, continuous glucose monitor.
Trend accuracy matrix (Diabetes Technology Society) for arterial glucose values from 100 to 180 mg/dL (5.56 to 10.0 mmol/L). +2 indicates that glucose is rising >2 mg/dL/min (0.11 mmol/L/min). +1 indicates that glucose is rising >1 mg/dL/min (0.056 mmol/L/min) and ≤2 mg/dL/min (0.11 mmol/L/min). 0 (zero) indicates that glucose changes ≤1 mg/dL/min (0.056 mmol/L/min). −1 indicates that glucose is falling >1 mg/dL/min (0.056 mmol/L/min) and ≤2 mg/dL/min (0.11 mmol/L/min). −2 indicates that glucose is falling >2 mg/dL/min (0.11 mmol/L/min). Abbreviations: ABG, arterial blood glucose; CGM, continuous glucose monitor.
Trend accuracy matrix (Diabetes Technology Society) for reference values above 180 mg/dL (10.0 mmol/L). +2 indicates that glucose is rising >2 mg/dL/min (0.11 mmol/L/min). +1 indicates that glucose is rising >1 mg/dL/min (0.056 mmol/L/min) and ≤2 mg/dL/min (0.11 mmol/L/min). 0 (zero) indicates that glucose changes ≤1 mg/dL/min (0.056 mmol/L/min). −1 indicates that glucose is falling >1 mg/dL/min (0.056 mmol/L/min) and ≤2 mg/dL/min (0.11 mmol/L/min). −2 indicates that glucose is falling >2 mg/dL/min (0.11 mmol/L/min). Abbreviations: ABG, arterial blood glucose; CGM, continuous glucose monitor.
Discussion
Key Findings
We conducted a secondary analysis of a prospective, observational study to investigate trend accuracy of CGM compared with ABG in critically ill ICU patients. We observed high concurrence between CGM and ABG trends, as indicated by 99.7% of paired trends contained within R-EGA zone A and 98.6% of CGM trends having similar glucose directionality and RoC as ABG trends on Trend Accuracy Matrix analysis. However, we observed somewhat lower trend accuracy when ABG was below 100 mg/dL (5.56 mmol/L), and during the first 24 hours after CGM initiation.
Relationship With Previous Studies
To our knowledge, this is the first study to assess the trend accuracy of CGM against ABG in critically ill patients. A previous study by Leopold et al 13 evaluated intravenous, microdialysis-based CGM in 11 ICU patients without diabetes, comparing readings with ABG values obtained every 15 minutes. Among nearly 600 paired RoCs, 96.4% fell within R-EGA zone A, and 3.3% were in zone B. Our findings suggest superior trend accuracy with a modern CGM device, as evidenced by 99.7% of RoCs in zone A and only 0.3% in zone B. However, direct comparison with that study and ours is challenging due to key methodological differences (different CGM technologies and glucose control protocols).
The assessment of CGM trend accuracy has mainly been conducted outside the ICU setting. A recent review by Freckmann et al 14 found that only 27 of 129 studies published between 2002 and 2022 evaluated trend or rate accuracy, with most focusing on older devices that are no longer available. One notable study by Wadwa et al 15 examined the Dexcom G6 system in 262 outpatients with diabetes, comparing nearly 21 000 paired CGM and venous blood glucose RoCs collected in 15-minute intervals. They reported that 66% of RoCs fell into the same category and 97% into the same or adjacent category, compared to 98.6% and 100%, respectively, in our study. This discrepancy may be attributable to differences in study design. In particular, Wadwa et al used glucose manipulation protocols that potentially induced large glucose fluctuations. Since CGM typically exhibits an average lag of approximately 5 minutes relative to blood glucose, such fluctuations, combined with frequent short-interval measurements, could have affected both point and trend accuracy.
A more recent study from the Diabetes Technology Society 11 analyzed 3185 RoCs collected at 15- to 45-minute intervals in 75 outpatients with diabetes. On DTS-TAM analysis, 72.7% of trends were classified as No Risk, 14.3% as Mild Risk, and 13.0% as Moderate Risk. Unlike our findings, their study reported lower trend accuracy (69.3% No Risk) at blood glucose levels >180 mg/dL (10 mmol/L) and higher trend accuracy (81.4% No Risk) at glucose levels <100 mg/dL (5.56 mmol/L). Notably, 1% of readings in the lower glucose strata fell into the Extreme Risk category due to underestimation of a rapid decline in reference glucose.
Our findings contribute to the growing body of evidence on CGM trend accuracy and suggest that modern CGM systems in critically ill patients may achieve trend performance similar to that observed in outpatients with diabetes.
Implications of Study Findings
Our findings suggest that CGM reliably detects glucose directionality and RoC when compared with ABG during insulin infusion therapy in the ICU. However, trend accuracy may be slightly lower during the first 24 hours after sensor initiation compared to later periods. This aligns with our previous observation that point accuracy improves over time. 6 If the CGM initially overestimates or underestimates arterial glucose but gradually converges toward the true value, early trend accuracy may appear less precise. This does not necessarily indicate poor sensor performance but rather reflects a stabilization phase in which the CGM is adapting to the physiological environment before achieving optimal accuracy.
Although based on a limited sample size, our findings also suggest slightly lower trend accuracy for blood glucose values below 100 mg/dL (5.56 mmol/L). Notably, in this range, the CGM overestimated the arterial RoC in 2.7% of instances, meaning the CGM readings indicated that glucose was stable or increasing when arterial blood measurements showed that glucose was actually decreasing. This carries the risk that insulin infusion may be continued when it should instead be reduced or discontinued, potentially leading to hypoglycemia.
Given the uncertainty regarding both point and rate accuracy, adjunctive ABG measurements should be performed during the first 24 hours after CGM initiation and when CGM values fall below 108 mg/dL (6 mmol/L).
Strengths and Limitations
Our study has several strengths. We analyzed more than 2700 prospectively recorded, paired CGM-ABG trends during insulin and organ-supportive therapies over a period of up to 10 days in the ICU. This extensive data set provided important insights into CGM performance at different glucose levels and over time. In addition, we assessed trend accuracy using methodologies recently recommended by the Diabetes Technology Society, 11 ensuring our analysis aligns with the latest standards in CGM evaluation.
We acknowledge several limitations. As a single-center study, the generalizability of our findings may be limited. Nevertheless, the study was conducted in a large tertiary hospital with a diverse ICU population, including patients with multiple organ failure, making it likely to reflect similar ICU populations in other high-income health care settings. Another consideration is that we applied consensus-based blood glucose targets, meaning that caution is warranted when extrapolating our results to ICUs that use different glycemic control strategies. Finally, we did not collect paired CGM-ABG data at standardized 15- to 45-minute intervals, as previously recommended for assessing trend accuracy. 11 Our sensitivity analysis suggests that a wider sampling interval may slightly overestimate trend accuracy. However, even when restricting the analysis to trends with a 15- to 45-minute sampling interval, accuracy remained comparable to that observed in outpatients with type 1 diabetes.
Conclusions
In this secondary analysis of ICU patients receiving insulin and organ-supportive therapies, CGM demonstrated high trend accuracy compared with routine ABG measurements. However, due to potentially lower trend accuracy during the first 24 hours after CGM initiation and when CGM values fall below 108 mg/dL (6 mmol/L), ABG measurements should be used to confirm CGM values in these situations.
Supplemental Material
sj-docx-1-dst-10.1177_19322968251358830 – Supplemental material for Accuracy of Glucose Trends by Subcutaneous Continuous Monitoring vs Intermittent Arterial Measurements in Critically Ill Patients
Supplemental material, sj-docx-1-dst-10.1177_19322968251358830 for Accuracy of Glucose Trends by Subcutaneous Continuous Monitoring vs Intermittent Arterial Measurements in Critically Ill Patients by Ola Friman, Marcus Lind, Ragnar Thobaben, Pia Zetterqvist, Anders Perner, Olav Rooijackers, Anders Oldner and Johan Mårtensson in Journal of Diabetes Science and Technology
Supplemental Material
sj-docx-10-dst-10.1177_19322968251358830 – Supplemental material for Accuracy of Glucose Trends by Subcutaneous Continuous Monitoring vs Intermittent Arterial Measurements in Critically Ill Patients
Supplemental material, sj-docx-10-dst-10.1177_19322968251358830 for Accuracy of Glucose Trends by Subcutaneous Continuous Monitoring vs Intermittent Arterial Measurements in Critically Ill Patients by Ola Friman, Marcus Lind, Ragnar Thobaben, Pia Zetterqvist, Anders Perner, Olav Rooijackers, Anders Oldner and Johan Mårtensson in Journal of Diabetes Science and Technology
Supplemental Material
sj-docx-11-dst-10.1177_19322968251358830 – Supplemental material for Accuracy of Glucose Trends by Subcutaneous Continuous Monitoring vs Intermittent Arterial Measurements in Critically Ill Patients
Supplemental material, sj-docx-11-dst-10.1177_19322968251358830 for Accuracy of Glucose Trends by Subcutaneous Continuous Monitoring vs Intermittent Arterial Measurements in Critically Ill Patients by Ola Friman, Marcus Lind, Ragnar Thobaben, Pia Zetterqvist, Anders Perner, Olav Rooijackers, Anders Oldner and Johan Mårtensson in Journal of Diabetes Science and Technology
Supplemental Material
sj-docx-2-dst-10.1177_19322968251358830 – Supplemental material for Accuracy of Glucose Trends by Subcutaneous Continuous Monitoring vs Intermittent Arterial Measurements in Critically Ill Patients
Supplemental material, sj-docx-2-dst-10.1177_19322968251358830 for Accuracy of Glucose Trends by Subcutaneous Continuous Monitoring vs Intermittent Arterial Measurements in Critically Ill Patients by Ola Friman, Marcus Lind, Ragnar Thobaben, Pia Zetterqvist, Anders Perner, Olav Rooijackers, Anders Oldner and Johan Mårtensson in Journal of Diabetes Science and Technology
Supplemental Material
sj-docx-3-dst-10.1177_19322968251358830 – Supplemental material for Accuracy of Glucose Trends by Subcutaneous Continuous Monitoring vs Intermittent Arterial Measurements in Critically Ill Patients
Supplemental material, sj-docx-3-dst-10.1177_19322968251358830 for Accuracy of Glucose Trends by Subcutaneous Continuous Monitoring vs Intermittent Arterial Measurements in Critically Ill Patients by Ola Friman, Marcus Lind, Ragnar Thobaben, Pia Zetterqvist, Anders Perner, Olav Rooijackers, Anders Oldner and Johan Mårtensson in Journal of Diabetes Science and Technology
Supplemental Material
sj-docx-4-dst-10.1177_19322968251358830 – Supplemental material for Accuracy of Glucose Trends by Subcutaneous Continuous Monitoring vs Intermittent Arterial Measurements in Critically Ill Patients
Supplemental material, sj-docx-4-dst-10.1177_19322968251358830 for Accuracy of Glucose Trends by Subcutaneous Continuous Monitoring vs Intermittent Arterial Measurements in Critically Ill Patients by Ola Friman, Marcus Lind, Ragnar Thobaben, Pia Zetterqvist, Anders Perner, Olav Rooijackers, Anders Oldner and Johan Mårtensson in Journal of Diabetes Science and Technology
Supplemental Material
sj-docx-5-dst-10.1177_19322968251358830 – Supplemental material for Accuracy of Glucose Trends by Subcutaneous Continuous Monitoring vs Intermittent Arterial Measurements in Critically Ill Patients
Supplemental material, sj-docx-5-dst-10.1177_19322968251358830 for Accuracy of Glucose Trends by Subcutaneous Continuous Monitoring vs Intermittent Arterial Measurements in Critically Ill Patients by Ola Friman, Marcus Lind, Ragnar Thobaben, Pia Zetterqvist, Anders Perner, Olav Rooijackers, Anders Oldner and Johan Mårtensson in Journal of Diabetes Science and Technology
Supplemental Material
sj-docx-6-dst-10.1177_19322968251358830 – Supplemental material for Accuracy of Glucose Trends by Subcutaneous Continuous Monitoring vs Intermittent Arterial Measurements in Critically Ill Patients
Supplemental material, sj-docx-6-dst-10.1177_19322968251358830 for Accuracy of Glucose Trends by Subcutaneous Continuous Monitoring vs Intermittent Arterial Measurements in Critically Ill Patients by Ola Friman, Marcus Lind, Ragnar Thobaben, Pia Zetterqvist, Anders Perner, Olav Rooijackers, Anders Oldner and Johan Mårtensson in Journal of Diabetes Science and Technology
Supplemental Material
sj-docx-7-dst-10.1177_19322968251358830 – Supplemental material for Accuracy of Glucose Trends by Subcutaneous Continuous Monitoring vs Intermittent Arterial Measurements in Critically Ill Patients
Supplemental material, sj-docx-7-dst-10.1177_19322968251358830 for Accuracy of Glucose Trends by Subcutaneous Continuous Monitoring vs Intermittent Arterial Measurements in Critically Ill Patients by Ola Friman, Marcus Lind, Ragnar Thobaben, Pia Zetterqvist, Anders Perner, Olav Rooijackers, Anders Oldner and Johan Mårtensson in Journal of Diabetes Science and Technology
Supplemental Material
sj-docx-8-dst-10.1177_19322968251358830 – Supplemental material for Accuracy of Glucose Trends by Subcutaneous Continuous Monitoring vs Intermittent Arterial Measurements in Critically Ill Patients
Supplemental material, sj-docx-8-dst-10.1177_19322968251358830 for Accuracy of Glucose Trends by Subcutaneous Continuous Monitoring vs Intermittent Arterial Measurements in Critically Ill Patients by Ola Friman, Marcus Lind, Ragnar Thobaben, Pia Zetterqvist, Anders Perner, Olav Rooijackers, Anders Oldner and Johan Mårtensson in Journal of Diabetes Science and Technology
Supplemental Material
sj-docx-9-dst-10.1177_19322968251358830 – Supplemental material for Accuracy of Glucose Trends by Subcutaneous Continuous Monitoring vs Intermittent Arterial Measurements in Critically Ill Patients
Supplemental material, sj-docx-9-dst-10.1177_19322968251358830 for Accuracy of Glucose Trends by Subcutaneous Continuous Monitoring vs Intermittent Arterial Measurements in Critically Ill Patients by Ola Friman, Marcus Lind, Ragnar Thobaben, Pia Zetterqvist, Anders Perner, Olav Rooijackers, Anders Oldner and Johan Mårtensson in Journal of Diabetes Science and Technology
Footnotes
Acknowledgements
None.
Abbreviations
ABG, arterial blood gas; CGM, continuous glucose monitoring; DTS-TAM, Diabetes Technology Society Trend Accuracy Matrix; ICU, intensive care unit; MARD, mean absolute relative difference; R-EGA, rate error grid analysis; RoC, rate of change.
Declaration of Conflicting Interests
The author(s) declared the following potential conflicts of interest with respect to the research, authorship, and/or publication of this article: M.L. has been a consultant for AstraZeneca, Boehringer Ingelheim, Eli Lilly, Nordicinfu Care, and Novo Nordisk and received research grants from Eli Lilly and Novo Nordisk, all outside the submitted work. All other authors have nothing to declare.
Funding
The author(s) disclosed receipt of the following financial support for the research, authorship, and/or publication of this article: J.M. received financial support through the regional agreement on medical and clinical research (ALF) between Stockholm County Council and Karolinska Institutet. The CGM equipment was provided by Dexcom free of charge. However, Dexcom was not involved in the study design, study execution or interpretation, or reporting of study results.
Supplemental Material
Supplemental material for this article is available online.
References
Supplementary Material
Please find the following supplemental material available below.
For Open Access articles published under a Creative Commons License, all supplemental material carries the same license as the article it is associated with.
For non-Open Access articles published, all supplemental material carries a non-exclusive license, and permission requests for re-use of supplemental material or any part of supplemental material shall be sent directly to the copyright owner as specified in the copyright notice associated with the article.