
Abstract
Background:
Continuous glucose monitoring (CGM) technology has become more prevalent in the intensive care unit (ICU), offering potential benefits of increased safety and reduced workload in glycemic control (GC). The drift and higher point accuracy errors of CGM devices over traditional intermittent blood glucose (BG) measures have so far limited their application in the ICU. This study delineates the trade-offs of performance, safety and workload that CGM sensors provide in GC protocols.
Methods:
Clinical data from 236 patients were used for clinically validated virtual trials. A CGM-enabled version of the STAR GC protocol was used to evaluate the use of guard rails and rolling windows. Safety was assessed through percentage of patients who had a severe hypoglycemic episode (BG < 40 mg/dl) as well as percentage of resampled BG < 72 mg/dl. Performance was assessed as percentage of resampled measurements in the 80-126 mg/dl and the 80-144 mg/dl target bands. Workload was measured by number of manual BG measures per day.
Results:
CGM-enabled versions of STAR decreased the number of required blood draws by up to 74%, while maintaining performance (76.6% BG measurements in the 80-126 mg/dl range vs 62.8% clinically, 87.9% in the 80-144 mg/dl range vs 83.7% clinically) and maintaining patient safety (1.13% of patients experienced a severe hypoglycemic event vs 0.85% clinically, 1.37% of BG measurements were less than 72 mg/dl vs 0.51% clinically).
Conclusion:
CGM sensor traces were reproduced in virtual trials to guide GC. Existing GC protocols such as STAR may need to be adjusted only slightly to gain the benefits of the increased temporal measurements of CGM sensors, through which workload may be significantly decreased while maintaining GC performance and safety.
Continuous glucose monitoring (CGM) technology has improved over the past decade, and has become more prevalent in managing diabetes. New-generation CGM sensors1-6 with less measurement error than previous iterations7,8 have also emerged. These CGM sensors have been used in increasing numbers of studies considering them for glycemic control (GC) in the intensive care unit (ICU).9-20
GC is an important aspect of ICU care, as critically ill patients commonly experience insulin resistance and stress induced hyperglycemia,21-28 which is associated with increased morbidity and mortality.21,23,26,29 While some studies show GC can improve outcomes,22,30,31 others have failed to replicate these results.32-35 A common issue across almost all studies is increased hypoglycemia,36-38 which is associated with increased mortality38-42 and exacerbated by extended intermittent blood glucose measurement intervals.37,43
A recent analysis seeking to rectify these diverse results indicates similar metabolic level and variability between survivors and nonsurvivors, 44 suggesting nonsurvivors do not present a greater control challenge. Thus, discrepancies between studies of outcomes may be a function of the quality and consistency of control achieved, 44 rather than any factor related to patient condition or state as both survivors and nonsurvivors are equally controllable. The frequent measures available from CGM sensors offer significant opportunity to monitor and improve the safety and performance of GC without impacting workload. In particular, they may allow avoidance of hypoglycemia, which may be an important consideration moving forward in the assessment of the merits of GC.
In particular, the hypoglycemia and variable control that plague many studies often occurs where infrequent blood glucose (BG) measurements combine with highly variable changes in patient response to care and complex protocols.45-48 The increased temporal resolution CGM devices provide can monitor real-time BG trends. This monitoring, in turn, allows more rapid treatment response to highly dynamic changes in patient condition and glycemia, 49 by modifying insulin and/or nutrition delivery to avoid hypoglycemic excursions.
Both intravascular (IV) and subcutaneous CGM sensors have been used for measurement to guide GC, either through use of the CGM sensor readings in a GC protocol,9-16 or to observe trends and detect hyper/hypoglycemia while retaining a GC protocol with intermittent measures.17-20 Results have been mixed, with some studies showing good GC results with high percentages of measurements in target bands and low numbers of hypoglycemic incidents.14,18-20 However, the studies with these positive outcomes tend to be small pilot trials on relatively more stable patients.18-20 The mixed results can also be attributed to GC performance being a product of CGM sensor quality, determined by random error and sensor drift, the interaction of the CGM sensor with the specific GC protocol, and the quality of the GC protocol.
CGM devices can reduce nursing GC related workload via automation reducing blood sampling requirements.11,14,48 However, the increased temporal measurement resolution CGM devices provide is still somewhat outweighed by the larger point accuracy errors in these devices due to sensor drift, bias, and noise.1,48,50-55 Trend accuracy is also a critical, often overlooked factor, 56 particularly where alarms indicating hypo- and hyperglycemia are concerned. 57 There is thus a need to model sensor error, which would enable optimal (model-based) design of GC protocols maximizing CGM advantages and minimizing their disadvantages, matching recent consensus statements from medical and industry based working groups.43,58
Interstitial CGM devices have been modeled in the past for testing in virtual environments.48,50,54,55,59,60 However, the previous models have only been used to model CGM measurements during closed-loop control of diabetes in the much less dynamic non–critical care environment. 61 Only one prior study has completely modeled detailed CGM sensor traces in a critical care environment. 1
The GlySure (GlySure Limited, Oxfordshire, UK) CGM device considered in this work is from a newer class of ICU devices measuring BG via an intravenous line, thus avoiding interstitial glucose dynamics. The sensor comprises microporous and dialysis membrane, hydrogel, optical fiber, and a thermocouple, while the glucose detecting chemistry used is a fluorescent diboronic acid receptor, embedded within the hydrogel. Placement of the sensor itself can occur through either a central venous catheter, or a radial artery catheter. 4
This article presents the results of using a recently published IV CGM sensor model, 1 to design and optimize GC with the established, proven STAR GC protocol.62-65 The STAR protocol framework is adapted to utilize the increased temporal resolution of a CGM device within a typical ICU intervention framework. Clinically validated virtual trials are used to test and optimize this combination in silico, and delineate the trade-off of sensor error, safety, performance, and workload.
Methods
Clinically validated virtual trial simulations66,67 are used to assess the performance, safety, and nurse workload associated with using CGM sensors to guide GC in a critical care environment. The process is summarized in Figure 1, where virtual patients are generated from clinical data using the ICING (Intensive Care Insulin-Nutrition-Glucose) model 68 and virtual trial simulation is used to simulate glycemic outcomes. For this study virtual trials use a CGM-enabled version of the STAR insulin-nutrition protocol and a IV CGM sensor model. 1 Multiple cases of CGM-enabled STAR virtual trials were run to test the best combination of safety features via Monte-Carlo simulation.
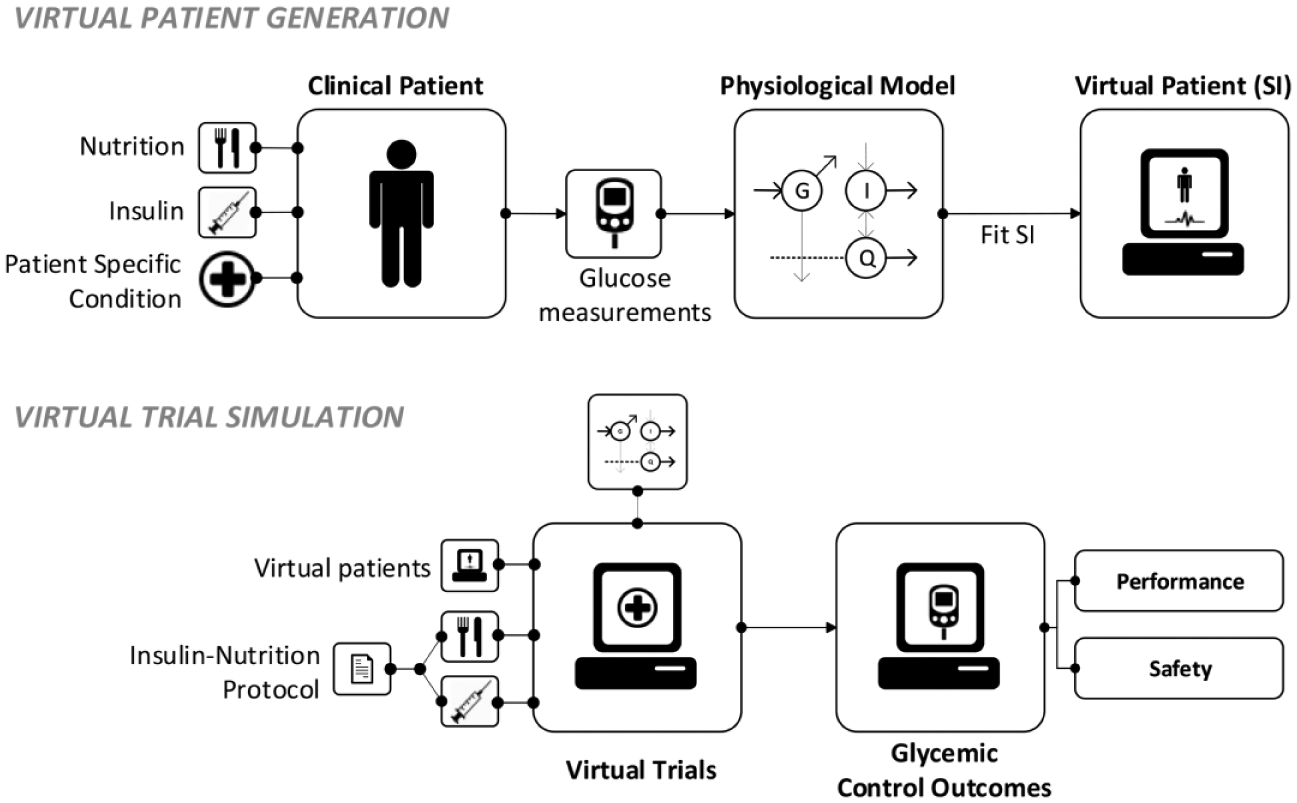
Summary of the virtual patient generation and virtual trial simulation process.
Virtual Patient Generation
Virtual patients consist of a time-varying insulin sensitivity (SI) profile fit from clinical BG, nutrition, and insulin data. This process, summarized in the top box of Figure 1, has been clinically validated on independent data, in clinical use, and in prediction of trial outcomes across multiple cohorts.62,66,67,69 A virtual trial uses this SI profile to simulate BG outcomes for different treatment inputs.
Clinical Data
Virtual patients were generated from a clinical data cohort of 236 patients who received insulin therapy for more than 24 hours under the STAR protocol 65 from June 2011 to May 2015. Patient demographic data are shown in Table 1. Additional data and information for these patients can be found in Stewart et al. 65
Patient Demographic Data for the 236 Clinical Patients Used to Generate Virtual Patients.
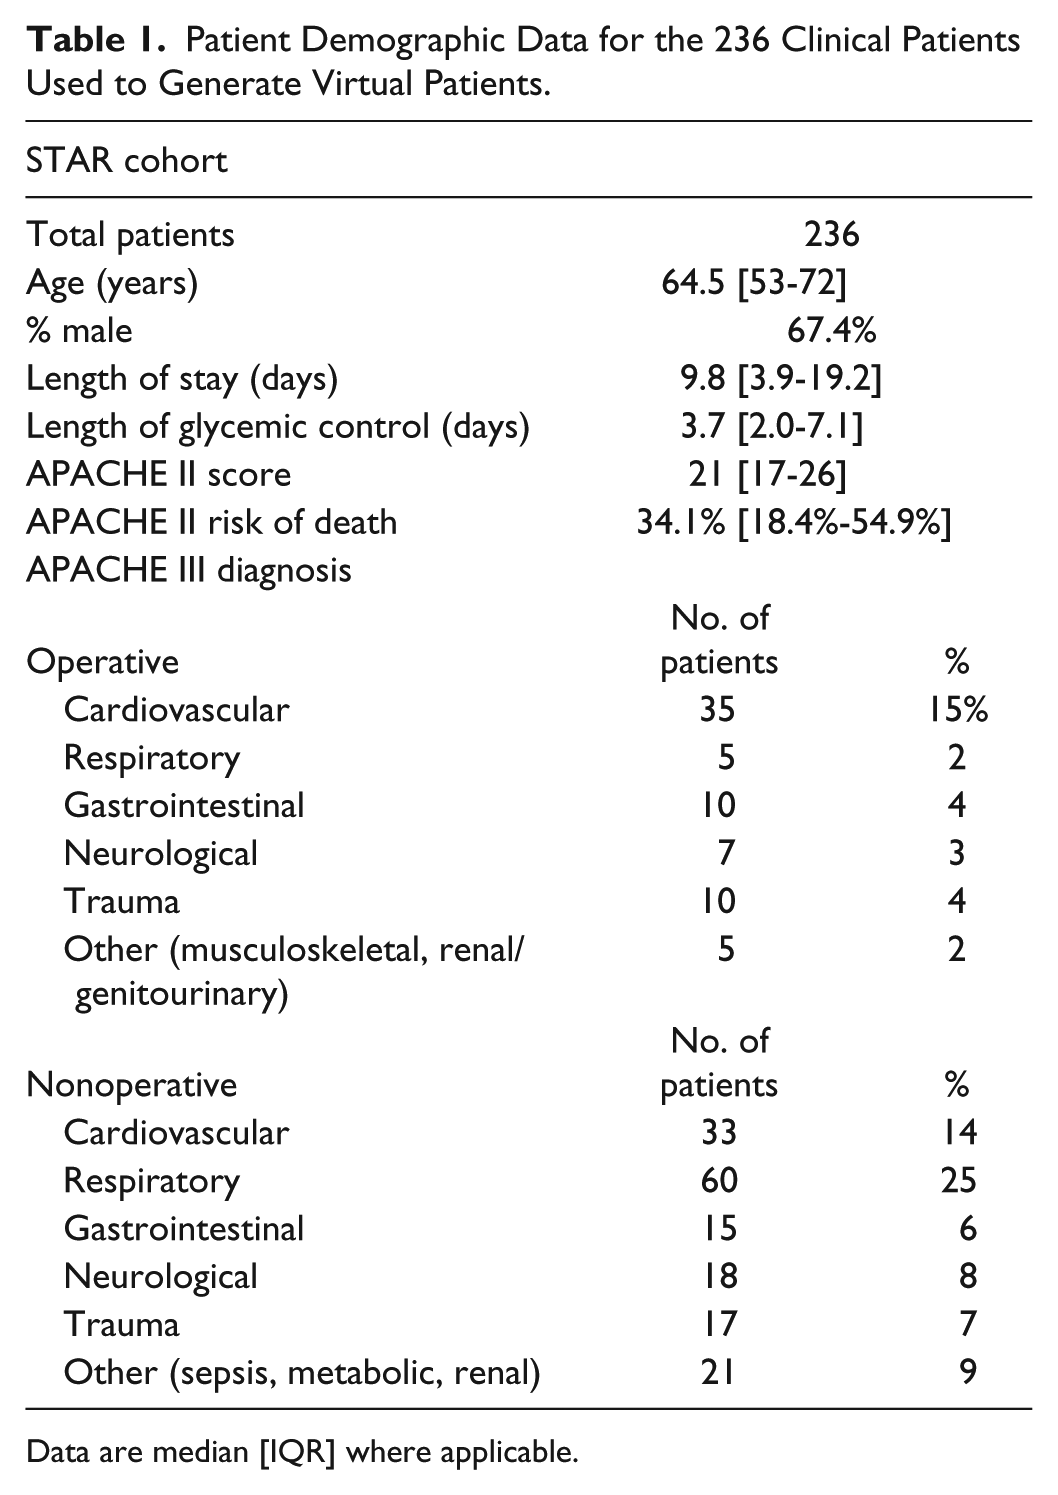
Data are median [IQR] where applicable.
Model
Model based SI is identified using the clinically validated ICING metabolic model: 68
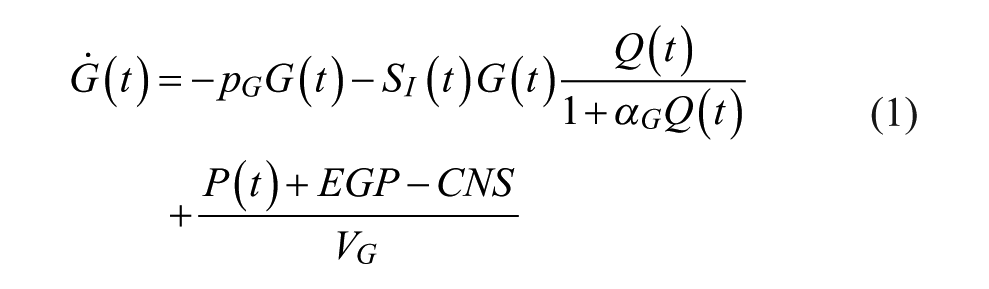
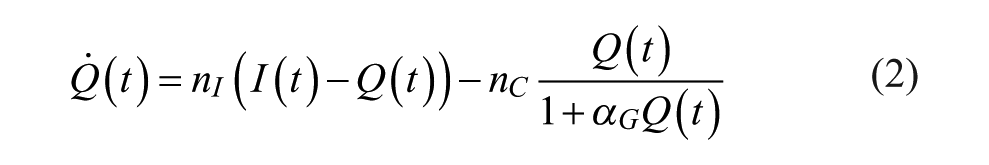
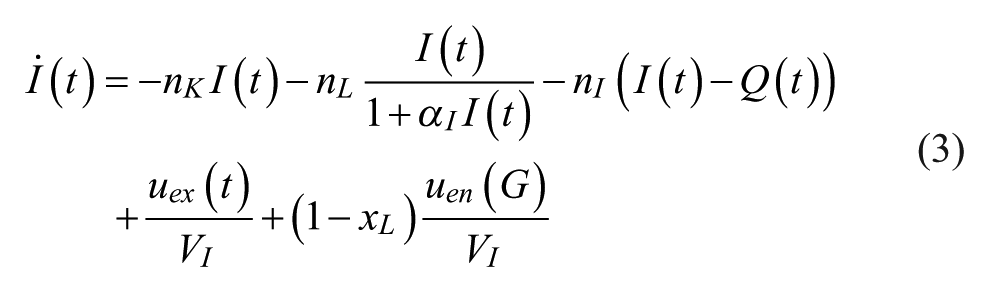
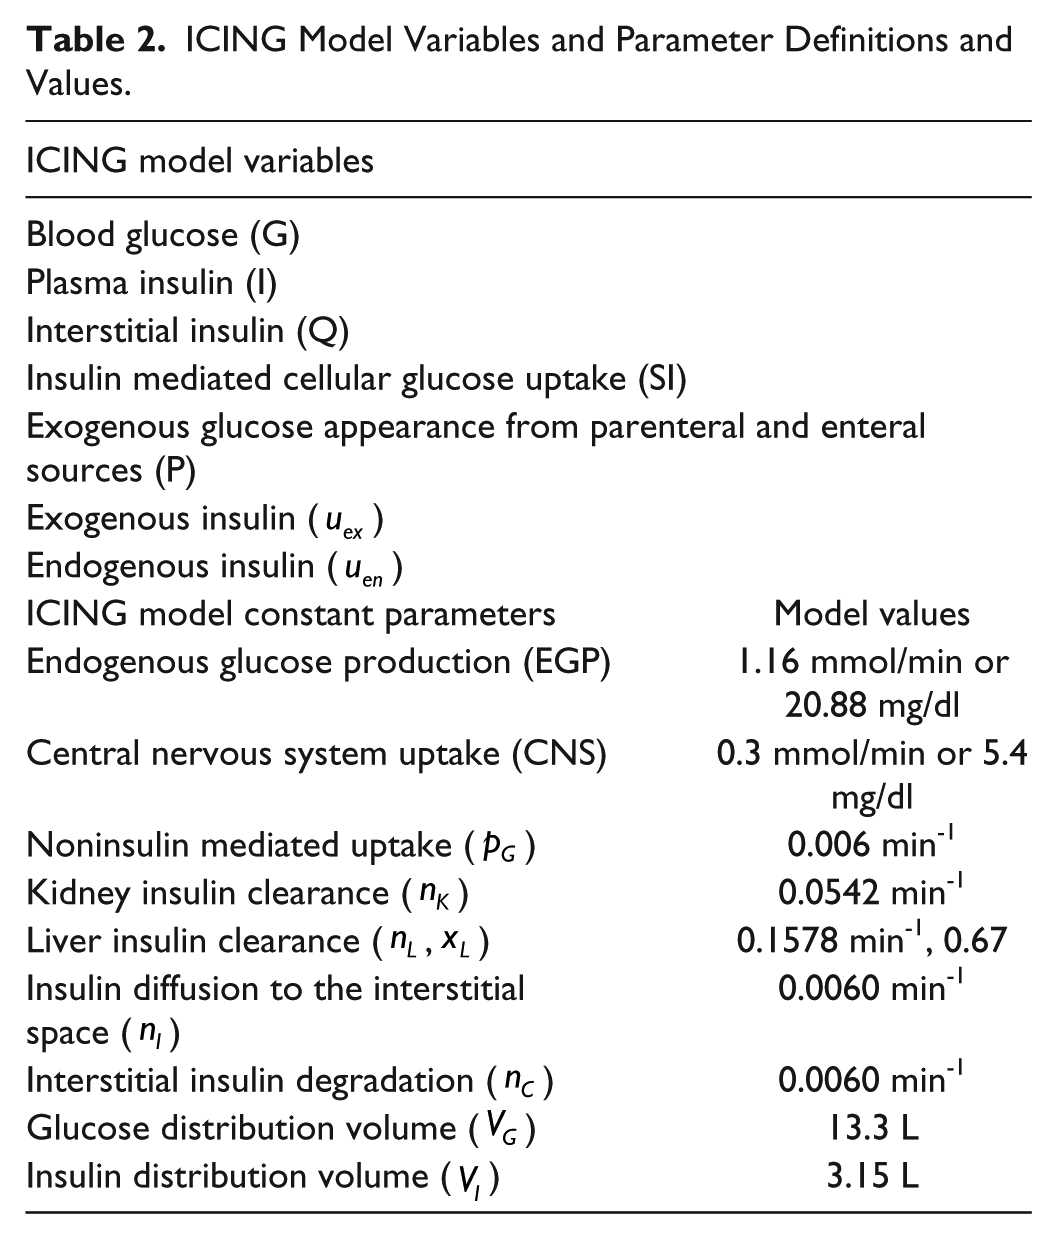
Table 2 contains all the variable and parameter definitions and values for the ICING model.
ICING Model Variables and Parameter Definitions and Values.
SI is the only parameter identified on a patient specific basis. It varies hourly with time, and is identified from clinical data using integral based fitting. 70 It is this time varying SI profile that defines a virtual patient. Thus, virtual patients are based off clinical data and clinically observed changes in SI, and are metabolic “clones” of the actual patient.
Virtual Trial Simulation
Virtual trials are carried out using virtual patients, a CGM sensor model and the STAR protocol. Multiple simulation cases are run to optimize the CGM-enabled protocol and performance metrics for safety, performance, and workload allowed for the evaluation of each simulation case.
CGM Sensor Model
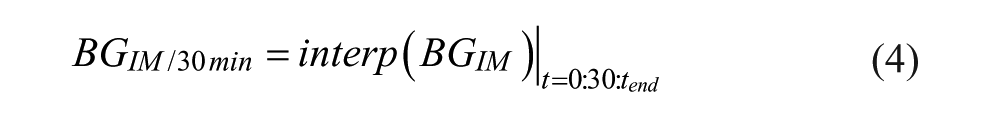
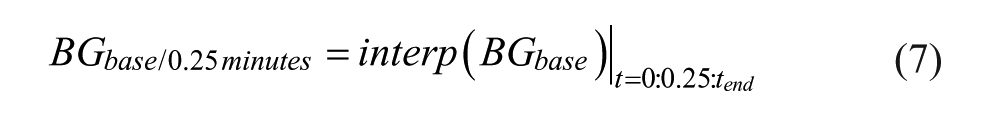
The IV CGM sensor model is presented in detail in Zhou et al. 1 However, in summary, two main sensor errors simulated are sensor drift (Drift) and sensor fluctuations (SensorFlux) via autoregressive (AR) processes. Intermittent clinical BGIM measurements are used as a base from which to simulate CGM sensor measurements for use in virtual trials.67,71-73 Clinical BG measurements are interpolated at half hourly intervals from the last measurement such that:
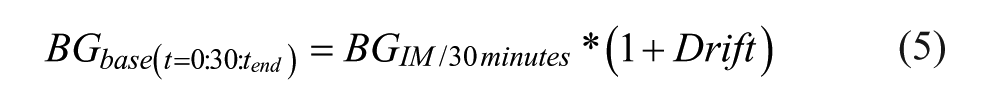
Drift is applied to each half hourly interpolated BG such that:
Drift is as described in Zhou et al, 1 where it is defined:

Where
The simulated sensor output is then defined:
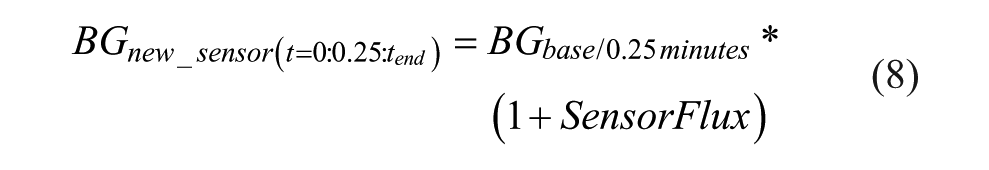
Where SensorFlux has been defined as in Zhou et al 1 such that:
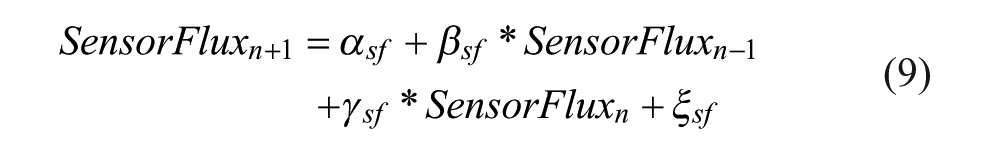
Where
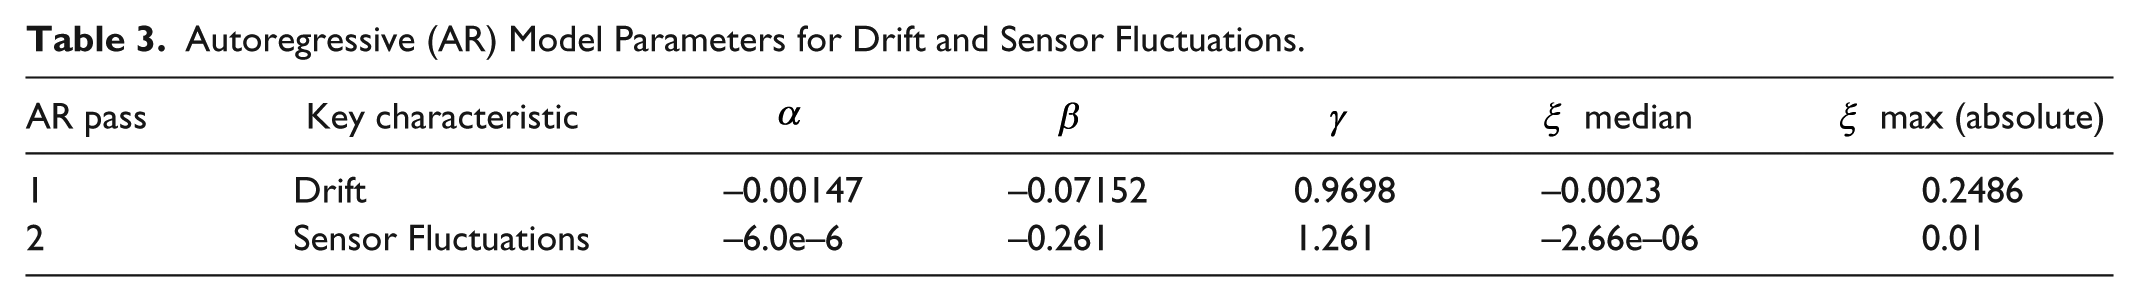
The model parameter values of α, β and γ for both drift and sensor fluctuations are presented in Table 3. The sensor model has been validated against clinical trial data in Zhou et al. 1 Equations (4)-(9) thus define the means of generating realistic CGM measures from intermittent clinical BG data in virtual trials.
Autoregressive (AR) Model Parameters for Drift and Sensor Fluctuations.
STAR Protocol
STAR (stochastic targeted) is a computerized model-based GC protocol utilizing stochastic models to forecast metabolic variations and glycemic outcomes for a given insulin and nutrition intervention.62-65 Future SI values are forecast from current identified SI values using stochastic models built from cohort data.68,74 These forecast SI values can be used to generate probable BG outcome distributions for any given insulin and nutrition intervention. STAR overlaps this distribution of potential BG outcomes with the clinically targeted 80-144 mg/dl range, using the fifth percentile of likely BG outcomes to ensure a 5% maximum risk of BG < 80 mg/dl. Insulin and nutrition treatments are selected to meet this goal, with a secondary goal of maximizing nutrition. The stochastic model and corresponding SI and BG forecasts used to determine these insulin and nutrition treatments are shown in Figure 2.
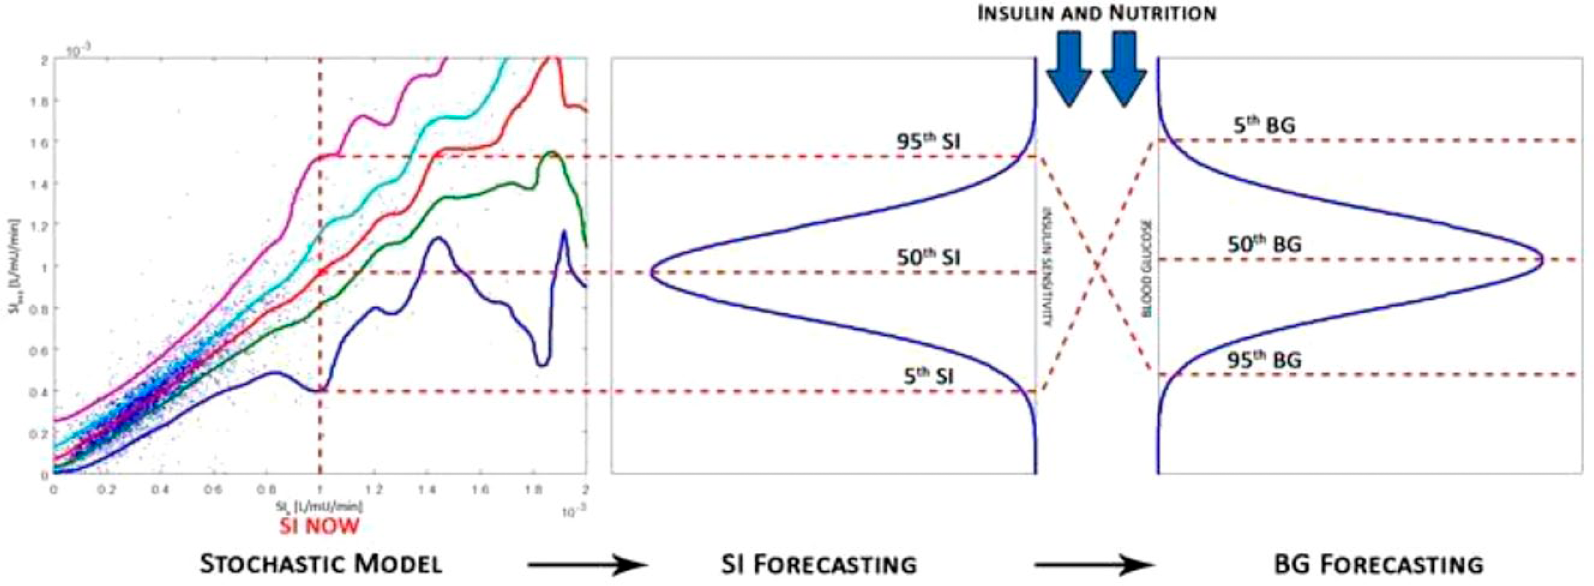
Stochastic model shows the current SI plotted against the percentage likelihood of future SI. The stochastic model is used to determine the SI forecast and corresponding BG forecast.
In clinical use, BG is measured hourly outside the 80-144 mg/dl range, and STAR offers 2 and 3 hour options for patients in the target range. In simulation, the maximum available measurement interval is always chosen. However, clinically it is left to staff discretion, resulting in slightly higher, voluntarily chosen measurement rates in some units. 65
CGM-enabled STAR
The CGM sensor model of Equations (4)-(9) is used to replace intermittent 1-3 hourly BG measurements in STAR. To simulate automation with the CGM sensor, interventions are calculated hourly using the modeled CGM sensor glucose (SG) value, unless a recalibration measure is taken, in which case this recalibration value is used instead. A typical clinical workload revolves around interventions at 1-3 hourly intervals, and so hourly CGM measures reduces required blood draws and thus clinical workload, while potentially improving control with more frequent adjustment. Hourly GC control can be very tight and automated CGM measures enable this approach for clinical practice, where it would otherwise be infeasible due to workload.75,76
CGM recalibrations reset SG to the calibration BG value assuming a point-to-point match. 1 Recalibrations are triggered when any of (1) a specified glucose guard rail is crossed; (2) there is a rapid change in CGM measured BG; or (3) 8 hours has passed since the last recalibration. 4 There is thus a minimum possible workload of 3 measures per day, unless conditions (1)-(2) are triggered.
Guard rails based on CGM measures are used to trigger calibration measurements ensuring higher sensor accuracy at areas of higher risk. Pairs of guardrail values were used, composed of upper and lower BG thresholds for recalibration. Guard rails of (72 mg/dl, 144 mg/dl) and (80 mg/dl, 144 mg/dl) were tried, defining the intermediate BG range.77-79 Any single SG measurement outside this range triggered a recalibration measure, as well as a STAR insulin-nutrition intervention change based on the recalibration BG measurement.
A rolling window monitoring changes in SG is also used to trigger recalibration measures. The rolling window looks at the change in SG measurement over a specified time frame, and this window rolls forward as more SG measures are available. If the magnitude of change in SG over this window exceeded a specified threshold, a recalibration is triggered and a treatment recommended using the recalibration measure. Sensitivity of GC performance to the interval and magnitude of SG change in these rolling windows was evaluated. Rolling window intervals of 20, 30, and 40 minutes were tested, as well as absolute changes in BG of 9, 18, and 27 mg/dl over these intervals.
The minimum time allowed between consecutive recalibrations was set to 1 hour to avoid excessive increases in workload that would not significantly affect sensor performance.
In the Christchurch Hospital ICU, insulin therapy is delivered as boluses every 1-3 hours. In this study, insulin was administered via insulin infusions, a delivery method more commonly used elsewhere, and easier to administer in an automated “closed loop” manner. In an automated closed loop, full automation would not require a nurse to be present to program boluses or infusions, thus further lowering clinical workload. This study examines the impact of CGM sensors on safety and performance, as a step toward further automation.
Virtual Trials Analysis
A simulation of clinical STAR, in which BG is measured intermittently every 1-3 hours and insulin is delivered in the form of boluses (Case B), was run to compare to the clinical STAR data (Case A), to show the difference between clinical and virtual patients in addition to the impact of always choosing the longest measurement intervals. STAR with 1-hour BG measurements and insulin infusions (Case C) was simulated to provide a baseline for comparison, where the impractical measurement rate of 24 BG measurements per day represents an upper bound of what performance might be expected with a CGM device measuring hourly. Table 4 lists all virtual trials utilizing the IV CGM model. Three Monte-Carlo simulations are carried out per virtual trial in Table 4, bringing the total number of virtual patient sensor trace outputs to 708 for each virtual trial
List of Simulation Cases Run Using CGM Sensor Model.
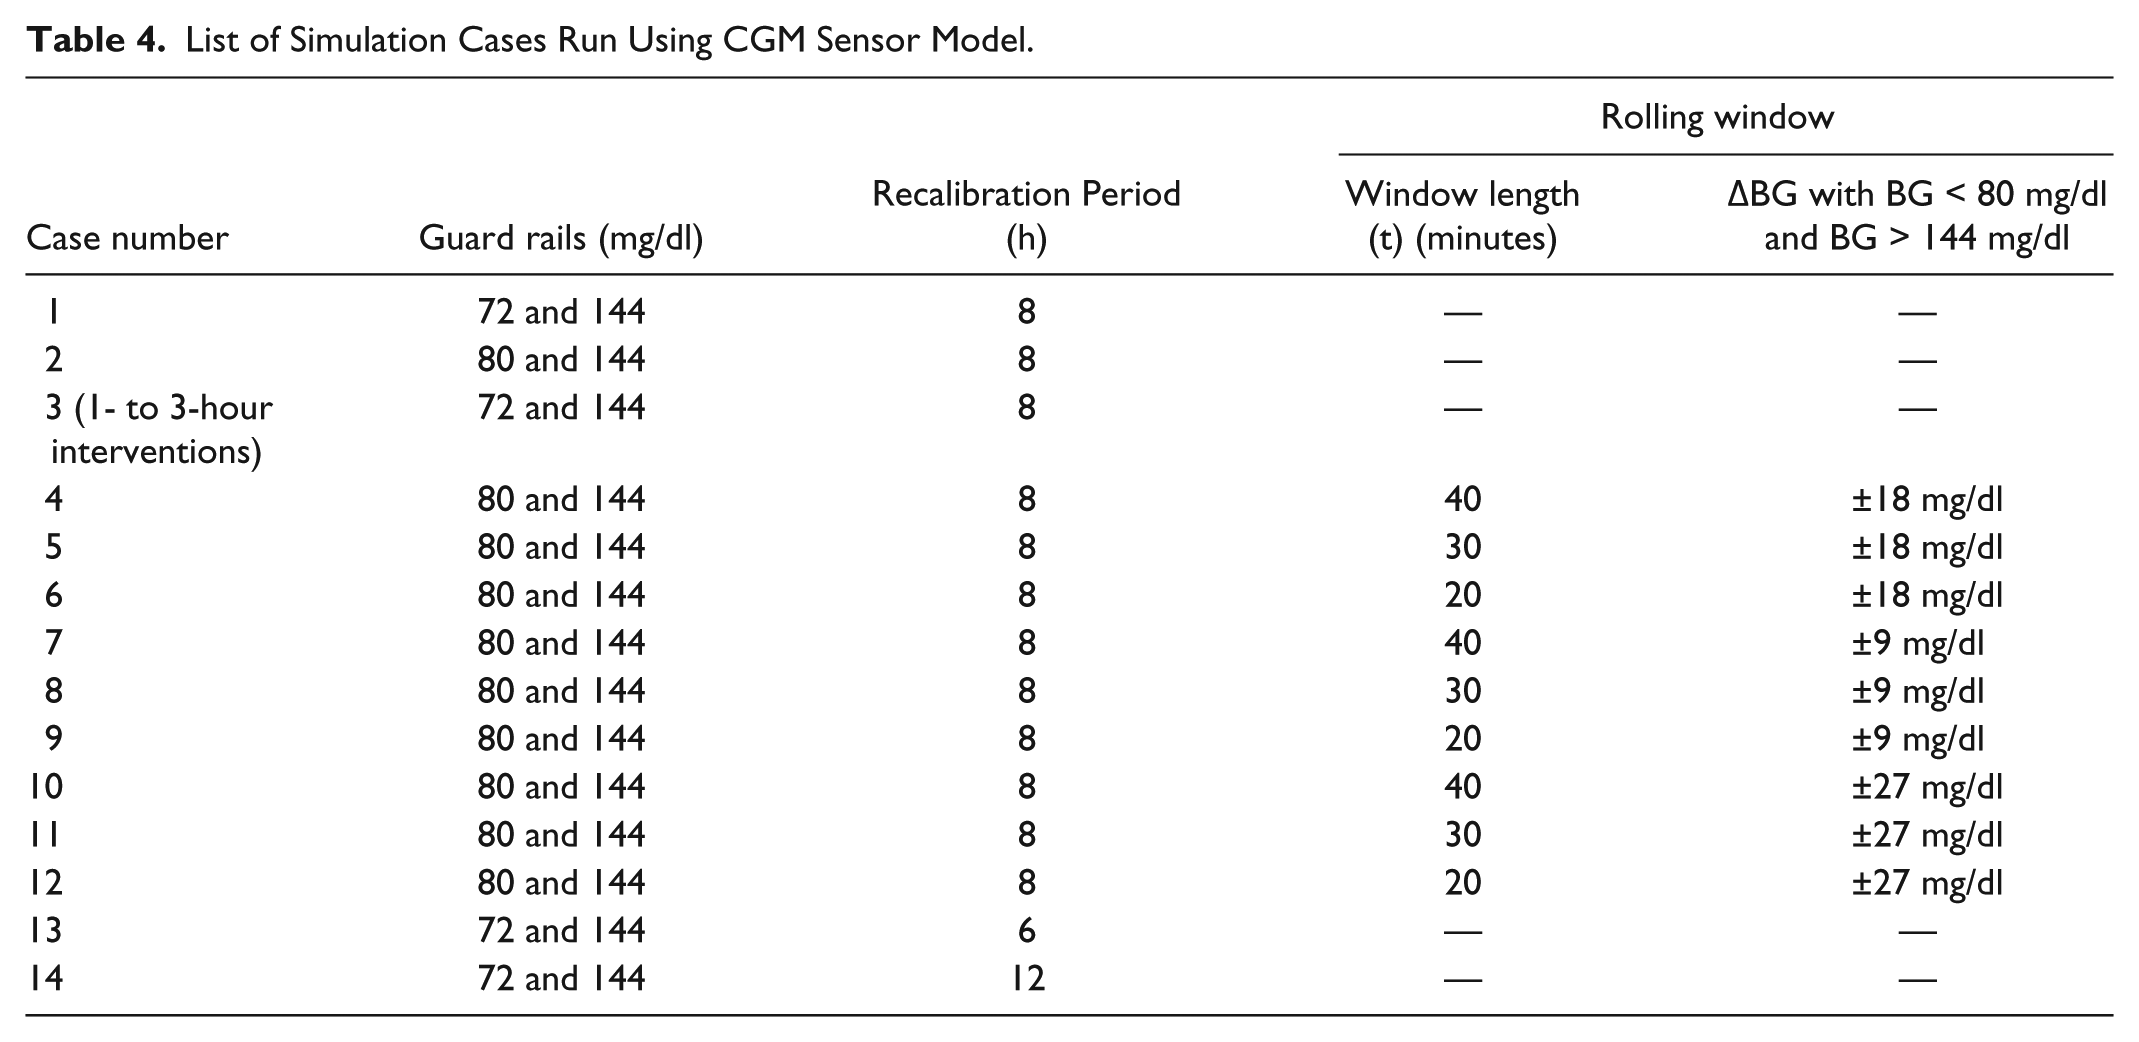
Cases 1 and 2 were run to optimize the BG levels of the guard rails for GC performance, safety and workload. Case 3 repeats Case 1, but allows for intervention interval length to extend up to 3 hours to assess this parameter in a semiautomated case where changing interventions hourly has a workload cost. A total of 9 simulations (Cases 4-12) were carried out to evaluate the effect of changing the parameters of the rolling window. Finally, recalibration periods were varied from 6 to 12 hours (Cases 13-14) to assess robustness to this metric.
Performance Metrics
Hourly resampled measurements are used so direct comparisons can be made between cohorts with different measurement and intervention intervals. For each virtual trial, the following performance indicators are used:
Each virtual trial in which the CGM sensor is employed also recorded the SG results, with added sensor errors, alongside the true (simulated) BG results to evaluate the impact on performance in true BG against what would be seen as “true” in a clinical setting where only SG would be known. Thus, all of the performance metrics are measured using true BG to reflect the actual results of each trial, while SG results are provided to evaluate how the results would have been reported clinically based off observed CGM data including errors. This comparison shows the impact of any sensor errors on perceived versus true performance, which is possible only in virtual trials and may be significant in sensors with larger errors and/or drift.
Results
Virtual Trials Results
Table 5 presents baseline clinical (Case A) and virtual trial results for STAR without CGM devices (Case B). The clinical and simulation results are broadly similar, with discrepancies due to the difference in measurement interval, where clinical staff are free to select 1-3 hours between measurements,62,63 but in simulation the maximum available is selected. As a result, the main difference between the results was that the simulated clinical STAR had a higher percentage of BG measurements in the 80-126 mg/dl band (76.9% vs 62.8%), but a more similar number in the 80-144 mg/dl range (89.0% vs 83.7%). Similarly, the incidence of mild hypoglycemia was slightly increased in simulation (0.5% vs 1.1% BG < 72 mg/dl), while the percentage of patients who experienced a severe hypoglycemic event (BG < 40 mg/dl) were similar and low (1.27 vs 0.85% for simulated and clinical respectively). Thus, Case A and Case B are similar enough, especially in per-patient results, to say the virtual cohort is a good representation of the clinical cohort.
Clinical STAR Results, Simulated Clinical Results, and Simulated 1-Hour STAR Infusions.
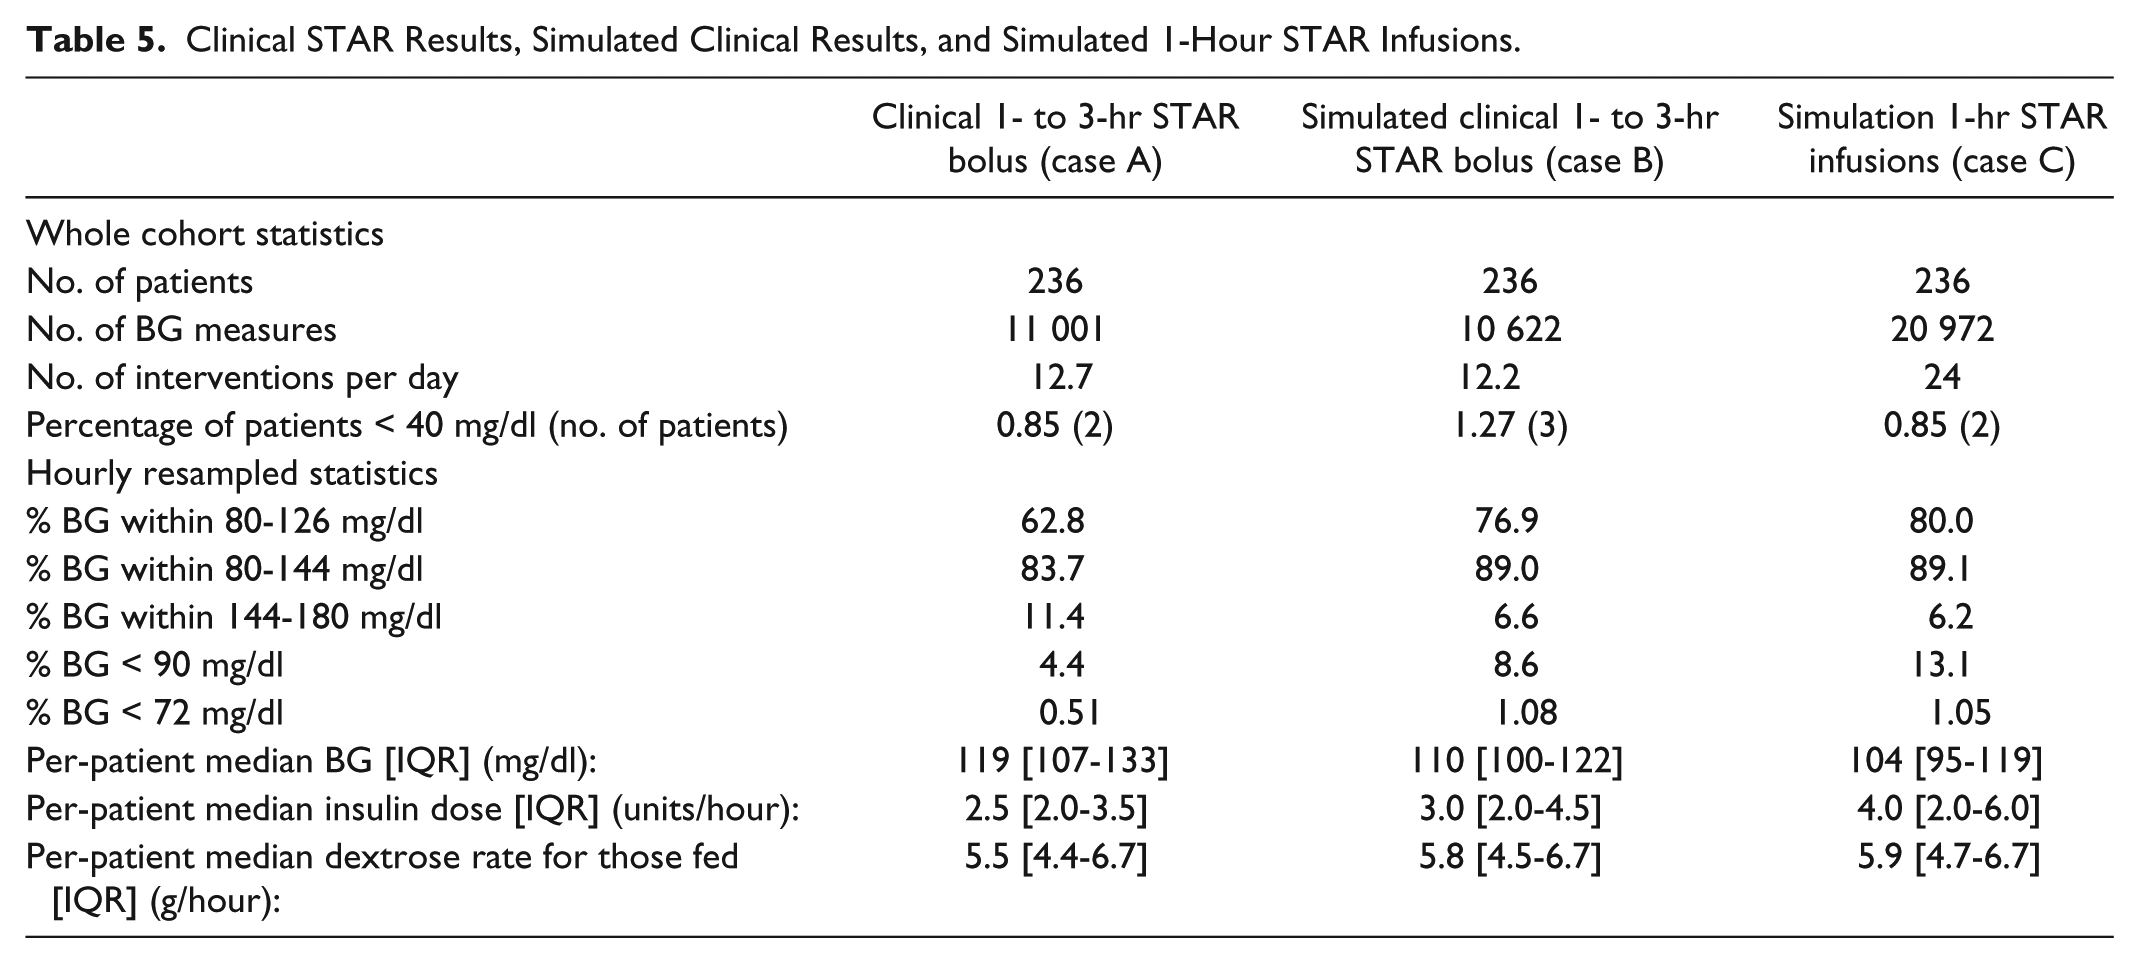
The last column in Table 5 shows Case C, the best case STAR controller results using 1 hour interventions and insulin infusions. GC performance was slightly improved compared to simulated clinical STAR in Case B (80.0% vs 76.9% in the 80-126 mg/dl range, 89.1% vs 89.0% in the 80-144 mg/dl range), while workload was significantly increased (24 interventions per day vs 12.2 in the clinical STAR simulation), as expected. This result is the baseline best case for comparing CGM-enabled STAR results, and also indicates the decreasing gain in performance found with increasing measurement rates.
Table 6 presents virtual trial results for Cases 1-4 in Table 4. Each virtual trial presents results in terms of “true” underlying BG and observed SG in two columns. Performance and safety for all trials in Table 6 are broadly similar to the baseline results for Case C in the last column of Table 5, but with significantly reduced workload.
Results From Virtual Trials Utilizing Guard Rails, With One Representative Utilization of the Rolling Window.
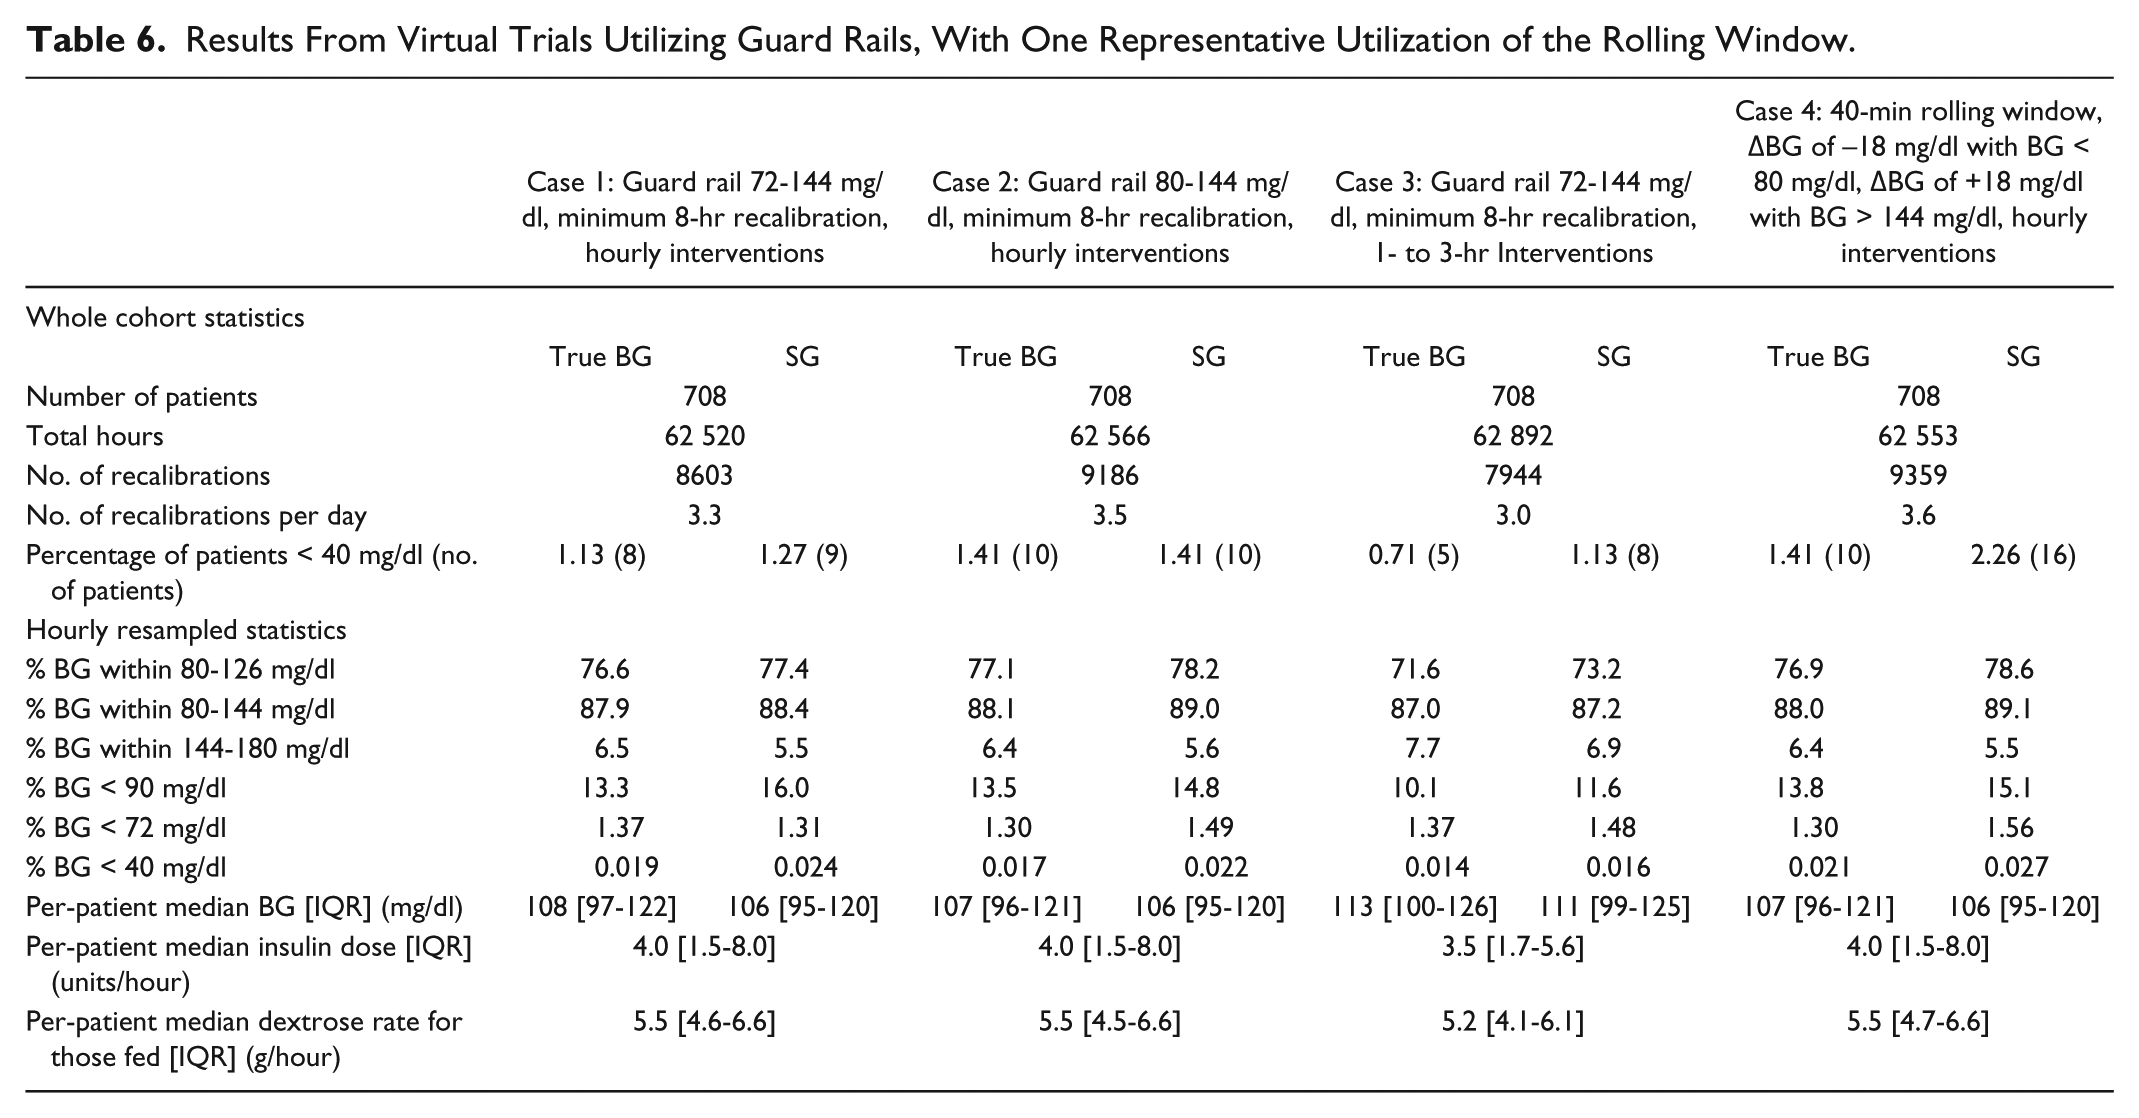
In Table 6, the number of recalibration measurements per day ranged from 3.0 to 3.6 per day. The percentage of true BG measurements within the 80-126 mg/dl band ranged from 71.6% to 77.1%, while the percentage of true BG measurements within the 80-144 mg/dl band ranged from 87.0% to 88.1%. The percentage of true BG < 72 mg/dl ranged from 1.30% to 1.37%. In addition, the percentage of patients who experienced a hypoglycemic episode ranged from 0.71% (5 of 708 patients) to 1.41% (10 of 708 patients). The last column of Table 6 presents the results typical of the virtual trials in which a guard rail and a rolling window were employed.
All of the different rolling window definitions (Cases 4-12) had very similar virtual trial results, so only one set of full results is shown for brevity in Table 6. Figure 3 shows the similarity in these 9 results, with the number of recalibrations per day ranging from 3.5 to 4.1, percentage BG within 80-126 mg/dl band ranging from 76.9% to 77.3%, percentage BG within 80-144 mg/dl band ranging from 87.9% to 88.1%, and percentage BG < 72 mg/dl band ranging from 1.25% to 1.33%.
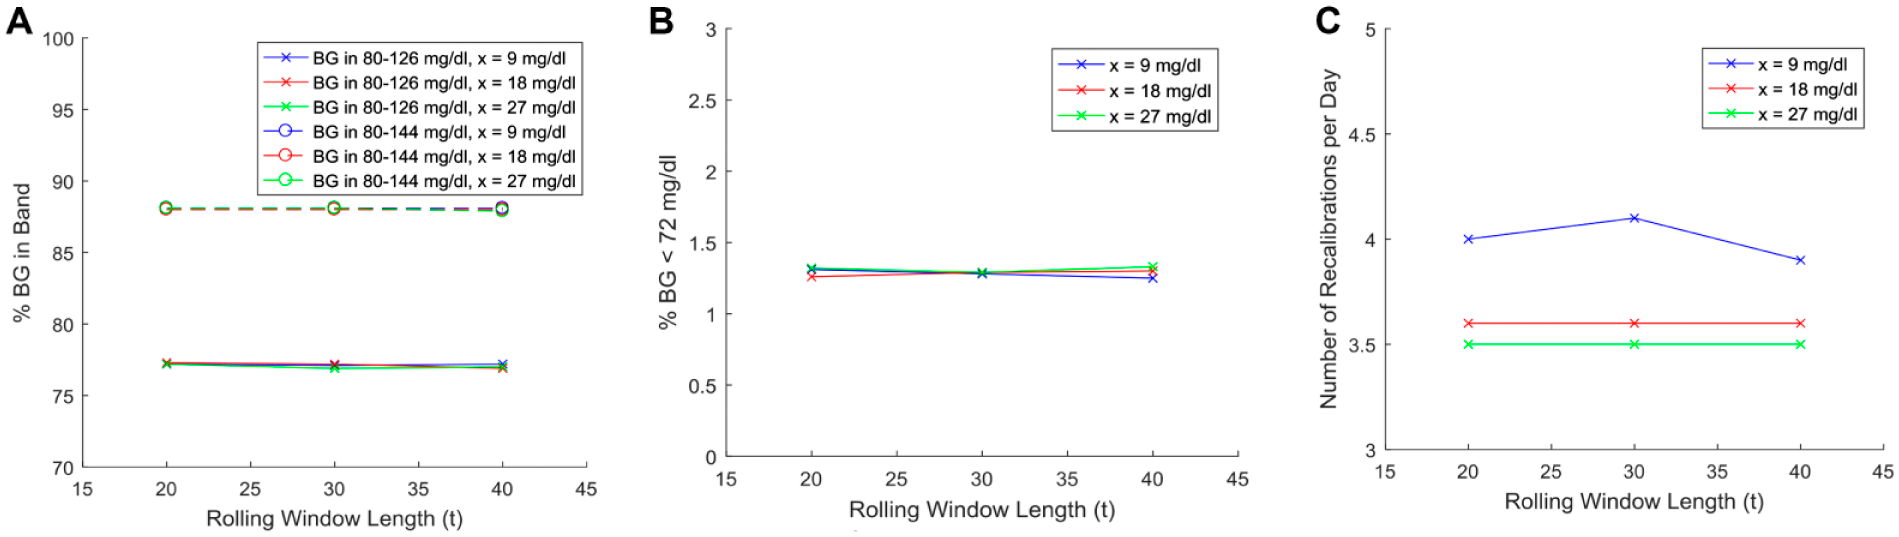
Graphical results from varying the parameters of the rolling window, with a guard rail of 80-144 mg/dl. Rolling window parameter testing: (a) Comparing the percentage of BG in band for each of the rolling window lengths. (b) Comparing the percentage of BG less than the threshold for each of the rolling window lengths. (c) Comparing rolling window length with nurse workload.
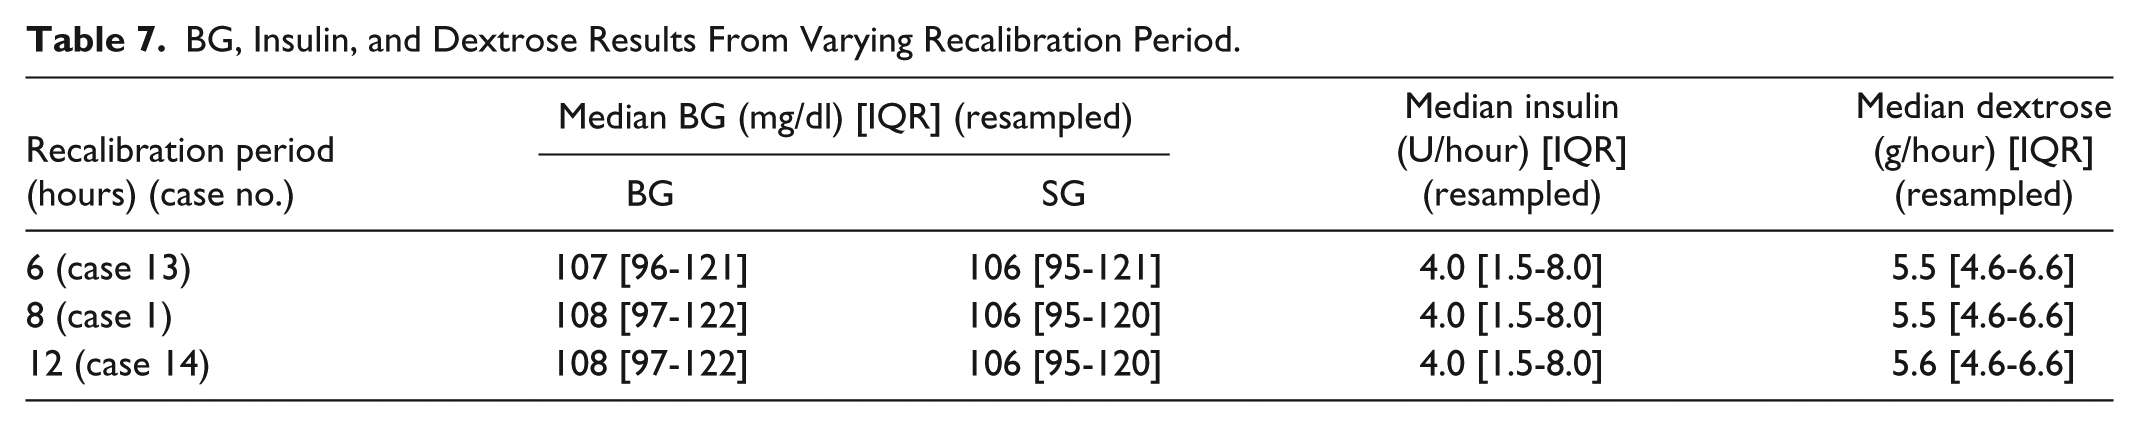
Figure 4 shows the virtual trials testing recalibration period (Cases 13-14) for robustness and optimization. Figure 4a shows the percentage of BG measurements within the thresholds, and shows no change in percentage BG in band as reported by the sensor and no change in median BG (Table 7). Figure 4b compares the percentage of BG measurements less than the hypoglycemic thresholds of 40 mg/dl and 72 mg/dl between the recalibration periods, while Figure 4c compares the nurse workload and patient safety. Small degradations in performance and safety are observed versus larger reductions in workload, defining a clear trade-off for clinicians.
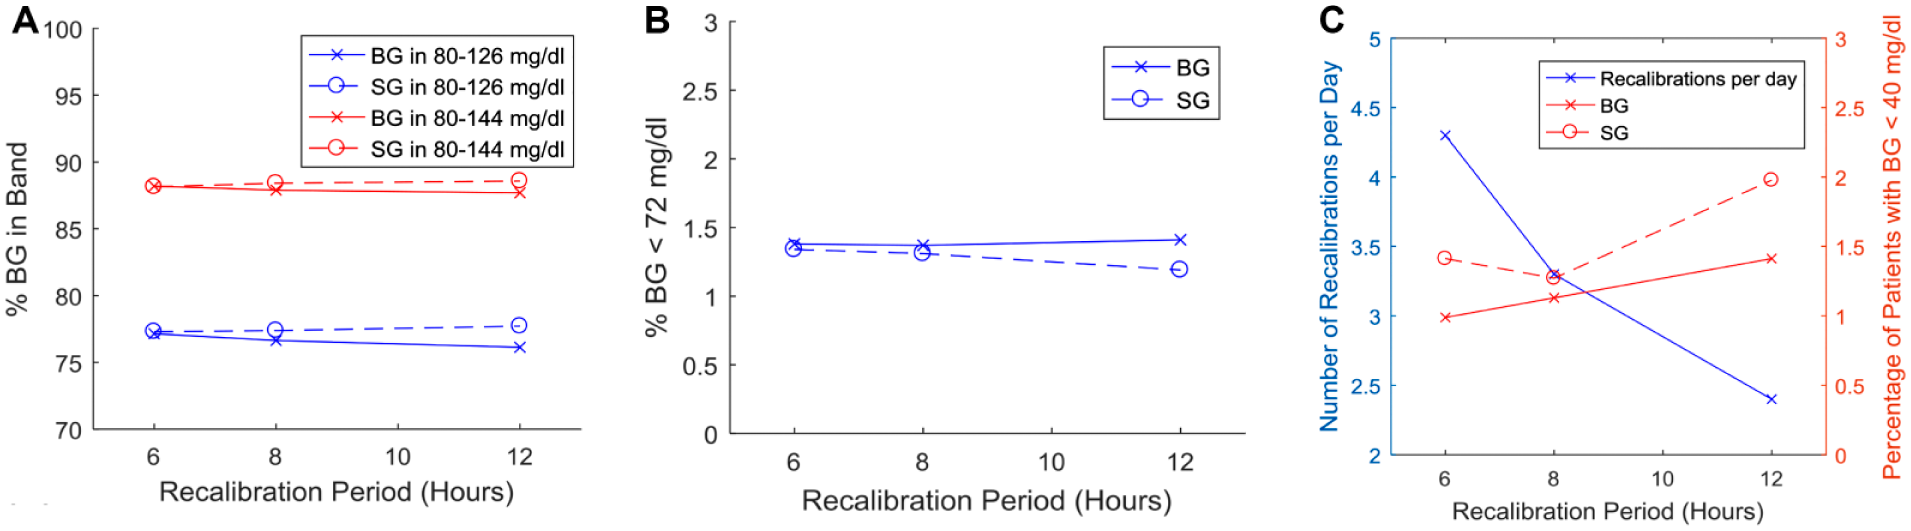
Graphical results from the testing of varying recalibration period with a guard rail of 72-144 mg/dl. Recalibration robustness trials: (a) Comparing the percentage of BG in band for each of the recalibration periods. “Real” BG is shown with solid lines; SG is shown with dotted lines. (b) Comparing the percentage of BG less than the thresholds for each of the recalibration periods. Again, “real” BG is shown with solid lines; SG is shown with dotted lines. (c) Comparing recalibration period with nurse workload and patient safety.
BG, Insulin, and Dextrose Results From Varying Recalibration Period.
Discussion
Sensor Use in Simulated GC
In general, replacing the more accurate intermittent BG measurements of STAR with CGM sensor measurements significantly reduced workload with clinically small to negligible effects on performance and safety. This trade-off is what clinicians must consider before fully implementing CGM sensors in GC. It is based on the underlying sensor drift, bias and error of this CGM, 1 where lower errors and drift might improve these results if found via a different or improved sensor.
For Case 1, the number of measurements required per day was 3.3, including recalibrations, an improvement in workload of 74% compared to the 12.7 for the clinical STAR Case A, and 73% for its virtual trial Case B. Utilizing CGM sensor measurements resulted in similar performance to simulated STAR, Case B, (76.6% vs 76.9% in the 80-126 mg/dl range) with only a slight increase in the percentage of BG < 72 mg/dl (1.4% vs 1.1%) for the simulation (Table 5). Results were not different if the lower guard rail was increased to 80 mg/dl (Case 2). Hence, the trade-off between workload, and clinical performance and safety, is clear in that a major reduction in BG measurements is achieved while safety and GC performance are maintained. The 80 mg/dl guard rail is also a better choice as a rolling window can be more effectively implemented, and safety is not reduced.
If the time between new interventions was allowed to vary up to 3 hours (Case 3) a treatment interval similar to that clinically observed (Table 5) is achieved, except that now most treatments are calculated from the CGM SG measurement. This trial shows the potential results of the integration of a CGM device into the STAR protocol without any further changes to the controller that currently utilizes intermittent BG measurements in the same interval. It thus matches current intervention workload if there is no automation. The key metrics were all similar to the first sensor model virtual trial with 1 hour infusions (3.0 recalibrations per day vs 3.3, 87.0% BG measurements in the 80-144 mg/dl band vs 87.9%, 1.37% BG measurements < 72 mg/dl vs 1.37%, 0.014% BG measurements < 40 mg/dl vs 0.019%). This result suggests STAR can be safely used with the GlySure CGM SG measures, or any similar performing CGM sensor, without requiring hourly treatment updates, thus limiting or reducing the level of automation required, while significantly reducing workload.
Case 4 was not significantly different to Cases 1-3, and thus the added rolling window did not show any notable benefit in most of the key performance metrics. Safety was maintained, reflected in the percentage of patients who experienced a severe hypoglycemic event (1.41% [10 patients of 708] vs 1.13% [8 of 708] for Case 1). Thus, rolling windows to capture rapid change impact safety relatively independent of performance and workload.
Figure 4a shows the percentage of BG measurements within the thresholds, and shows no change in percentage BG in band as reported by the sensor and no change in median BG (Table 7) for a given change in recalibration period. However, there is a decrease of percentage BG in band for the true BG as the recalibration period is increased. This outcome reflects the decreased accuracy of the CGM sensor as the sensor is allowed to operate for longer without recalibration, and particularly, the unseen impact of sensor drift.1,50,59
Figure 4b shows no change in the incidence of severe hypoglycemia as reported by the true BG or SG. Again, there is a slight disparity between true BG and SG, where the true BG has the incidence of mild hypoglycemia increasing at a slightly higher rate. This disparity again reflects the decreased accuracy of the CGM sensor and unseen impact of sensor drift with longer recalibration intervals. Overall, results are robust to calibration interval with mild degradation over longer periods, as expected. Results are not worse, in these cases, due to the use of guard rails to prevent BG levels from “escaping” the desired range and “forcing” recalibration if required. Thus, it is only unseen drift when true BG moves but drifting SG remains in band that is an issue.
Figure 4c shows the inverse relationship between nurse workload and patient safety. A 6 hour period between recalibrations increased the number of recalibrations per day to 4.3, which is still a large reduction from current clinical workload, but did not significantly increase the performance or safety of the controller. As expected, there was a slight increase in BG < 40 mg/dl with increased time (12 hours) between recalibration measures. Overall, a maximum of 8 hours between recalibrations appears to be an appropriate balance of workload and safety with this level of sensor performance.
Surprisingly, the addition of a rolling window monitoring the rate of change of BG did not affect overall performance. This result could be due to the activation condition for the rolling window being in practice very similar to the condition for which the guard rails activated a recalibration and intervention. The rolling window recalibration and intervention would activate earlier than the guard rail, and thus there would be no need for another recalibration if or when BG reached 80 mg/dl or 144 mg/dl if it occurred within an hour of the rolling window recalibration. Thus, the benefit of the rolling window is in capturing guard rail events earlier to improve safety.
Both subcutaneous and venous/arterial CGM devices have been studied for use in the ICU.9-20,80 Of these studies, Boom et al 14 offers the most comparable study to the one presented, where GC based on a sliding scale algorithm was guided by subcutaneous CGM measurements. Performance, as measured by the percentage of measurements in the target range, was worse (69% in the 90-162 mg/dl target range vs 88.0% in the 80-144 mg/dl target range for Case 4 of CGM-enabled STAR). 14 Safety was comparable between the two studies, with no incidences of severe hypoglycemia (<40 mg/dl) in Boom et al (0 out of 78 patients) compared to 1.41% of patients (10 out of 708 patients) in Case 4 of CGM-enabled STAR. Other studies in which GC was guided by subcutaneous CGM sensors reported average GC performance results alongside significant incidences of hypoglycemia,13,80 while another reported reduced incidences of hypoglycemia but no improvement in GC performance compared with intermittent BG measures. 11
Other studies show a similar percentage time in target range, but are less comparable because they used blood gas analyzers to measure BG and guide GC. In particular, several small studies show relatively high percentage of BG measurements in a tight range, with 0, or close to 0, incidence of severe hypoglycemic events (BG < 40 mg/dl).18-20 Other studies have used blinded CGMs to assess CGM point and trend accuracy, through MARD and Clarke error grid analysis, or detect hypo- or hyperglycemic events that may not be measured with intermittent BG measurements, but were not used to guide GC.5,6,81-83 Overall, this study uses clinical data from a large number of ICU patients to demonstrate the potential for using CGMs to aid or guide GC in the ICU, an outcome supported by preliminary results from previous studies.
The overall results of this study show replacement of intermittent BG measurements in GC may significantly reduce nurse workload, without compromising GC safety or performance. The simulated CGM sensor was able to decrease nurse workload, in the form of manual measurements, from 12.7 measures per day to 3.0-3.6 measures per day, depending on which guard rail or rolling window definition is employed. This decrease in nurse workload is achievable, with no significant changes to control performance or patient safety.
This result is contrary to expectations, 43 which hold that more frequent measurement would aid control. However, STAR already had a high level of performance. 65 Lesser performing GC protocols could see improvements not evident in this study.
Limitations
One of the limitations of this study was that in the making of the CGM sensor model, the clinical data used to construct the model had a very low number of BG measurements less than 90 mg/dl. 1 This limitation makes it harder to predict sensor behavior at this lower BG region, and it was assumed that the sensor behavior had consistent percentage error for the range of BG measured, implying smaller absolute errors at lower BG and higher absolute errors at higher BG. This assumption is consistent with other studies carried out using brands of interstitial CGM devices,2,84,85 while others report an increase in MARD at lower BG.86-88 This limitation could have a sizeable effect on the data produced, as the percentage of BG measurements < 90 mg/dl that were recorded by the sensor ranged from between 10.1% to 13.8% for the sensor model virtual trials. Further research would need to target data in this BG range to ensure the reliability of the sensor model at lower BG. However, based on the initial validation the current model is likely acceptable. Similarly, if the model of the CGM sensor at lower BG is inaccurate, a rolling window in a clinical setting could prove more effective in catching rapid declines in patient condition and BG than the simulations suggest.
A further limitation is sensor signal delays. Both the signal filter and the diffusion through the sensor membrane will introduce some delay. However, with the relatively high frequency of sensor measurements (4 times per minute) and the relatively long period of time between treatment decisions for the STAR protocol (1-3 hours), this combined signal delay would not be a hugely significant source of error clinically. Thus, it was not explicitly accounted for in the development of the model or the simulation of the CGM sensor traces.
Conclusions
A previously validated model of an IV CGM sensor was used in place of intermittent BG measurements to guide GC decisions under the STAR protocol in a virtual environment. Virtual trials are used to evaluate the impact on safety, performance, and workload of implementing these or similar CGM sensors for GC using the STAR protocol. Using a range of guard rails and/or rolling windows delineated trade-offs found in using CGM sensors, and decreased the number of required blood draws for BG measures by up to 73%, while also maintaining GC performance and patient safety. Performance and safety were robust to reasonable changes in sensor recalibration period, as well as to changes in rolling window parameters of window length and BG change. Overall, the use of a typical CGM sensor in clinically validated virtual trials shows the potential to reduce clinical workload significantly. The lack of equally significant improvements in performance are likely due to the already very good and clinically proven performance of the STAR GC protocol employed.
Footnotes
Acknowledgements
Clinical data and sensor information provided by GlySure Limited (Oxfordshire, UK), though GlySure was not involved in the modeling methodology or patient simulation.
Abbreviations
AR, autoregressive; BG, blood glucose; CGM, continuous glucose monitoring; d, drift; GC, glycemic control; ICING, Intensive Care Insulin-Nutrition-Glucose; ICU, intensive care unit; IG, interstitial glucose; IM, intermittent; IV, intravascular; MARD, mean absolute relative difference; SF, sensorflux or sensor fluctuations; SG, sensor glucose; SI, insulin sensitivity; STAR, stochastic targeted.
Declaration of Conflicting Interests
The author(s) declared no potential conflicts of interest with respect to the research, authorship, and/or publication of this article.
Funding
The author(s) disclosed receipt of the following financial support for the research, authorship, and/or publication of this article: The authors acknowledge the support of the EUFP7 and RSNZ Marie Curie IRSES program, the Health Research Council (HRC) of New Zealand, the MedTech CoRE and TEC, and NZ National Science Challenge 7, Science for Technology and Innovation.