
Abstract
Background:
Although several studies have evaluated the impact of prolonged infusion set use in insulin pump users on glycemic management with the use of continuous glucose monitoring (CGM), real-world assessments without intervention have been unavailable.
Methods:
This retrospective observational study recruited individuals with type 1 diabetes who received insulin pump therapy with real-time CGM. Insulin pump and CGM logs were extracted from the Medtronic CareLink system, and a dataset was constructed programmatically, counting tracking days from infusion set replacement every 24 hours up to day 4. The primary outcome was mean sensor glucose (SG) level, and the impact of infusion set usage duration on glycemic management was assessed.
Results:
The study enrolled 45 individuals with a median age of 40 (interquartile range = 32-51) years and median body mass index of 22.5 (21.2-23.8) kg/m². Mean SG was significantly higher on day 4 (median of 151.9 [136.5-173.7] mg/dL) than on day 2 (144.4 [124.0-162.9] mg/dL, P = .024). Similarly, time above range (TAR), time in range (TIR), and time in tight range (TITR) had worsened on day 4 compared with day 2. The TAR increased from a median of 22.0% (7.3%-35.8%) on day 2 to 27.6% (17.7%-44.9%) on day 4, whereas TIR decreased from 74.2% (59.9%-87.1%) to 66.5% (52.0%-79.8%) and TITR decreased from 47.6% (37.1%-67.5%) to 42.2% (34.6%-54.1%).
Conclusions:
Our evaluation of the real-world impact of prolonged infusion set use revealed an association between longer use and worsening of glycemic management.
Keywords
Introduction
Insulin pump therapy is widely adopted by individuals with type 1 diabetes because it allows for flexible insulin dose adjustments, thereby more closely mimicking physiological insulin secretion and achieving better glycemic management compared with multiple daily injections. 1 However, such therapy presents unique challenges including dislodgement or occlusion of the infusion set, skin-related complications at the insertion site, and higher treatment costs compared with multiple daily injections. 2 Prolonged use of an infusion set may increase the risk of adverse events such as hyperglycemia and diabetic ketoacidosis (DKA) due to occlusion.3,4 Widely used infusion sets, such as the MiniMed Quick-set and MiniMed Silhouette manufactured by Medtronic, are therefore recommended to be replaced within three days.5-7 However, patient surveys have found that a subset of individuals continue to use their infusion sets beyond this recommended period. 8
Despite the recognized importance of timely infusion set replacement, evidence regarding the real-world impact of prolonged use on glycemic management is sparse. A study that evaluated the effects of prolonged infusion set use based on blood glucose monitoring found a higher incidence of hyperglycemia on day 4 compared with day 2 after infusion set initiation. 9 Given that continuous glucose monitoring (CGM) provides a detailed blood glucose profile, its use in clinical research is recommended by an international consensus statement. 10 For sensitive assessment of the impact of prolonged infusion set use on blood glucose levels, CGM-based evaluation is therefore preferable to blood glucose monitoring at several fixed points. However, to the best of our knowledge, studies that have adopted CGM to investigate this issue remain limited in scale,11,12 and the need for additional data has been recognized. 13 Whereas it is reasonable to address this matter by integrating expanded data on sensor glucose (SG) levels for CGM with usage records of insulin pumps, the substantial time and effort required for the manual cleaning and analysis of these extensive data logs presents a considerable challenge.
We have now evaluated the real-world impact of infusion set use beyond the recommended duration on glycemic management in individuals with type 1 diabetes by accurately analyzing insulin pump and CGM log data with the use of a programmatic approach.
Methods
Study Design and Participants
This study was designed as a retrospective observational study to be conducted at a single center. Individuals with type 1 diabetes who were aged 20 years or older, attended Kobe University Hospital between April 1, 2017, and March 31, 2019, and were receiving insulin pump therapy with a real-time CGM (rtCGM) device were eligible for inclusion. For each participant, rtCGM and insulin pump logs spanning three consecutive months were extracted. Accordingly, the data collection period for this study began on April 1, 2017, and ended on June 30, 2019. The diagnosis of type 1 diabetes was based on the diagnostic criteria of the Japan Diabetes Society.14,15 At the institution where the study was conducted, all individuals undergoing insulin pump therapy receive standard instructions on managing infusion set occlusion as part of routine clinical care.
Individuals who refused to participate on the basis of previously disclosed information, those undergoing chemotherapy, and pregnant individuals were excluded from the study. Individuals using an insulin pump equipped with an algorithm that automates insulin suspension when glucose levels are low or predicted to become low were also excluded so as to allow accurate evaluation of the impact of infusion set use duration on glycemic management. Automated insulin delivery systems have the potential to independently regulate insulin administration on the basis of CGM data; however, none of the participants of the study used such a system because they were not available in Japan during the study period. The study therefore targeted individuals using the Medtronic Enlite system for rtCGM and the MiniMed 620G as the insulin pump. For assessment of the effects of infusion set use beyond three days, individuals without data on such use for >96 hours were excluded from the analysis. Given that the COVID-19 pandemic from 2020 onward affected access to medical care and could have influenced the study parameters, 16 the study period was limited to before the pandemic.
All procedures performed in this study of human participants were in accordance with the guidelines of the Declaration of Helsinki, and the study protocol was approved by the ethics committee of Kobe University Graduate School of Medicine (approval no. B240163; approval date, November 29, 2024). The ethics committee approved an opt-out consent approach via the hospital website, given the low risk to participants. The results are reported in accordance with the Strengthening the Reporting of Observational Studies in Epidemiology (STROBE) guidelines. 17
Procedures
The data analysis process is depicted in Figure 1. In step 1, rtCGM and insulin pump logs spanning three consecutive months were extracted for each study participant with the use of the Medtronic CareLink system, an electronic platform that stores rtCGM and insulin pump logs. These logs included comprehensive data related to CGM and insulin pump therapy, such as sensor glucose (SG) levels, infusion set replacement actions, and insulin dosage. In step 2, the extracted log data were organized by assigning infusion set usage days sequentially from day 1, with the time of recorded infusion set replacement as the starting point. Data segments shorter than 24 hours were excluded from the analysis to prevent bias due to time-of-day imbalances. Situations leading to early infusion set replacement, such as insulin pump malfunction or exceptionally high insulin usage, could introduce bias, which needed to be minimized to allow accurate comparison of the effects of infusion set usage duration. Therefore, in step 3, only data segments consisting of at least four consecutive days from the processed data in step 2 were selected, and the average values for each day were calculated. In step 4, the processed data from step 3 were compiled for each participant to construct the dataset for statistical analysis. In addition, days with a percentage time that CGM was active of <80% were excluded from the analysis so as to ensure data quality. Python 3.11.5 was adopted for processing and organizing the data to construct the dataset. Events of DKA and skin complications were collected through a review of electronic medical records conducted by clinicians. Cases of DKA were recorded if they met the criteria outlined in the American Diabetes Association (ADA) consensus statement. 18 Skin complications were defined as cases in which any of the following were documented in the electronic medical records: user-reported complaints, physician-recorded clinical findings, or prescription of topical agents for the infusion set insertion site.
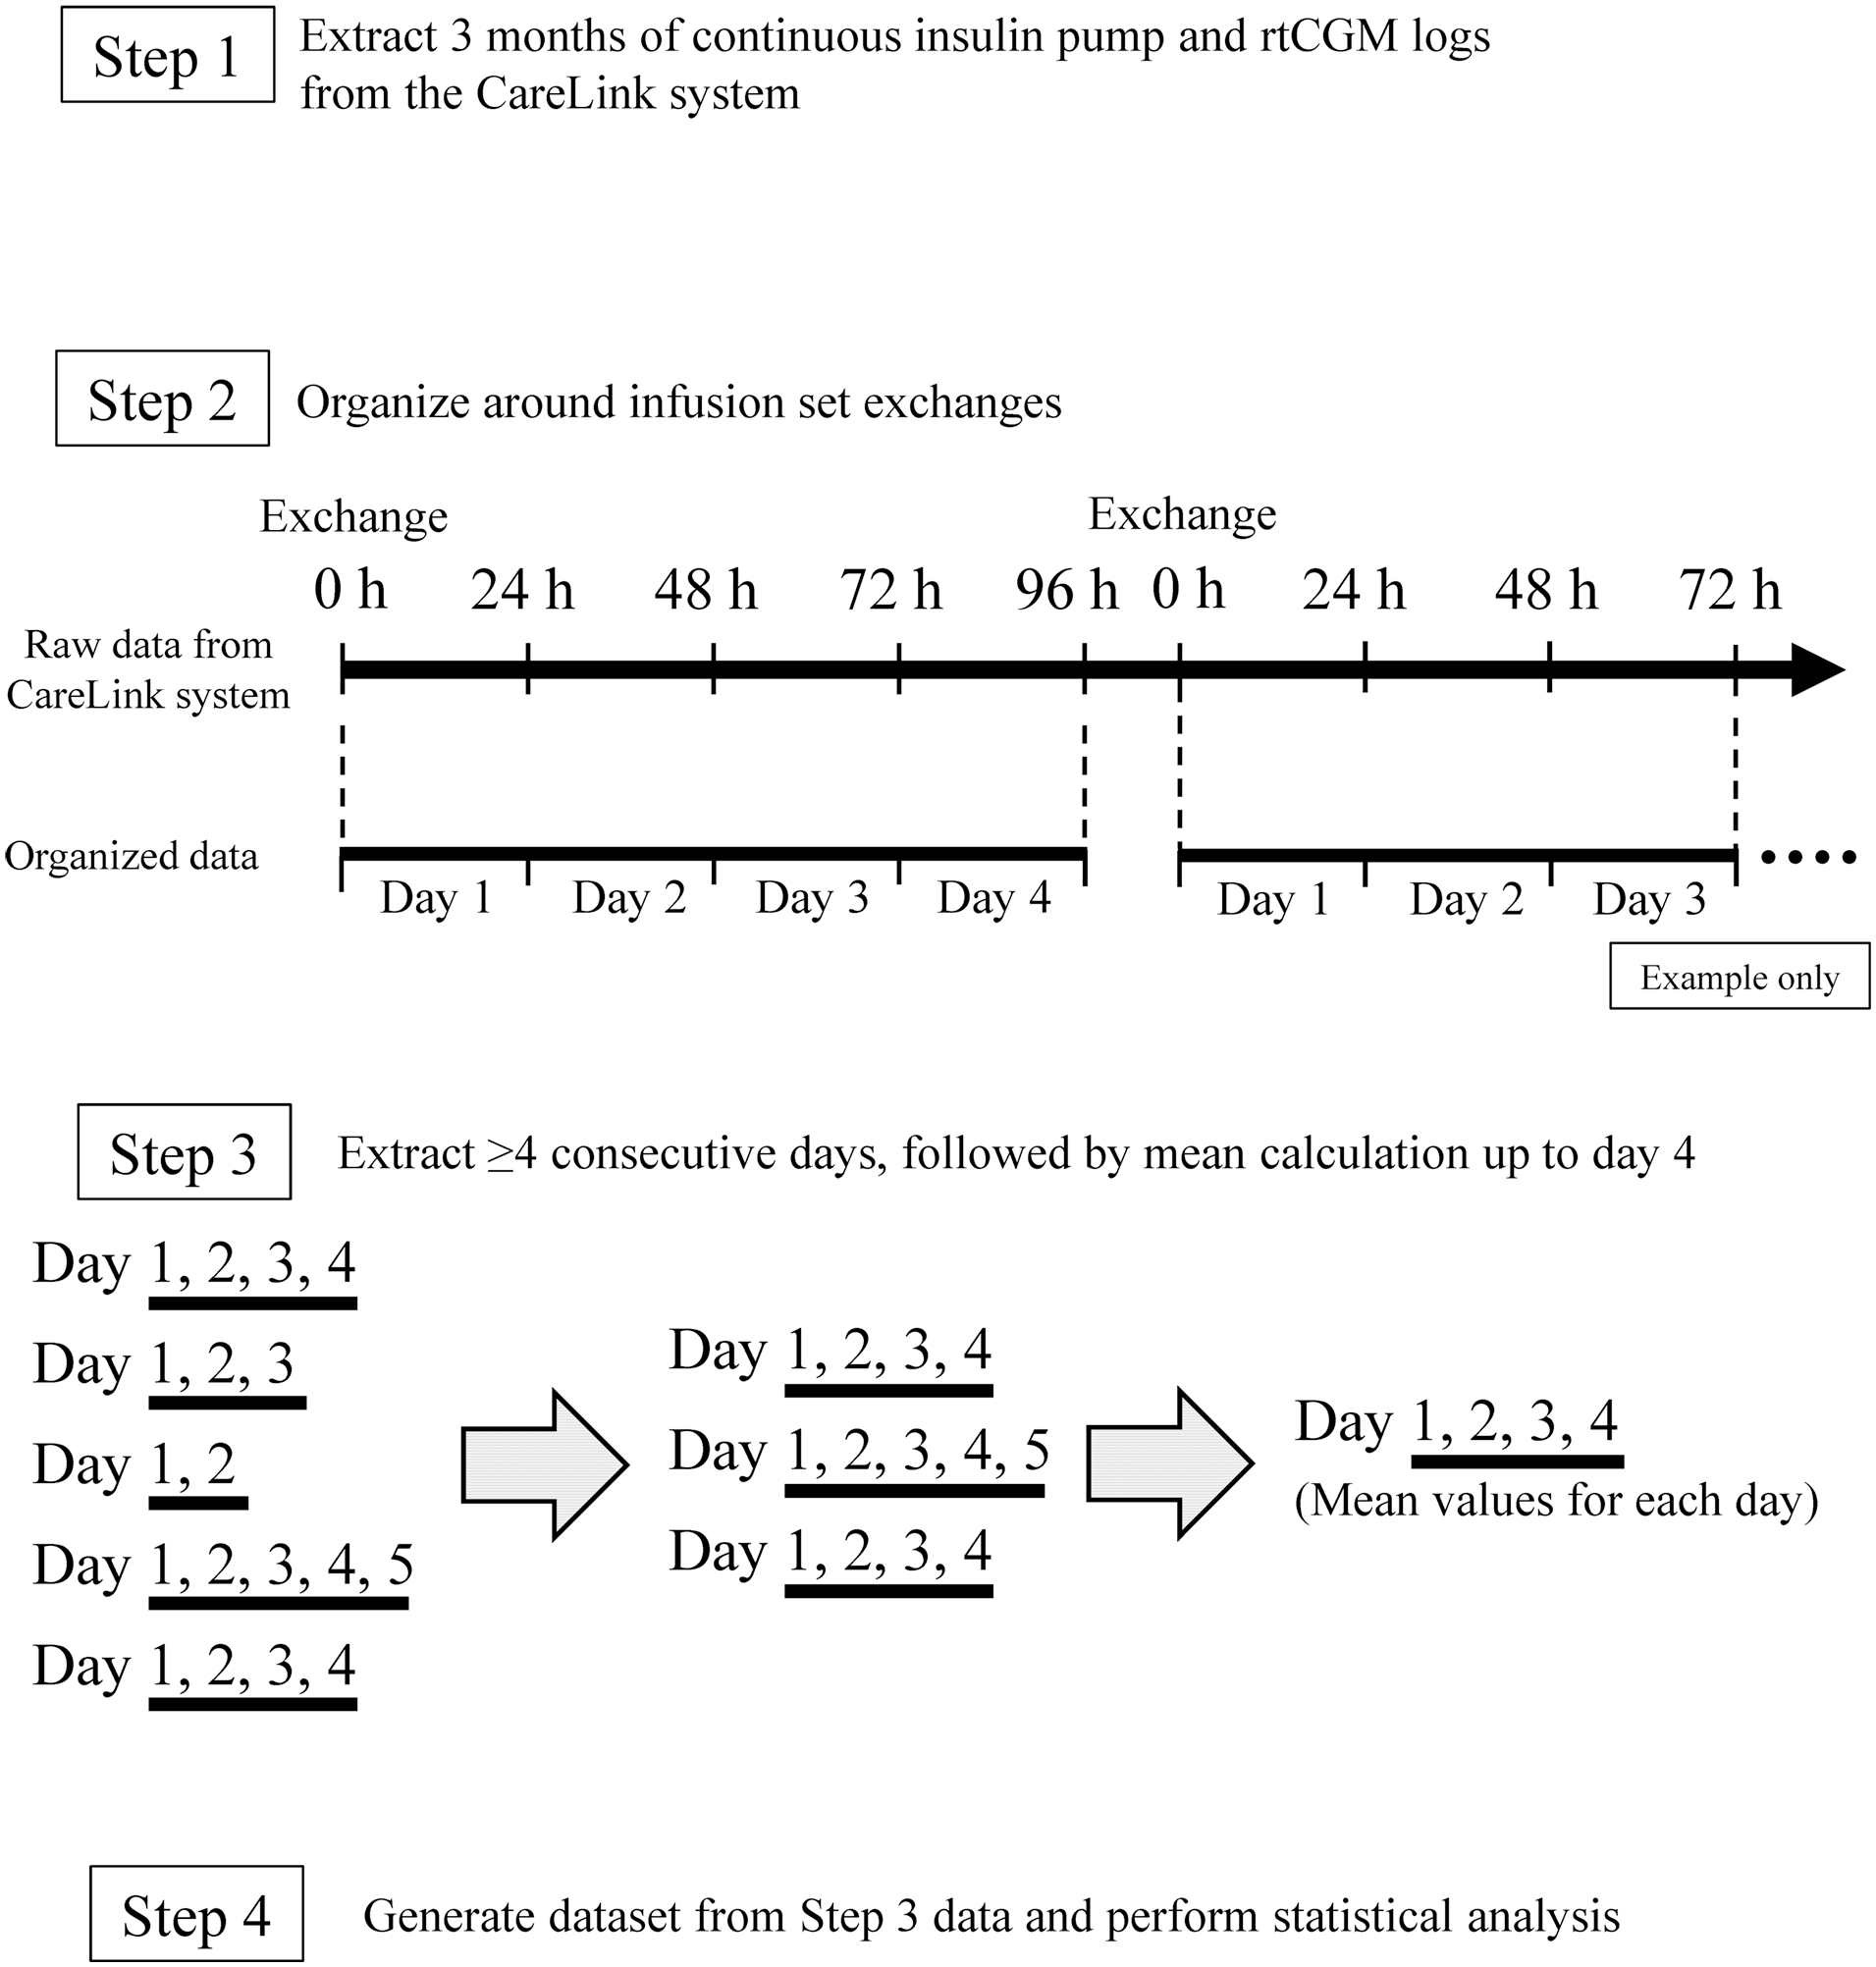
Overview of data analysis workflow.
Outcomes
The primary outcome of this study was the change in mean SG from day 1 to day 4 after infusion set initiation. Secondary outcomes included changes in other CGM-related metrics—including time above range (TAR, >180 mg/dL), time in range (TIR, 70-180 mg/dL), time in tight range (TITR, 70-140 mg/dL), time below range (TBR, <70 mg/dL), standard deviation (SD), coefficient of variation (%CV), and glycemia risk index (GRI)—as well as changes in total daily dose of insulin (TDD), the frequency of skin complications at the infusion set insertion site, and the frequency of DKA. The CGM-related metrics were calculated for each infusion set usage day. Mean SG and SD were both calculated from 24-hour SG values, and %CV was calculated by dividing SD by mean SG. The GRI, a composite CGM metric of glycemic risk, was calculated using the published formula: GRI = (3.0 × Hypoglycemia Component) + (1.6 × Hyperglycemia Component), where the Hypoglycemia Component and Hyperglycemia Component were defined as follows: Hypoglycemia Component = % time < 54 mg/dL + (0.8 × % time 54-<70 mg/dL). Hyperglycemia Component = % time >180-250 mg/dL + (0.5 × % time >250 mg/dL). 19
Clinical Characteristics
Clinical characteristics of the study participants—including sex, age, height, weight, body mass index (BMI), duration of insulin pump therapy, presence of diabetic complications (neuropathy, retinopathy, and nephropathy), hemoglobin A1c (HbA1c) level, fasting plasma glucose level, fasting serum C-peptide concentration, type of infusion set, and type of insulin used—were examined. Fasting plasma glucose levels and fasting serum C-peptide concentrations were measured simultaneously. The assessment of diabetic neuropathy was based on symptoms as well as on quantitative sensory (vibration and monofilament tests) and motor (patellar and ankle reflexes) evaluations. 20 Diabetic retinopathy was classified into nonproliferative, preproliferative, and proliferative stages. 21 Diabetic nephropathy was determined by measurement of albumin levels in 24-hour urine samples, with a normal threshold of <30 mg/day. 22 Microalbuminuria and macroalbuminuria were defined by albumin excretion rates of 30 to 300 mg/day and >300 mg/day, respectively. The diagnosis of diabetic nephropathy was confirmed by ruling out other primary causes of kidney disease.
Statistical Analysis
Data are presented as median values with the interquartile range (IQR). For evaluation of each parameter on the basis of infusion set usage duration, repeated-measures analysis of variance (ANOVA) was applied for normally distributed data, with the paired t test as a post hoc test. For non-normally distributed data, the Friedman test was applied, with the Wilcoxon signed-rank test as a post hoc test. The Holm correction was applied for multiple testing in post hoc analysis, which was performed for all six pairwise combinations of days 1, 2, 3, and 4. In addition to the overall analysis, stratified analysis based on an HbA1c level of 7%, according to the ADA treatment target, 23 was performed. A P value of <.05 was considered statistically significant. On the basis of the assumption of an SD of 30 mg/dL for mean SG,24,25 a sample size of 45 participants would be able to detect a change of 12.9 mg/dL in post hoc analysis with a power of: 1 – β = 0.8 (α = 0.05, ρ = 0.5). All statistical analysis was performed with SPSS software (IBM SPSS Statistics 29.0).
Results
Baseline Characteristics of the Study Participants
During the study period, 101 individuals with type 1 diabetes who were undergoing insulin pump therapy with rtCGM attended Kobe University Hospital. Among the 88 of these individuals who met all eligibility criteria, 43 were excluded on the basis of the exclusion criteria and the remaining 45 were included in the study (Figure 2). The baseline characteristics of the study participants are summarized in Table 1. The median age was 40 years (IQR, 32-51 years), and the median BMI was 22.5 kg/m2 (21.2-23.8 kg/m2). The median fasting serum concentration of C-peptide was 0.0 ng/mL (0.0-0.2 ng/mL), indicative of a population with severely impaired endogenous insulin secretion. The median duration of insulin pump therapy was three years (two to eight years). All participants used either the MiniMed Quick-set or MiniMed Silhouette infusion set. During the observation period, only two cases of mild skin redness at the infusion set insertion site were recorded, and no instances of DKA occurred. In the constructed dataset, the median percentage time CGM was active was 97.0% (93.6%-99.9%). No baseline data were missing among the study participants.
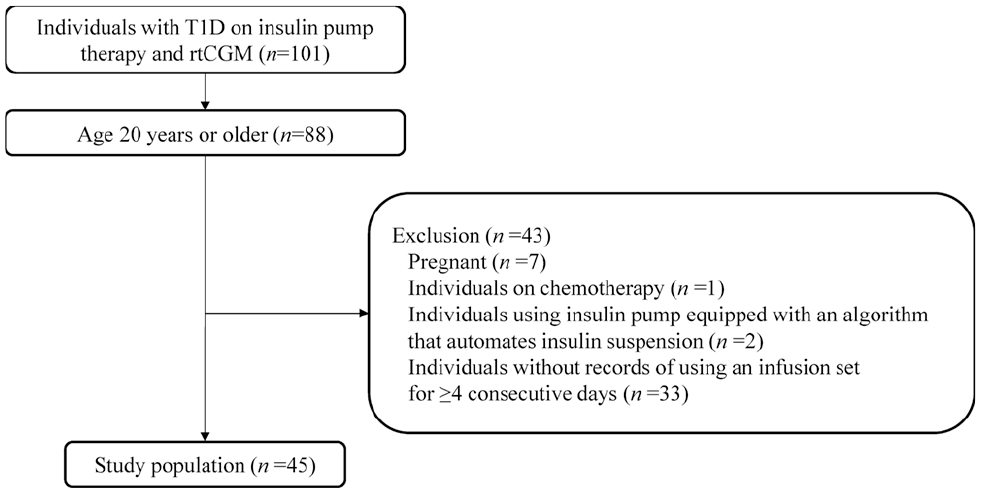
Derivation of the study population.
Patient and Dataset Characteristics.
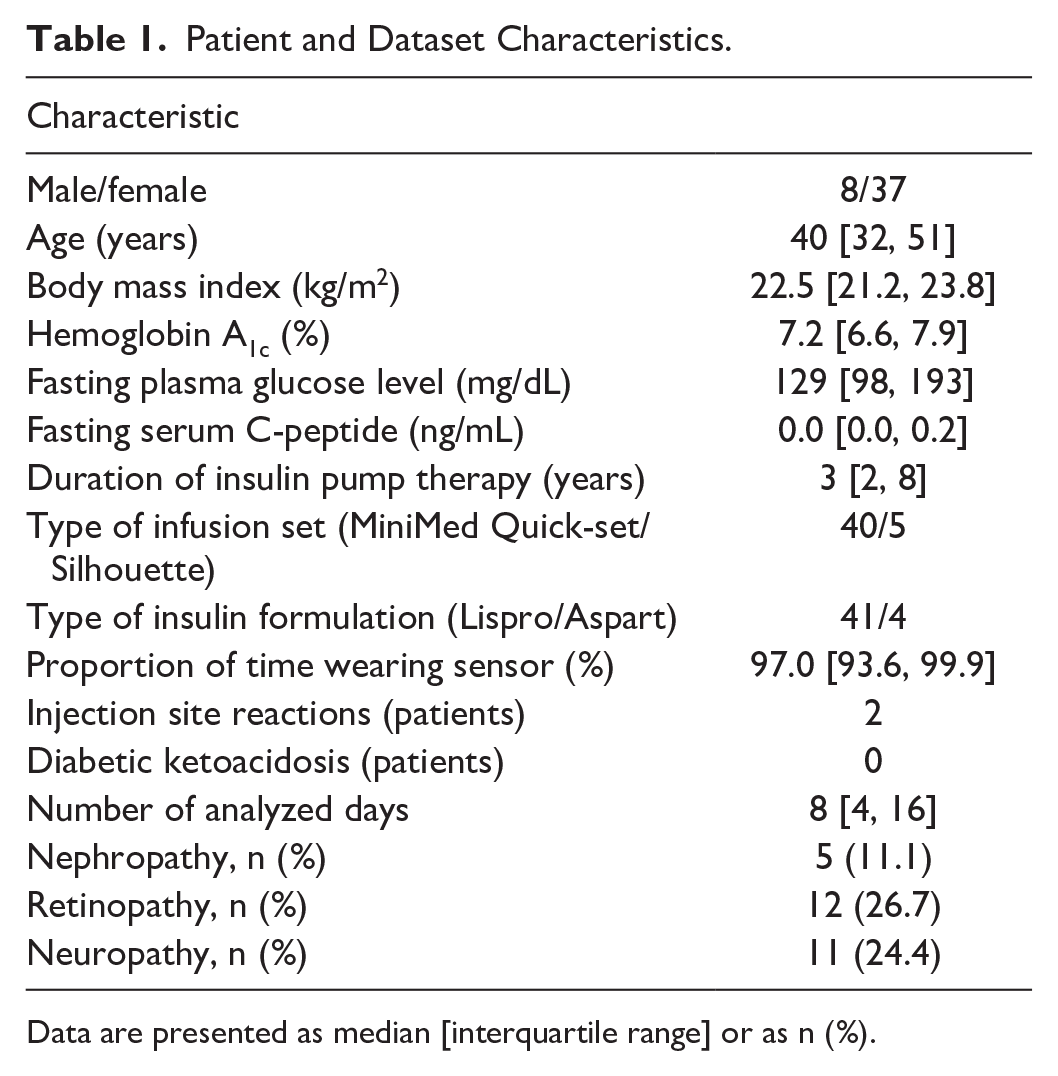
Data are presented as median [interquartile range] or as n (%).
Impact of Infusion Set Usage Duration
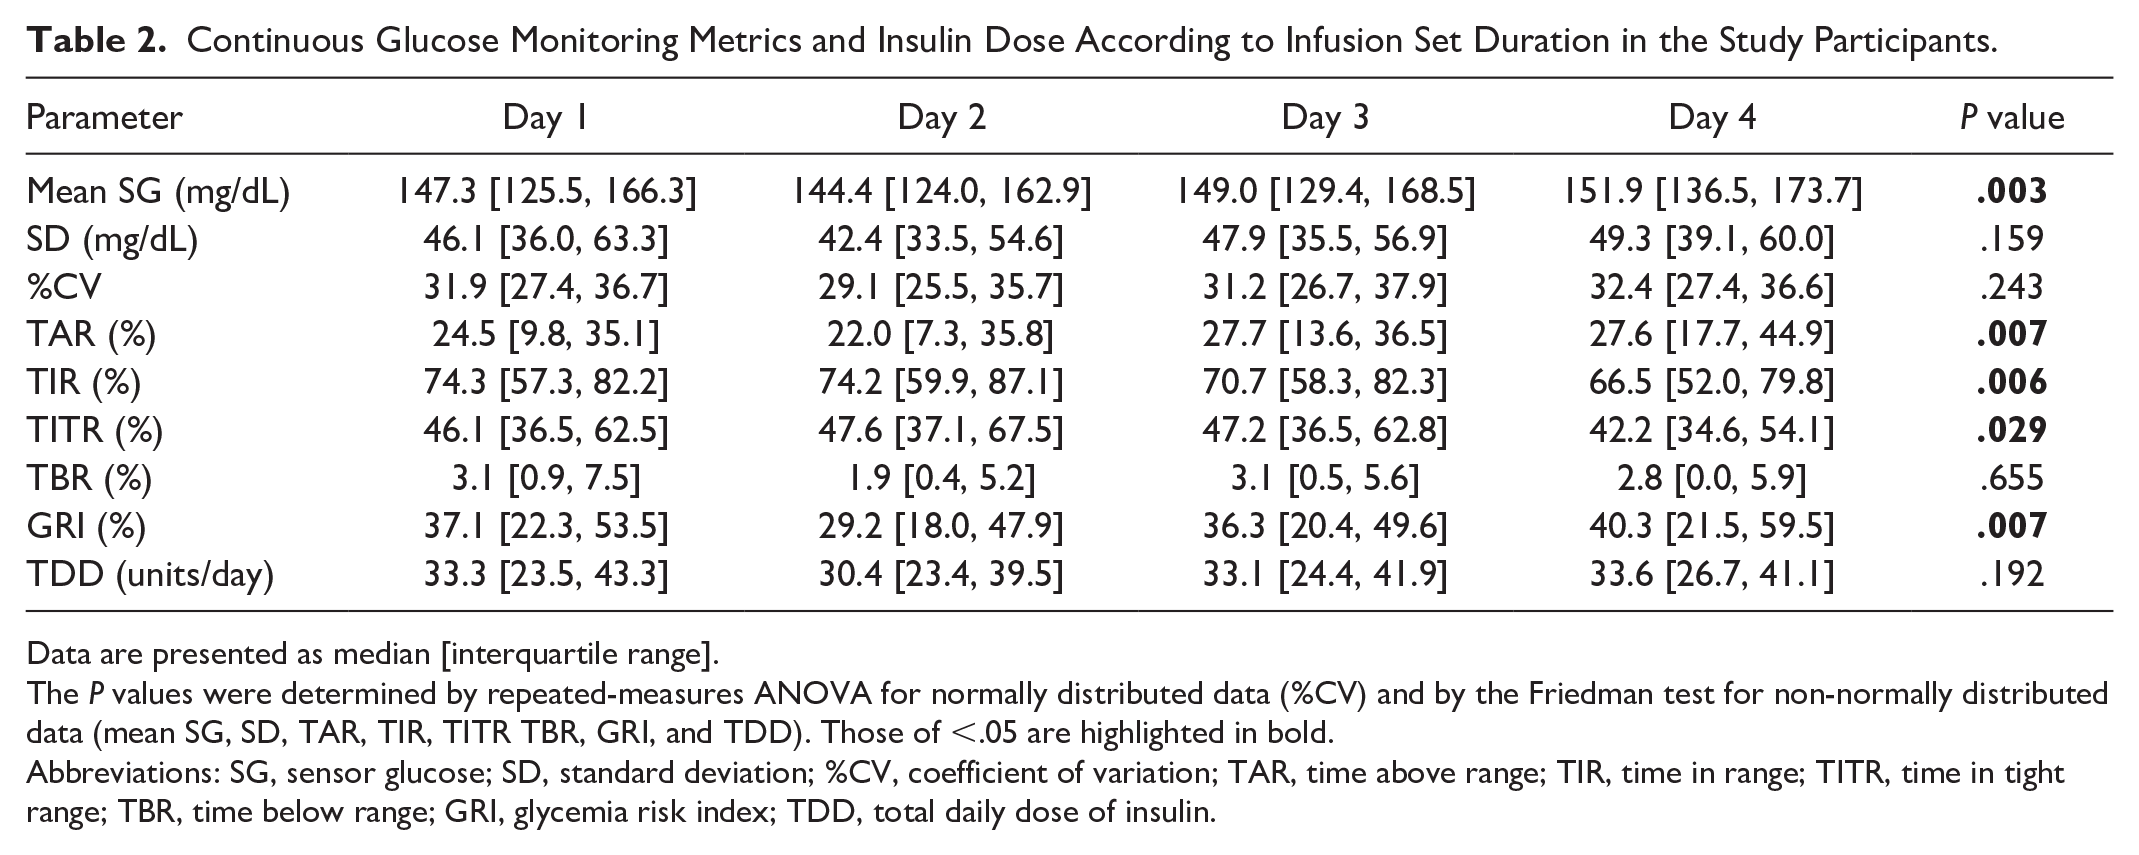
Using the constructed dataset, we investigated the impact of infusion set usage duration on glycemic management. Table 2 presents CGM metrics and insulin usage from day 1 to day 4. Mean SG differed significantly across days 1 to 4 (Friedman test, P = .003). Post hoc analysis revealed that the mean SG on day 4 (median of 151.9 mg/dL, with an IQR of 136.5-173.7 mg/mL) was significantly higher than that on day 2 (144.4 [124.0-162.9] mg/dL) (Holm-adjusted P = .024), whereas no significant differences were observed between other days (Figure 3, Table 2). Similarly, TAR, TIR, and TITR showed significant differences across days 1 to 4 (Friedman test: P = .007, P = .006, and P = .029, respectively). Post hoc analysis showed that TAR was significantly higher on day 4 (median of 27.6%, with an IQR of 17.7%-44.9%) than on day 2 (22.0% [7.3%-35.8%]) (Holm-adjusted P = .018), whereas TIR and TITR were significantly lower on day 4 (66.5% [52.0%-79.8%] and 42.2% [34.6%-54.1%], respectively) than on day 2 (74.2% [59.9%-87.1%] and 47.6% [37.1%-67.5%], respectively) (Holm-adjusted P = .018 and P = .042 for TIR and TITR, respectively) (Figure 3, Table 2). The SD, %CV, TBR, and TDD did not differ significantly across days 1 to 4. The GRI differed significantly across days 1 to 4 (Friedman test, P = .007) (Figure 4, Table 2). Post hoc analysis revealed that the GRI on day 4 (40.3% [21.5%-59.5%]) was significantly higher than that on day 2 (29.2% [18.0%-47.9%]) (Holm-adjusted P = .030), whereas no significant differences were observed between other days.
Continuous Glucose Monitoring Metrics and Insulin Dose According to Infusion Set Duration in the Study Participants.
Data are presented as median [interquartile range].
The P values were determined by repeated-measures ANOVA for normally distributed data (%CV) and by the Friedman test for non-normally distributed data (mean SG, SD, TAR, TIR, TITR TBR, GRI, and TDD). Those of <.05 are highlighted in bold.
Abbreviations: SG, sensor glucose; SD, standard deviation; %CV, coefficient of variation; TAR, time above range; TIR, time in range; TITR, time in tight range; TBR, time below range; GRI, glycemia risk index; TDD, total daily dose of insulin.
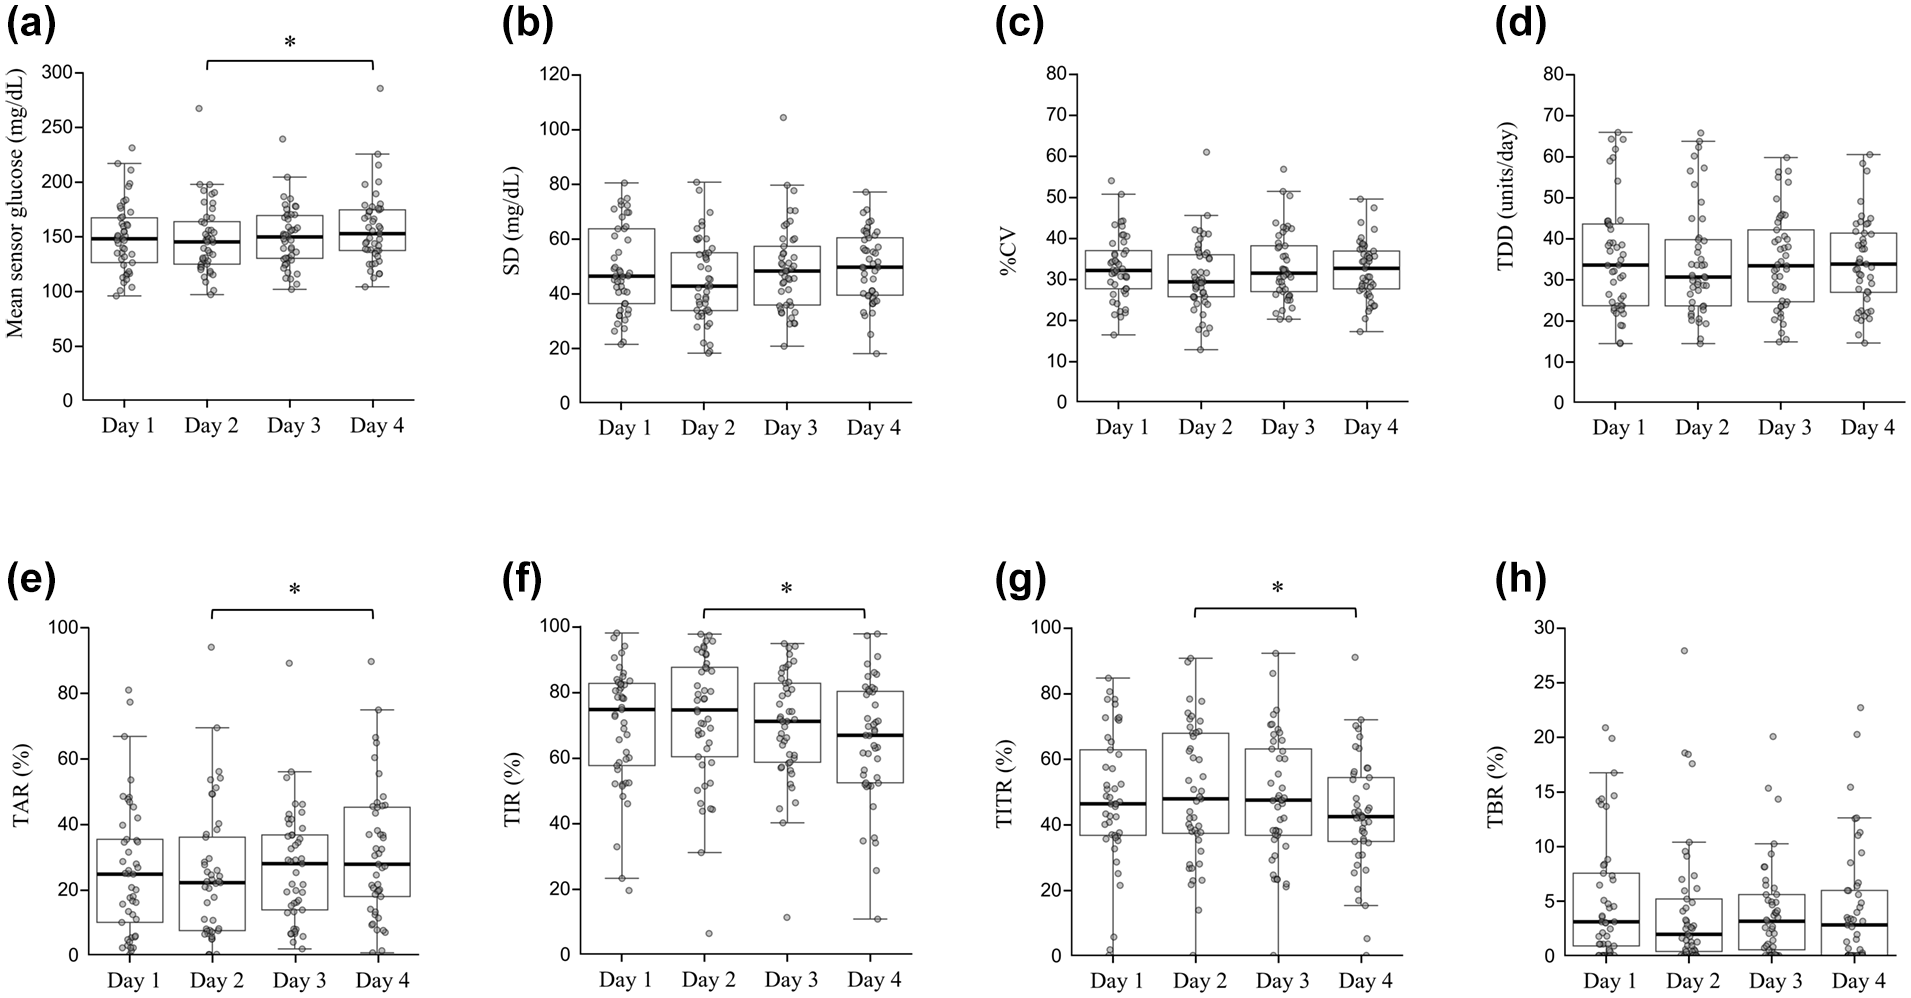
Changes in continuous glucose monitoring metrics and insulin dose across different days of infusion set wear: (a) mean sensor glucose, (b) standard deviation (SD) of sensor glucose, (c) coefficient of variation (%CV), (d) total daily dose of insulin (TDD), (e) time above range (TAR), (f) time in range (TIR), (g) time in tight range (TITR), and (h) time below range (TBR). Data are presented as box-and-whisker plots, with the boxes indicating median and upper and lower quartile values and the whiskers indicating the range excluding outliers. Outliers are defined as data points beyond 1.5 times the interquartile range from the upper or lower quartiles and are shown as individual points.
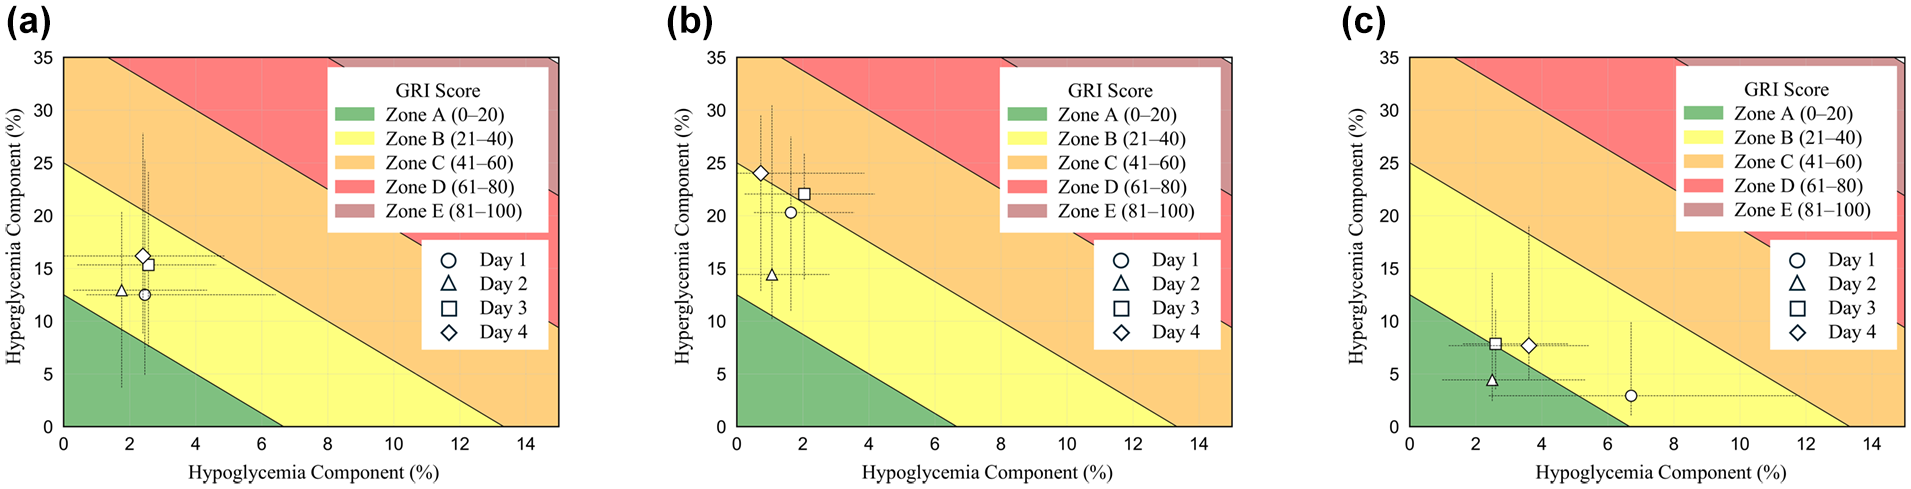
The median and interquartile range of the hyperglycemia component and hypoglycemia component on days 1, 2, 3, and 4: (a) all participants, (b) the hemoglobin A1c ≥7% group, and (c) the hemoglobin A1c <7% group. Zones A to E were defined based on a previously published study. 19
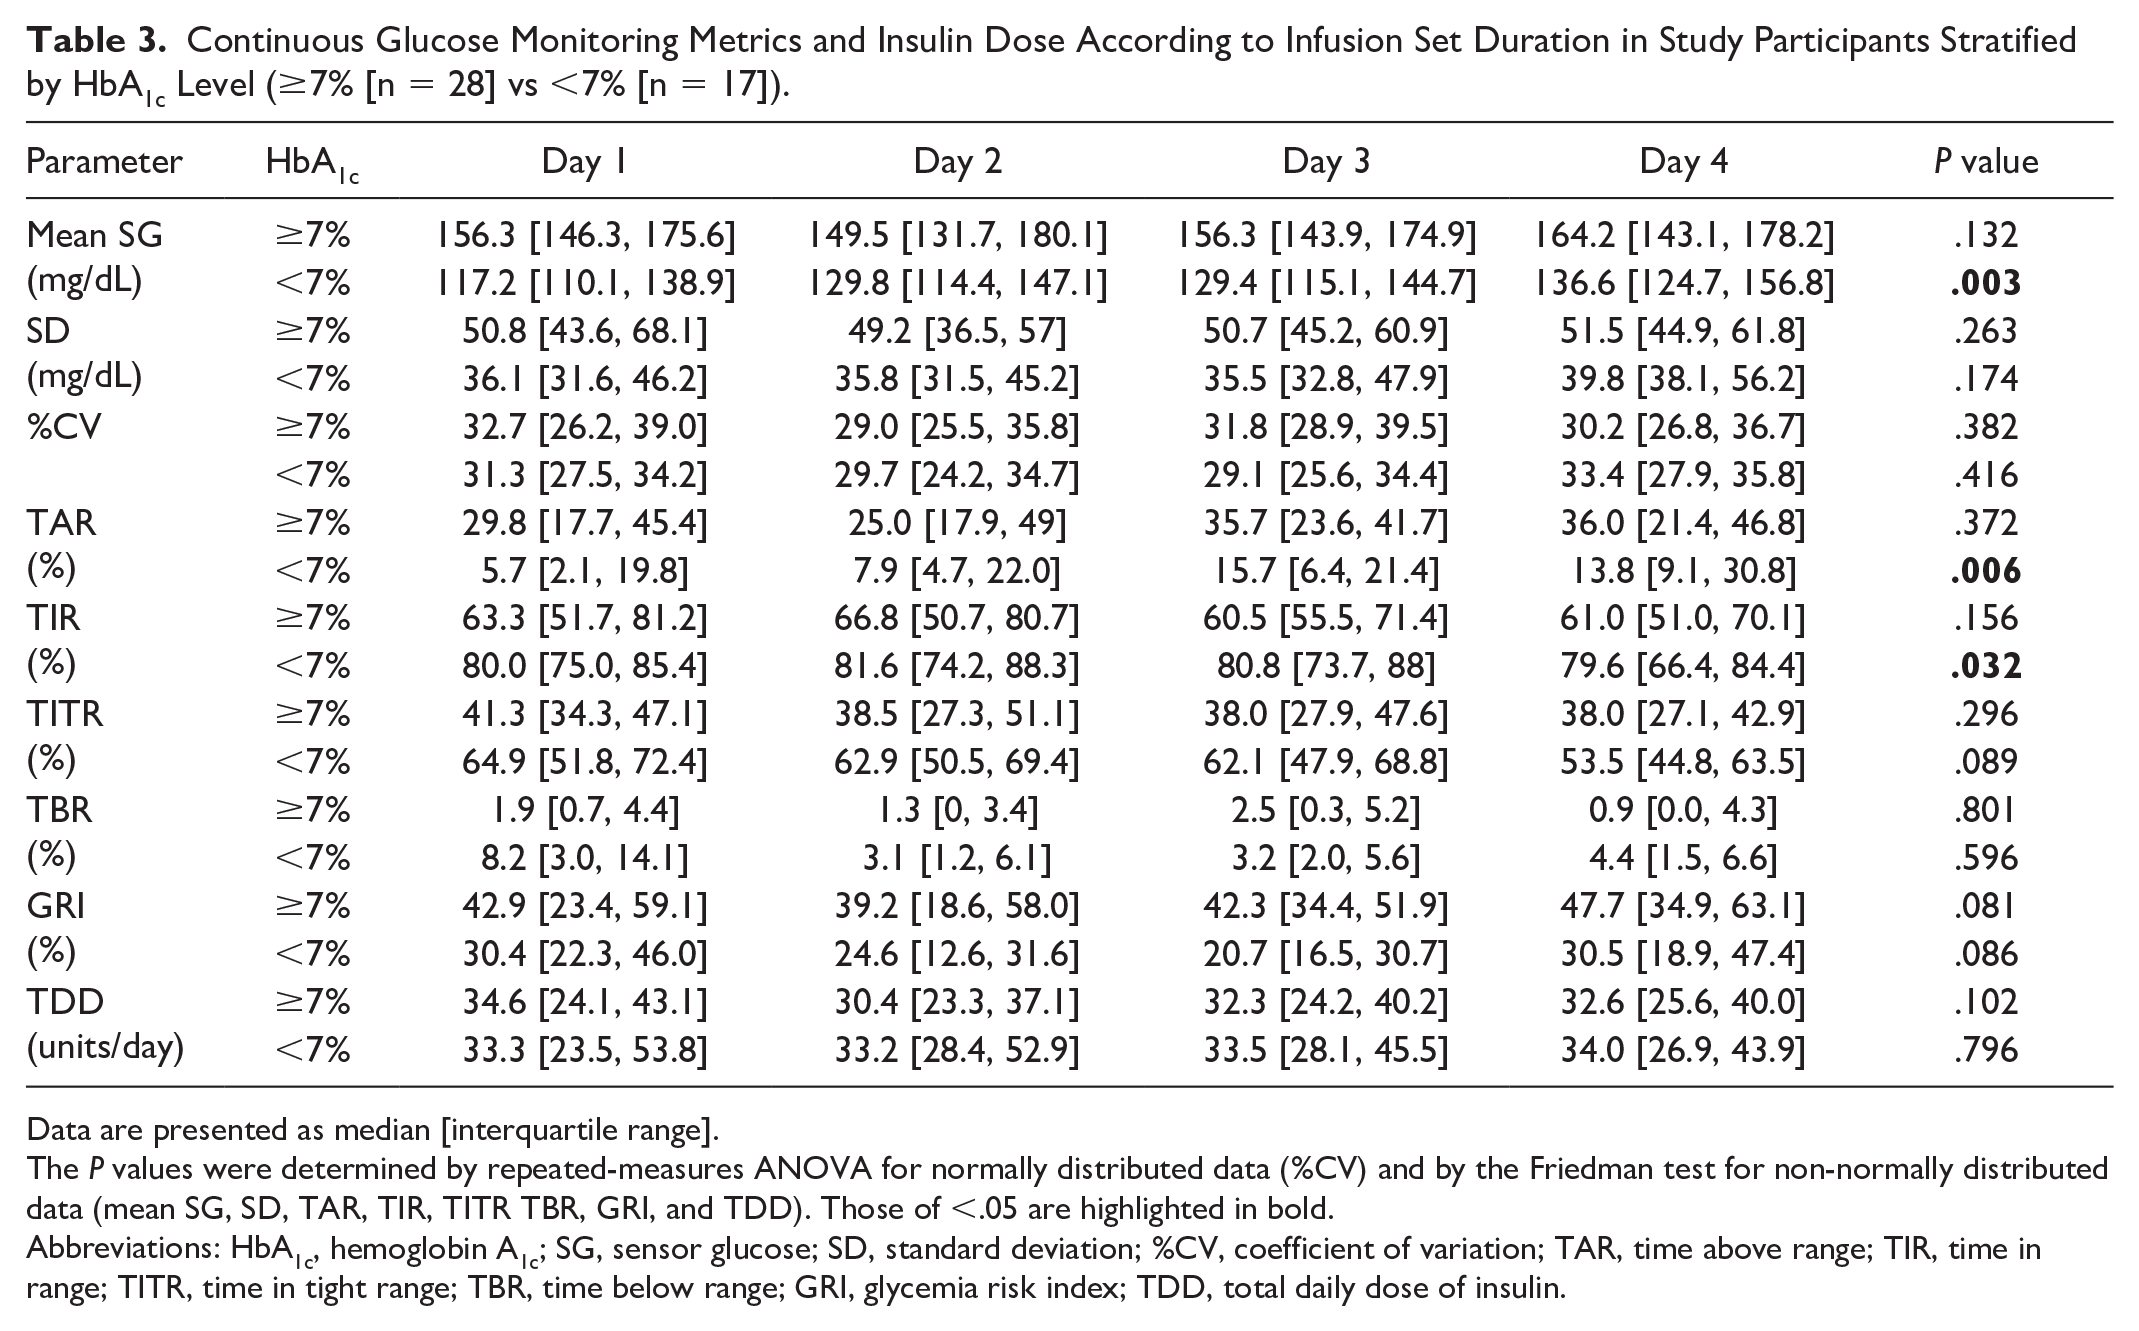
We divided the study participants into two groups on the basis of HbA1c level (≥7%, n = 28; <7%, n = 17) and performed variance analysis of CGM metrics and TDD (Figure 4, Table 3). In the HbA1c ≥7% group, no significant differences were observed across days 1 to 4 for any of the tested parameters. However, in the HbA1c <7% group, mean SG, TAR, and TIR showed significant differences across days 1 to 4 (Friedman test P = .003, P = .006, and P = .032, respectively) (Table 3). Post hoc analysis for the HbA1c <7% group revealed that mean SG was significantly higher on day 4 (median of 136.6 mg/dL, with an IQR of 124.7-156.8 mg/dL) than on day 1 (117.2 [110.1-138.9] mg/dL) (Holm-adjusted P = .024), TAR was significantly higher on day 4 (13.8% [9.1%-30.8%]) than on day 2 (7.9% [4.7%-2.0%]) (Holm-adjusted P = .036), and TIR was significantly lower on day 4 (79.6% [66.4%-84.4%]) than on day 2 (81.6% [74.2%-88.3%]) (Holm-adjusted P = .024) (Figure 5, Table 3).
Continuous Glucose Monitoring Metrics and Insulin Dose According to Infusion Set Duration in Study Participants Stratified by HbA1c Level (≥7% [n = 28] vs <7% [n = 17]).
Data are presented as median [interquartile range].
The P values were determined by repeated-measures ANOVA for normally distributed data (%CV) and by the Friedman test for non-normally distributed data (mean SG, SD, TAR, TIR, TITR TBR, GRI, and TDD). Those of <.05 are highlighted in bold.
Abbreviations: HbA1c, hemoglobin A1c; SG, sensor glucose; SD, standard deviation; %CV, coefficient of variation; TAR, time above range; TIR, time in range; TITR, time in tight range; TBR, time below range; GRI, glycemia risk index; TDD, total daily dose of insulin.
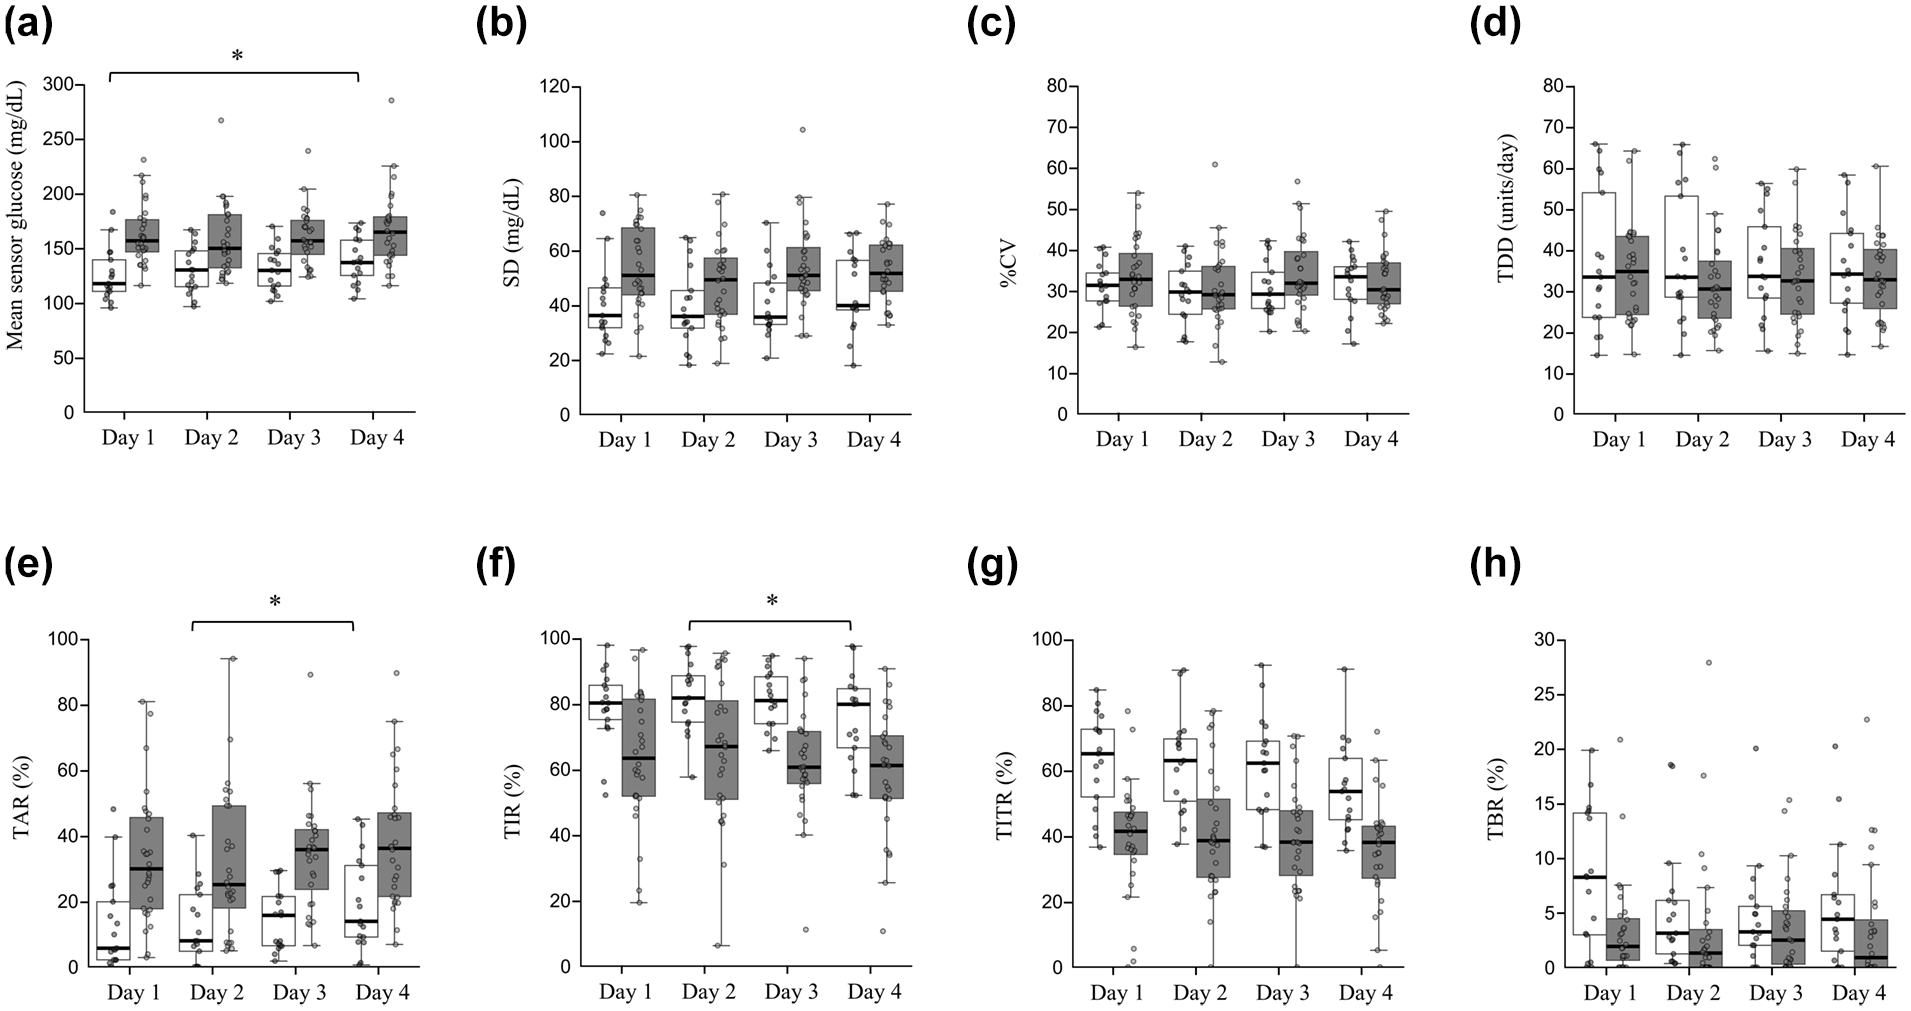
Changes in continuous glucose monitoring metrics and insulin dose across different days of infusion set wear stratified by hemoglobin A1c level (≥7% [shaded boxes] vs <7% [open boxes]): (a) mean sensor glucose, (b) standard deviation (SD) of sensor glucose, (c) coefficient of variation (%CV), (d) total daily dose of insulin (TDD), (e) time above range (TAR), (f) time in range (TIR), (g) time in tight range (TITR), and (h) time below range (TBR). Data are presented as box-and-whisker plots, with the boxes indicating median and upper and lower quartile values and the whiskers indicating the range excluding outliers. Outliers are defined as data points beyond 1.5 times the interquartile range from the upper or lower quartiles and are shown as individual points.
Discussion
Our findings suggest that extending infusion set use beyond three days is associated with less favorable glycemic control, as demonstrated by the increased mean SG, TAR, and GRI as well as a decreased TIR and TITR apparent on day 4. These results corroborate current recommendations for infusion set replacement within three days, underscoring the relevance of these recommendations to maintenance of optimal glycemic management.
The results of the stratified analysis by HbA1c level suggest that the impact of infusion set usage duration on glycemic management is more pronounced in individuals with better glycemic control. This finding implies that promotion of proper infusion set management may be especially important for those individuals who are generally achieving stable glycemic control.
Studies that have evaluated the impact of the duration of infusion set use on glycemia with the use of CGM have been few in number, and their findings have varied. A prospective study assessing the effects of lipohypertrophy on infusion set survival and glycemic management in 20 participants found that mean SG decreased on day 2, regardless of the presence or absence of lipohypertrophy, and subsequently increased over days 4 to 7. 11 The study participants used a Medtronic insulin pump and infusion set, and a protocol was implemented that included both carbohydrate restriction and corrective bolus administration for hyperglycemia. Another prospective study evaluated the effects of continuous infusion set use for 100 hours in 20 participants using two types of insulin analogs (Lispro and Aspart), reporting that mean SG increased monotonically with the duration of infusion set use, regardless of the type of insulin. 12 Insulin dosage was self-reported by the participants, standardized breakfasts were provided, and a protocol requiring immediate infusion set replacement at the onset of hyperglycemia was applied. However, the types of insulin pump and infusion set used were not specified. The discrepancies in findings across studies may be attributable to differences in device types, study protocols used in prospective research, and data analysis methods. Insulin pump and CGM logs comprise large and complex time-series data that present technical challenges to their analysis. In the present study, we adopted a programmatic approach to accurately analyze insulin pump and rtCGM logs, allowing the generation of a high-quality dataset that reflects real-world conditions. This approach allowed for an assessment of the impact of infusion set usage duration in actual clinical settings, and, as far as we are aware, our study is the first to adopt such a methodology. Malfunction related to infusion sets accounts for the largest proportion of insulin pump–related recalls reported by the U.S. Food and Drug Administration. 26 Despite its clinical importance, the transparency of real-world safety and adverse event data for insulin pump therapy–related devices, including infusion sets, remains insufficient. This issue was highlighted in a joint statement by the ADA and European Association for the Study of Diabetes, emphasizing the need for continued real-world performance evaluations of these devices. 26
Our finding that glycemic management was better on day 2 than on day 4 of infusion set use is consistent with previous observations.9,11 Of note, the observed differences in glycemic management despite the absence of significant changes in TDD are suggestive of changes in insulin action. The impact of prolonged infusion set use on insulin pharmacodynamics is thought to be governed by a complex system involving various factors such as inflammation, tissue fibrosis, subcutaneous adipose tissue blood flow (ATBF), and silent occlusion.13,26,27 However, these underlying mechanisms remain insufficiently understood. The ATBF is considered one of the most important determinants of the insulin absorption rate from the subcutis. 28 Given this complexity, interpretations drawing direct connections with prior physiological findings should be made with caution. Interestingly, a study using 133Xenon clearance to measure ATBF at the catheter insertion site up to day 4 reported that ATBF peaked on day 2 and declined by day 4. This aligns with our finding that glycemic levels were lower on day 2 than on day 4, suggesting consistency with prior observations of ATBF dynamics. 28
There are several limitations to the present study. First, the study design had limitations with regard to the detection of skin complications and infusion set dislodgement because of the reliance on medical records for reporting. However, the design allowed a precise evaluation of the impact of infusion set usage duration on glycemic management in real-world settings. Second, the influence of diverse infusion set types and insulin formulations on study outcomes was not analyzed because of sample size limitations, but it is acknowledged as a potential confounding variable. Third, the exclusion of individuals using automated insulin delivery systems and the focus on a specific type of insulin pump and CGM system may limit the generalizability of our findings. Infusion sets designed for up to seven days of continuous use are available in some countries. These devices differ structurally from conventional infusion sets in various ways, such as the inclusion of in-line filters, 29 which may influence their effects on glycemic management. The duration of CGM use has increased in recent years, and extending the use of infusion sets has been highlighted as an important issue because of its potential to reduce health care costs and to improve convenience.13,30 The real-world performance of these newer devices warrants further evaluation. Another important limitation is that we were unable to adjust for other factors that may have influenced differences in glycemic management. Moreover, the observed day-by-day changes were based on post hoc analysis. Therefore, causal inference regarding the relationship between prolonged infusion set use and changes in glycemic control requires further investigation. Finally, our investigation was limited to the initial four-day period of infusion set utilization, and the study protocol did not account for interindividual variability in response to extended use. However, given that adverse effects of prolonged infusion set use were already apparent by day 4, we believe that our study sufficiently demonstrates the clinical impact of infusion set use duration. The feasibility of infusion set use for extended periods has been found to vary substantially among individuals, and the factors underlying this variability remain unclear.5,31,32 These issues emphasize the necessity for individualized management approaches and additional research in this area.
Conclusions
We have shown that prolonged infusion set use was associated with deterioration in glycemic management in real-world clinical settings and quantified the extent of such deterioration using CGM metrics. Even among individuals with well-controlled glycemia, this association was not negligible, highlighting the need for education and guidance with regard to proper technique for device utilization.
Footnotes
Acknowledgements
Kai Yoshimura, who was responsible for data analysis, received instruction in data science at The University of Tokyo Chair for Global Consumer Intelligence.
Abbreviations
DKA, diabetic ketoacidosis; CGM, continuous glucose monitoring; rtCGM, real-time CGM; SG, sensor glucose; ADA, American Diabetes Association; TAR, time above range; TIR, time in range; TITR, time in tight range; TBR, time below range; SD, standard deviation; %CV, coefficient of variation; TDD, total daily dose of insulin; BMI, body mass index; HbA1c, hemoglobin A1c; IQR, interquartile range.
Author Contributions
Declaration of Conflicting Interests
The author(s) declared the following potential conflicts of interest with respect to the research, authorship, and/or publication of this article: W.O. has received lecture fees from Nippon Boehringer Ingelheim Co Ltd, Sumitomo Pharma Co Ltd, and Novo Nordisk Pharma Ltd; research expenses (including for contracted research, joint research, and clinical trials) and grants from Abbott Diabetes Care UK Ltd, Eli Lilly Japan K.K., Nippon Boehringer Ingelheim Co Ltd, Novo Nordisk Pharma Ltd, Noster Inc, Teijin Pharma Ltd, and Sumitomo Pharma Co Ltd; and scholarship donations from Sumitomo Pharma Co Ltd, Teijin Pharma Ltd, and Takeda Pharmaceutical Co Ltd. Y.H. has received lecture fees from Eli Lilly Japan K.K., Sanofi, Terumo Corp, Sumitomo Pharma Co Ltd, Novo Nordisk Pharma Ltd, and Abbott Japan LLC; research expenses (including for contracted research, joint research, and clinical trials) and grant from Sumitomo Pharma Co Ltd, Kyowa Kirin Co Ltd, Medtronic Japan Co Ltd, and Nippon Boehringer Ingelheim Co Ltd; and scholarship donations from Abbott Japan LLC. All remaining authors declare that there is no conflict of interest.
Funding
The author(s) received no financial support for the research, authorship, and/or publication of this article.
ORCID iDs
Data Availability
The datasets and source code used for analysis during the current study are not publicly available but are available from the corresponding author on reasonable request.