
Abstract
Aims:
This study reports continuous glucose monitoring (CGM) adherence patterns and contributing factors in patients who were part of a 6-month clinical trial using sensor augmented pump therapy with low glucose insulin suspension.
Methods:
CGM data from 38 patients using sensor augmented pump therapy for 6 months were analyzed. CGM adherence was defined by having a working sensor available and determined by the time it was switched on as a proportion of available time for the 6 month study period with allowance for practical CGM use. Age, gender, HbA1c, duration of diagnosis, capillary blood glucose testing frequency, sensor accuracy, and insulin pump alarm frequency were characterized and examined for an association with CGM adherence.
Results:
Overall CGM adherence was 75% (range: 35% to 96%), CGM adherence was demonstrated to fall after 9 to 11 weeks before reaching a steady rate. CGM adherence patterns showed substantial variation. Mean adherence differed (P < .01) between age groups 72% (<12 years), 69% (12-18 years), and 88% (≥18 years). Sensor accuracy predicted adherence, where every 1% decline in mean absolute difference in a given week was associated with a 0.5% decline in sensor adherence (P < .01). Gender, HbA1c, duration of diagnosis, capillary blood glucose testing frequency, and insulin pump alarm frequency were not associated with CGM adherence.
Conclusions:
CGM adherence and patterns of use are individualized. However, a predictable fall in adherence at 9 to 11 weeks may present an opportunity for timed interventions to increase CGM use. Adolescent age and sensor accuracy predict CGM adherence.
Keywords
Emerging technologies for diabetes management utilize continuous glucose monitoring (CGM) systems as an essential component: for example sensor augmented pump therapy, sensor augmented pump therapy with low glucose suspend (or threshold suspend), sensor augmented pump therapy with predictive low glucose suspend, and closed loop insulin delivery (or artificial pancreas). CGM has been shown to improve glycemic control and reduce hypoglycemia;1-8 furthermore, modern technologies that use CGM have the potential to lessen the patient and family burden of care. Despite this, even when CGM cost is eliminated, consistent use of CGM technology is low. 1 It has been suggested that limitations of inaccuracy and inconvenience may be factors resulting in low CGM uptake in the outpatient setting. 3 As such, understanding patient factors and behavior that limit CGM adherence is important.
Many studies have reported predictors of CGM use, the relationship between use and benefits in glycemic control, and CGM use over time,1-7,9,10 However, all of these studies have derived CGM use by examining processed CGM data downloads, and some only report on short snap shots of sensor data rather than the entire data set. The limitation of using CGM software downloads, is that it interprets CGM use as a proportion of the day where a sensor value is recorded, and does not take into account CGM warm-up periods, short periods when the CGM sensor is switched off by the patient for sport or other activities where CGM is not practically possible, or CGM lifespan ending at a time of day where it would be unreasonable to expect a new CGM to be initiated. It then follows that CGM use as reported by these trials underestimates what can be considered CGM adherence, is likely to be biased by certain patient lifestyles, and doesn’t allow for robust, detailed analysis of patient-CGM interaction.
To address this problem, detailed CGM download data were retrospectively examined from a 6 month trial where CGM was used as a component of a low glucose suspend (LGS) system. 9 Individual CGM use was analyzed for an extended period of up to 6 months. CGM warm-up periods, intentional appropriate sensor switch offs, and the timing of end of sensor lifespan where it would be unreasonable to expect a patient to replace it (during the night for example) could be identified and accounted for. Defined criteria were then applied to these data to define CGM “adherence,” as opposed to sensor “use.”
We aimed to analyze these data to identify possible strategies to improve outpatient sensor adherence by exploring (1) technical CGM factors that affect adherence, (2) CGM adherence changes with time, (3) patterns of CGM adherence, and (4) patient factors that predict CGM adherence.
Methods
Subjects
Data from a trial of low glucose insulin suspension was analysed. 9 Subjects were aged 4 to 50 years with type 1 diabetes, all had impaired hypoglycemic awareness (Modified Clarke score > 4) and were receiving insulin pump therapy. Individual raw CGM and pump data were obtained from the 6 month study and analyzed for CGM adherence. Participant data were included only when there was a minimum of 160 days of CGM data available for analysis. Data for all participants were truncated to the first 180 days, which was the end of the primary phase of the trial. Individual CGM accuracy was calculated using the mean absolute relative difference (MARD) between the sensor glucose reading and capillary blood glucose entered into the insulin pump.
Defining Adherence
CGM adherence was defined for each minute of the 6 month study period based on the participant having both a working sensor fitted and not deactivated. Situations where CGM was not used because of impracticality were not recorded as nonadherent; these were as follows:
The maximum time period for patient directed discontinuation of use of CGM was 2 hours during the night (21:30 to 06:59), and 4 hours during the day (07:00 to 21:29). This period of time was to accommodate sport and leisure pursuits incompatible with CGM adherence.
When a sensor expired during the day, and was replaced prior to 19:00 on the same day, the full period was considered adherent. If the sensor expired during the night (after 19:00), and was replaced prior to 19:00 the following day the full period was considered adherent. This allowance was to accommodate the practical considerations of changing a sensor (calibration and warm-up period), which is especially inconvenient overnight.
Statistical Analysis
Following the implementation of the adherence algorithm, the data were in the form of minutely data where each minute was tagged as either “adherent” or “non adherent.” Statistical analysis involved calculating the percentage of time when the participant was adherent over difference periods (day, week, month) from the commencement of the study. Percentage of time adherent is displayed using mean and standard deviation (SD), mean and 95% confidence interval (95% CI), or mean and range, aggregated over all study participants, as appropriate. For continuous outcomes (eg adherence), Student’s t tests, 1-way ANOVA, or Pearson’s correlation were used where there were 2 comparison groups, 3 or more comparison groups or a continuous variable respectively; the chi-square test was used for dichotomous outcomes. For comparisons over time (aggregated to study week) linear mixed effects models were used to ensure the appropriate adjustments were made to allow for the within-person correlation across time. The nlme package was used to fit the models with a random intercept and slope term 11 with continuous variables centered; model fit was evaluated via an extended R2 function. 12 All data manipulation and analysis was completed using R and figures were produced using the ggplot2 package.13,14
Results
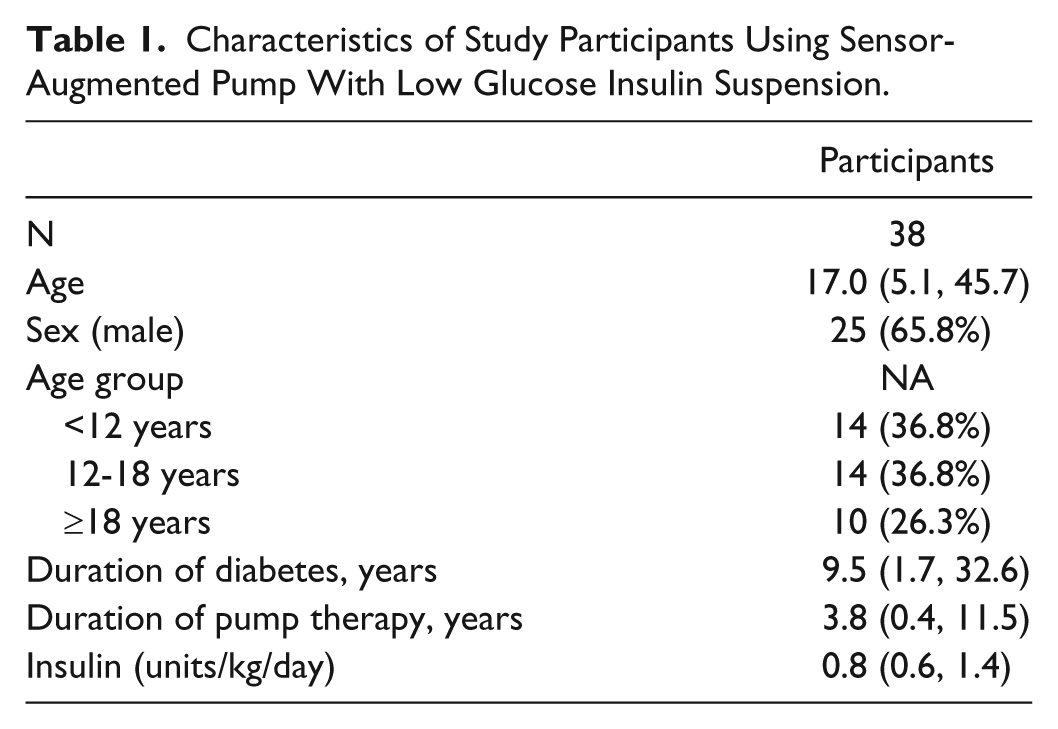
There were 46 participants in the LGS study randomized to the intervention (LGS arm). From this arm during the study period, 1 participant moved out of state, 1 participant was lost to follow-up, 3 participants withdrew from the study, and 3 participants remained in the study but did not continue to wear sensors for the full 6-month study duration (due to irritation issues with the sensor tape) and hence had insufficient data for analysis. Data from the remaining 38 participants were available for further analysis within this study. The mean age of these participants at commencement of the study was 17.0 years (range 5.1, 45.7), 65.8% were male, and mean duration of diabetes was 9.5 years (see Table 1).
Characteristics of Study Participants Using Sensor-Augmented Pump With Low Glucose Insulin Suspension.
Technical Factors
To assess sensor accuracy, the absolute difference between each individual finger prick value and the preceding sensor value (pairs only included where they were less than 5 minute apart) was calculated as a percentage of the finger prick value; there were over 27,000 pairs available for analysis. The data were right skewed as we observed a significant number of pairings with a large (over 50%) difference; the MARD for sensor performance was 30.6% (median 19.5%). Care was taken to include only 1 capillary blood glucose level entered into the insulin pump during a hypoglycemic event (where it is known that both capillary blood glucose meters and CGM are least accurate). Intraindividual MARD showed notable week-to-week variability, with the within-person SD ranging from 4.7% to 55.7% (mean 13.5%). This study used 2 generations of CGM: initially Medtronic Sof Sensor, followed later by Medtronic Enlite (Medtronic MiniMed, Northridge, CA). Adjusting for time, MARD was associated with overall adherence, where an increase in the mean weekly MARD of 1% was associated with a 0.35% decrease in adherence (P < .001). The final model included a quadratic term for MARD and explained 66% of variation in adherence, of which 8.5% was attributable to the fixed effects of MARD.
To further investigate the effect of poor sensor accuracy on adherence we compared the overall MARD for the top 3 overall adherent patients with the 3 least adherent. The 3 most adherent participants had a MARD of 42%, 15%, and 72%, respectively, while the least adherent participants had a MARD of 21%, 22%, and 23%.
The number of times the system alarmed was also calculated, with the overall mean number of alarms per participant per week being 58.6, ranging from 20.2 to 185.7. When alarms for the participant to input a finger prick blood glucose level for CGM calibration and weak signal (a silent alarm) were excluded, the overall mean was 42.5 alarms per week, ranging from 14.8 to 126.8. Sensor adherence in the final 16 weeks of the study was not predicted by the mean number of alarms in the first 10 weeks of the study.
CGM Adherence Change With Time
The mean percentage of time adherent across the 6-month study period was 75% (range 35% to 96%); 22 (58%) participants were adherent for greater than 75% of the study period. Adherence was aggregated across participants and assessed on a weekly basis from the study commencement date (Figure 1).
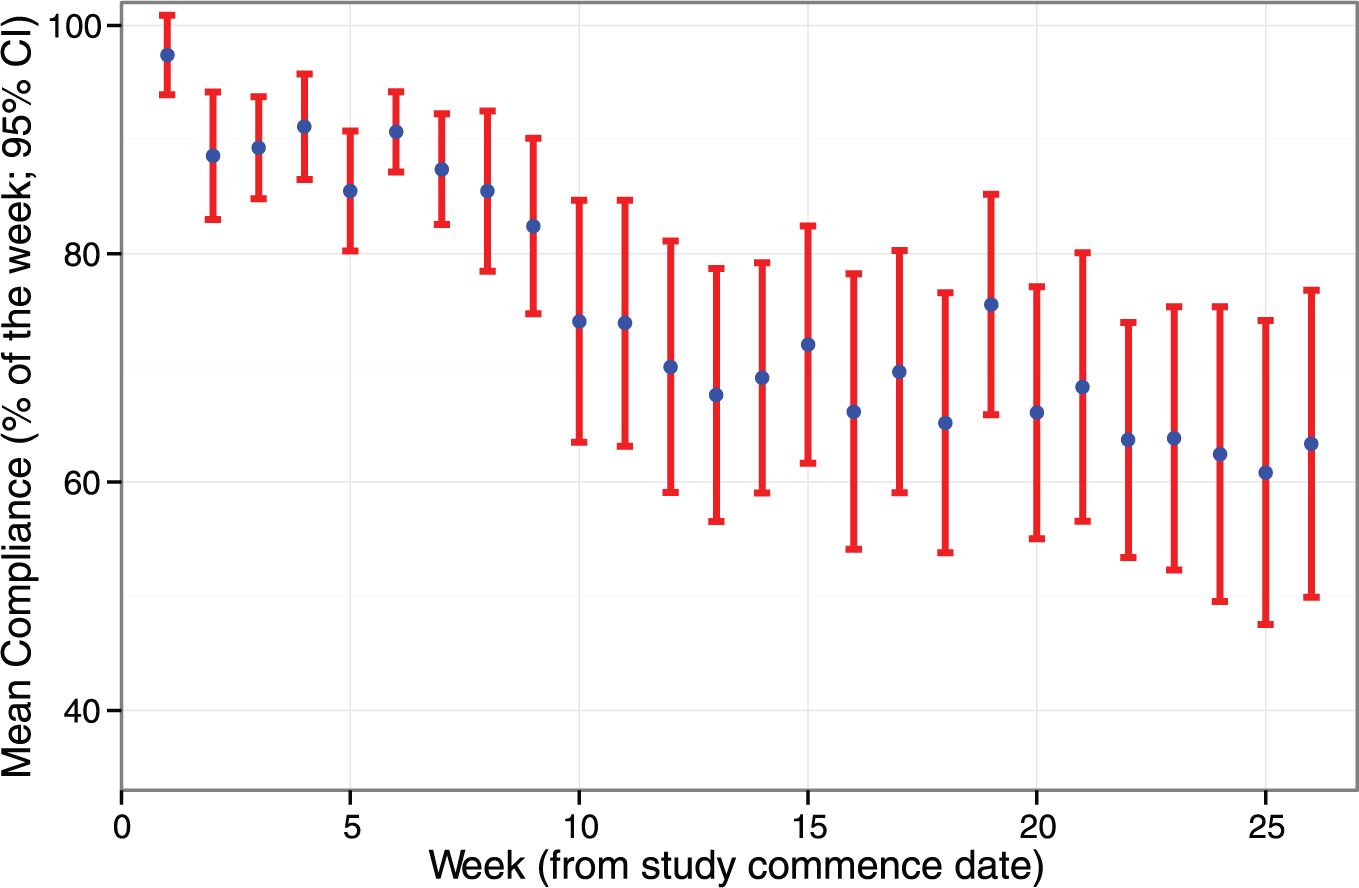
Mean and 95% confidence interval (CI) for adherence per week from study commencement.
There was an initial decrease in mean adherence after the first week, and a further decrease between the 9th and 11th weeks (from 82.4% to 73.9%). Overall, from week 11 to week 26, mean adherence was relatively stable (slope statistically insignificant; P = .1) remaining above 60% for the duration of the study. There was no change in the frequency of study staff follow-up to account for this observation. While mean weekly adherence across the cohort appeared to stabilize, there remained substantial interindividual variations through the study period; patterns of adherence behavior are presented in Figure 2. These data highlight how similar levels of overall adherence can be achieved with different adherence patterns, for example, the 16th participant had an overall adherence of 85% and had good adherence for the majority of the study until the last few study weeks where adherence was notably low, whereas the 17th participant, who had a similar overall adherence of 84%, had a consistent pattern of low adherence on alternate weeks throughout the study.
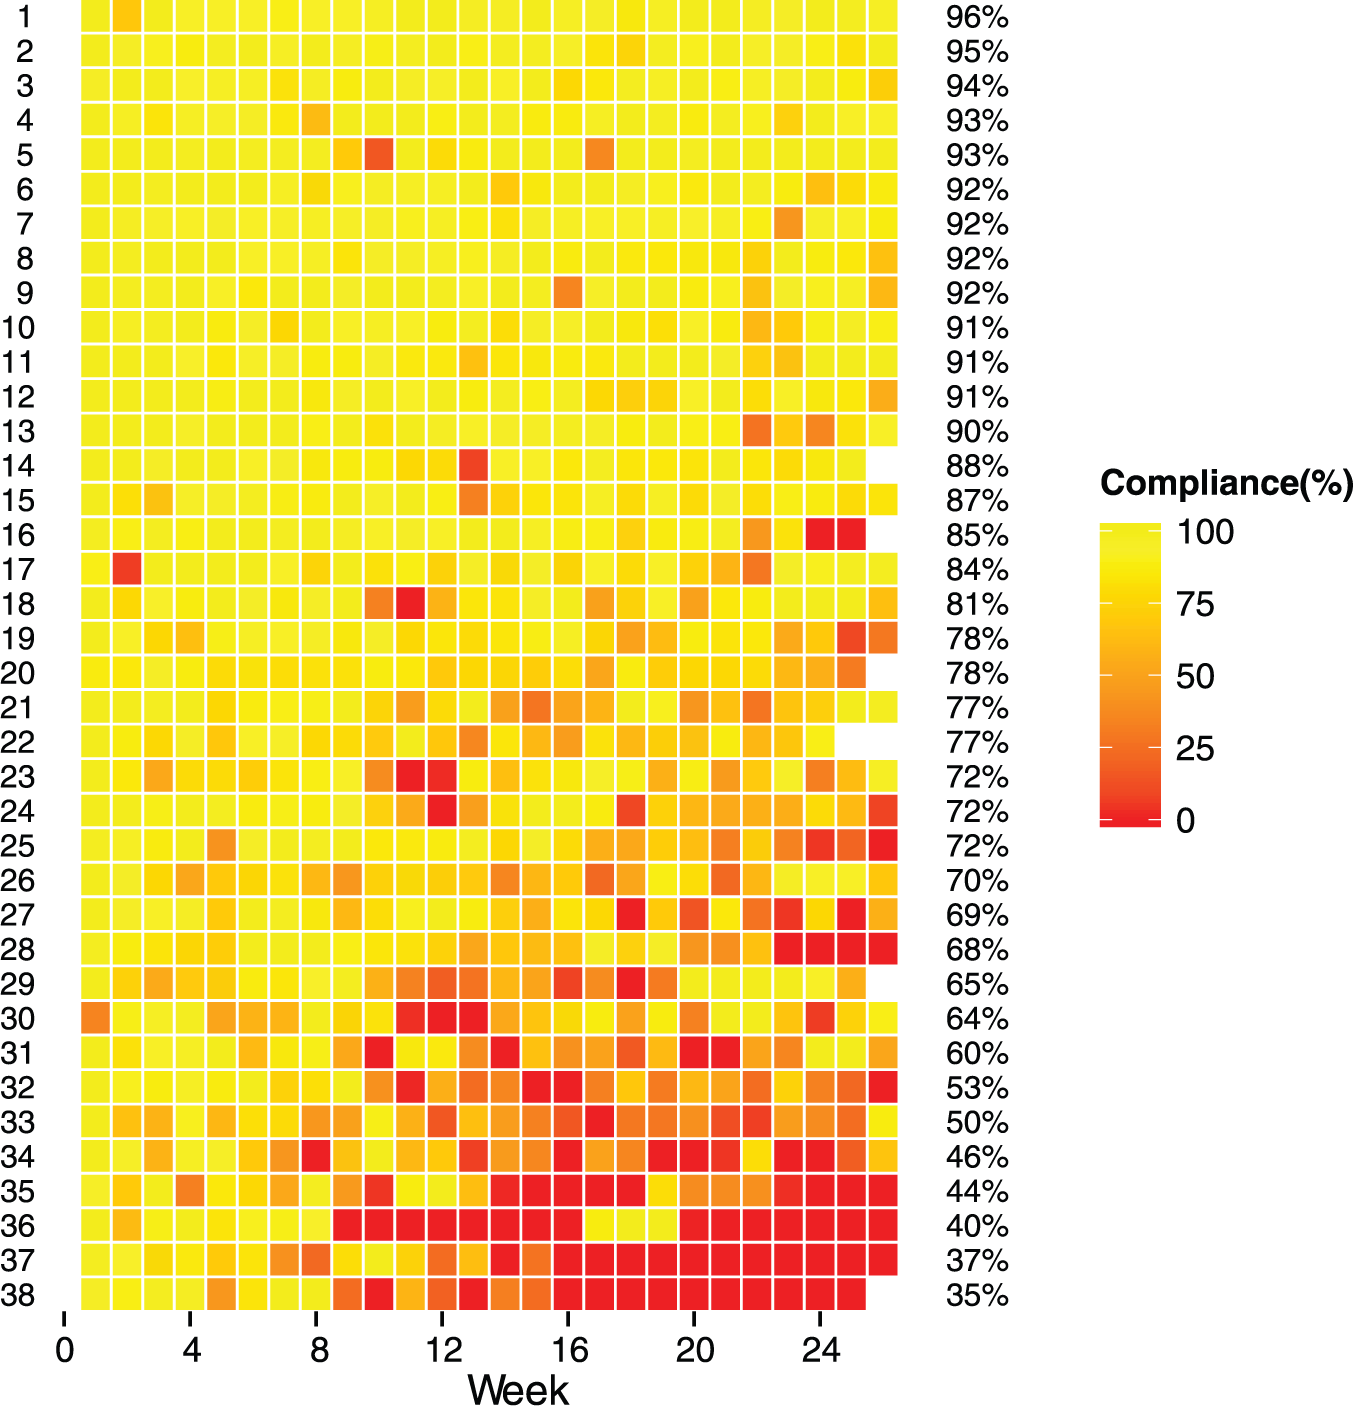
Ranked (based on overall adherence percentage) week-to-week adherence percentage from study commencement, 1 row per participant.
Patterns of CGM Adherence
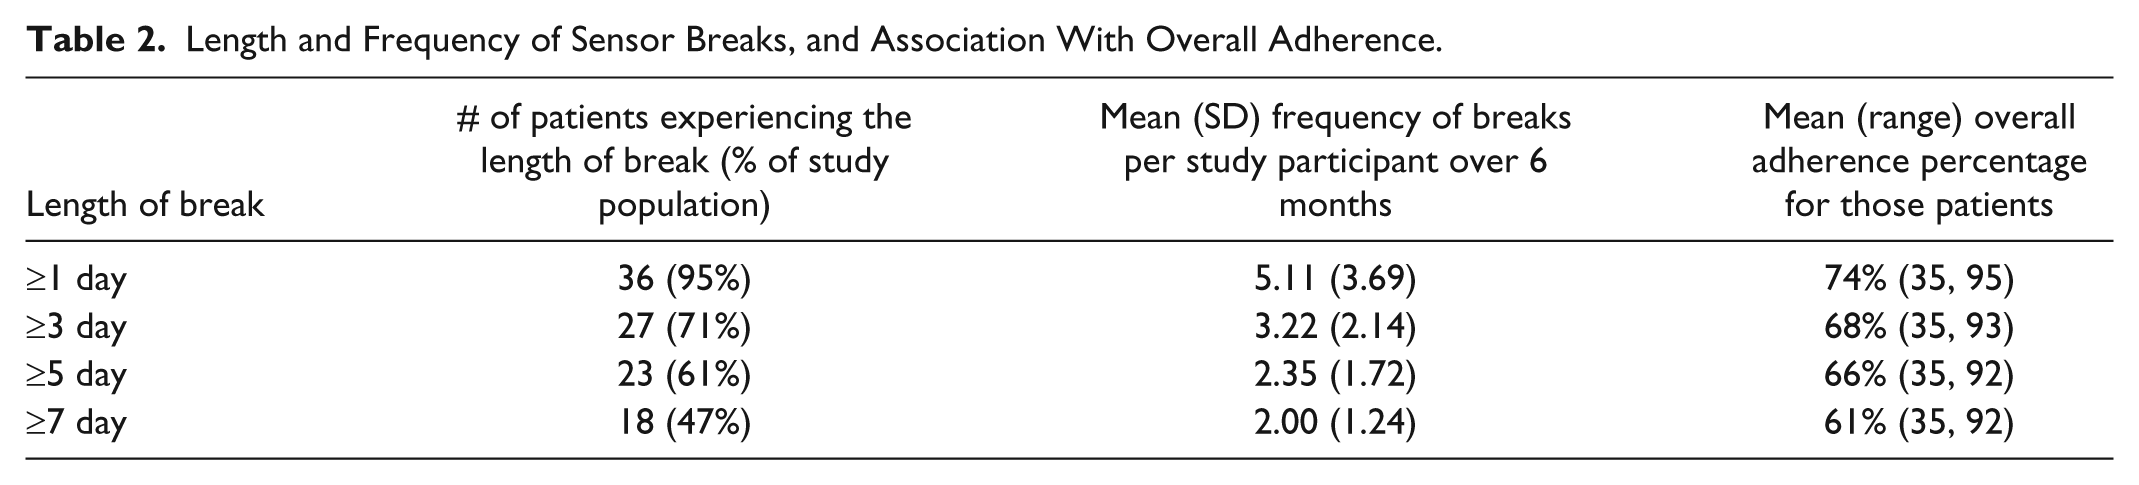
In total there were 183 periods of nonadherence for greater than 1 full day across 36 of the 38 participants, ranging from 1 to 16 per person, mean 5.1 days. Only 2 of the 38 participants completed the 6-month study without a single full day break, while 47.4% of all participants had at least 1 non adherent period of at least 7 consecutive days. A further breakdown of prolonged non adherence is provided in Table 2. For example, 61% of participants had a break of 5 days or longer, which recurred at a mean of 2.4 times during the study period. Those who had at least 1 break of at least 7 days (47% of participants) were more likely to be older (20.2 vs 13.5 years; P = .05) with a longer duration of diabetes (12.3 vs 6.4 years; P < .01) and had a lower overall adherence (61.3% vs 87.4%; P < .001). There were no differences between these groups for gender or initial HbA1c. There were no specific interventions from the study team to explain the timing between extending breaks and a return to improved adherence
Length and Frequency of Sensor Breaks, and Association With Overall Adherence.
The number of times the participant voluntarily switched the sensor off while still being available to use was also calculated. Only 2 of the 38 participants did not proactively switch off their sensor during the 6-month study period. Across the remaining 36 participants there were 852 instances where the sensor was switched off. The mean number per participant was 23.7, range 1 to 89. Of these switch offs, 292 (34.3%) occurred overnight between 9
Patient Factors
There was no association between overall adherence and gender (mean adherence; females 77%, males 74%). Mean adherence differed across the age groups, 72%, 69%, and 88% (for age groups <12 years, 12-18 years, and ≥18 years, respectively, P < .01). No association was observed between overall adherence and initial HbA1c, change in HbA1c during the study period, or duration of time on pump therapy.
The overall mean number of finger prick glucose values per week entered into the pump was 35.5, ranging from 10.7 to 66.6. There was no association between the mean number of finger prick glucose values entered into the pump per week and overall adherence (P = .58).
Discussion
This study reports the first detailed analyses of long-term CGM data to characterize CGM adherence over time, CGM adherence patterns, patient factors that determine CGM adherence, and technical factors. Overall, CGM adherence was 75%, comparing favorably to clinical trials 8 as well as outpatient based studies that were not part of a clearly defined clinical trial. 1 The finding that CGM adherence declines with time is consistent with other reports, 8 but by analyzing data on a week to week basis, it was possible to determine that the drop in adherence typically occurs at weeks 9-11, and that subsequently over the next 3 months was relatively stable. This decline in adherence occurred despite the patients being volunteers for a clinical trial for which wearing CGM was a study requirement.
An important finding was the clear relationship between adherence and sensor function. While it is intuitive that sensor inaccuracy will affect adherence, this is the first study that has quantified this, where for every 1% decline in MARD over any given week, the patient’s adherence declined by 0.35%. We acknowledge that the effect size is small, and significant advances in sensor accuracy have occurred since this trial was conducted but the results suggest that technological improvements will be associated with increased usage and presumably improved outcomes. While some of these results have historical significance only, the undertaking of this study has aided in establishing methodologies that can be applied in the future on data from contemporary sensors and studies. We found that individual weekly MARD can vary significantly, and analysis suggests that up to 8.5% of individual adherence variability may be explained by sensor performance. We acknowledge that the overall MARD at 30.6% is poor compared to reported MARD levels of newer generations of CGM, and that the study used 2 different sensors during the trial which would have affected individual CGM experience.
The only other predictor identified for overall adherence was age, where adolescents were least likely to be consistent users of CGM, and this has been shown by others.8,15 The reasons for lower adherence in adolescents is likely to be multifactorial including increased burden of care, discomfort, increased activities where CGM is not practical, and effort required to adhere to treatment plans. Surprisingly, other patient factors commonly associated with treatment adherence did not predict for CGM adherence, for example, baseline HbA1c and the number of finger prick blood tests entered into the insulin pump. The observation that sensor alarm rate did not predict overall adherence must be interpreted with caution. It is challenging to interpret these data as a patient must be wearing a sensor for it to alarm. Patients frequently expressed that alarms were annoying, but this may have been balanced by the fact the sensors were provided for free, and that the patients were enrolled in a clinical trial where sensor use was expected. Considering these observations, it is possible that there is an individualized threshold for perceived benefit from wearing CGM compared to the burden of using the technology. This balance between perceived benefit and treatment burden is not fixed, given the observed adherence drop at 9 to 11 weeks, and that intermittent CGM holidays can be followed by periods of excellent adherence.
As there are reported benefits on glycemic control when CGM is used more frequently,3,4,16,17 strategies that may boost CGM adherence in future trials and in clinical practice may improve outcomes. As adolescents have the poorest uptake, age-appropriate specifically designed education and resources for this group may be beneficial. It would be useful in future studies for sophisticated analyses of CGM adherence behavior to be employed along with data collection examining qualitative information on barriers to sensor adherence. This will allow for refinement of education and motivational approaches that can improve and sustain CGM adherence.
There are limitations to these data, specifically patient selection (well-controlled and hypo-unaware, which does not reflect the general type 1 diabetes population), and inclusion in a clinical trial that supplied CGM free of charge. Nevertheless, this detailed examination of CGM adherence provides unique and novel data that set the scene for future investigation in this treatment domain. The data showing change in pattern of adherence over 6 month will be informative when designing interventions with sensor technology.
In conclusion, strategies to improve CGM uptake are important as it is a critical component to modern therapeutic options to improve glucose control in patients with type 1 diabetes. Apart from adolescence, classical markers of treatment adherence do not predict CGM adherence. This underlines the complex interaction between treatment adherence, and perceived benefit compared to treatment burden. Detailed analysis of sensor use in both clinical trials and “real-life” settings will help inform the design of strategies to improve CGM adherence. The effect of poor sensor accuracy has historical significance and is of methodological interest. We intend to apply this methodology to ongoing studies using newer-generation, more accurate glucose sensors. Further investigation is required to better define those patients who consistently experience more accurate glucose sensors.
Footnotes
Acknowledgements
The authors acknowledge the study participants’ commitment.
Abbreviations
CGM, continuous glucose monitoring, LGS, low glucose suspend; MARD, mean absolute relative difference.
Declaration of Conflicting Interests
The author(s) declared the following potential conflicts of interest with respect to the research, authorship, and/or publication of this article: MD was supported by the Juvenile Diabetes Research Foundation mentored fellowship and received honoraria for scientific lectures (Medtronic) and travel reimbursement from Novo-Nordisk and the Juvenile Diabetes Research Foundation mentored fellowship. TL was supported by the Juvenile Diabetes Research Foundation postdoctoral fellowship and received travel support from Medtronic. TJ received honoraria for scientific lectures and travel reimbursement from Medtronic, Sanofi-aventis, Eli Lilly, and Novo-Nordisk.
Funding
The author(s) disclosed receipt of the following financial support for the research, authorship, and/or publication of this article: This study was partly funded by the Juvenile Diabetes Research Foundation. Insulin pumps and glucose sensors were provided by Medtronic via an unrestricted grant.