
Abstract
Background:
Factors influencing glycemic variability in type 1 diabetes (T1D) may play a significant role in the refinement of closed loop insulin administration. Phase of menstrual cycle is one such factor that has been inadequately investigated. We propose that unique individual patterns can be constructed and used as parameters of closed loop systems.
Method:
Women with T1D on continuous subcutaneous insulin infusion and continuous glucose monitoring were studied for 3 consecutive menstrual cycles. Ovulation prediction kits and labs were used to confirm phase of menstrual cycle. Glycemic risks were assessed using the low- and high blood glucose indices (LBGI and HBGI). Insulin sensitivity (SI) was estimated using a Kalman filtering method from meal and insulin data. Overall change significance for glycemic risks was assessed by repeated measures ANOVA, with specific phases emphasized using contrasts.
Results:
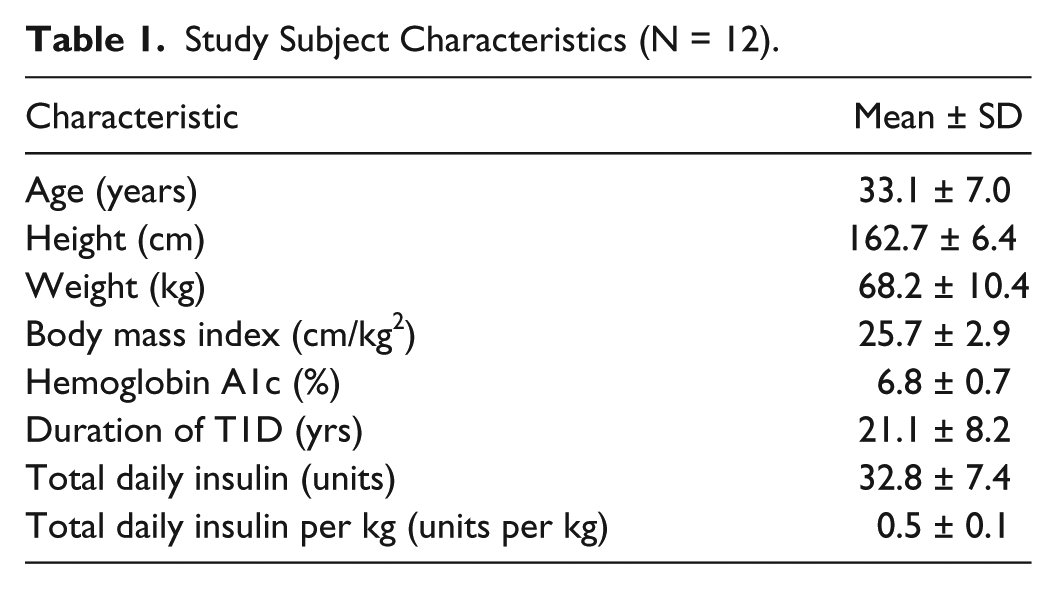
Ovulation was confirmed in 33/36 cycles studied in 12 subjects (age = 33.1 ± 7.0 years, BMI = 25.7 ± 2.9 kg/m2, A1c = 6.8 ± 0.7%). Risk for hyperglycemia changed significantly during the cycle (P = .023), with HBGI increasing until early luteal phase and returning to initial levels thereafter. LBGI was steady in the follicular phase, decreasing thereafter but not significantly. SI was depressed during the luteal phase when compared to the early follicular phase (P ≤ .05). Total daily insulin, carbohydrates, or calories did not show any significant fluctuations.
Conclusions:
Women with T1D have glycemic variability changes that are specific to the individual and are linked to phase of cycle. An increased risk of hyperglycemia was observed during periovulation and early luteal phases compared to the early follicular phase; these changes appear to be associated with decreased insulin sensitivity during the luteal phase.
Keywords
It is well-recognized clinically that insulin requirements change across the menstrual cycle in a subset of patients with type 1 diabetes (T1D). 1 The data however are characterized as anecdotal clinical evidence at best, with no large-scale studies in T1D and limited organized approaches attempting to include this factor in glycemic management. Studies in premenopausal women without diabetes demonstrate a decrease in insulin sensitivity beginning near ovulation and peaking during the second-half (or luteal phase) of the menstrual cycle; estradiol and progesterone levels have been positively associated with measures of insulin sensitivity. 2 Progress toward predictors of this change in insulin sensitivity is limited to small pilot studies in patients with T1D. Small glucose clamp studies have not found a consistent identification of changes in insulin sensitivity in studies of 9-20 women.3,4 Trout et al reported 3 out of 5 subjects with T1D exhibited a decline in insulin sensitivity during the second-half (luteal phase) of the menstrual cycle as measured by intravenous glucose tolerance tests. 5 Two studies in T1D using continuous glucose monitoring (CGM) devices focused on the menstrual cycle reported increased frequency of hyperglycemia in the luteal phase in 4-6 women (2 on pump therapy and 8 on MDI).6,7 The effect of menstrual cycle changes on glycemic control and insulin sensitivity is not consistent among patients and therefore lends itself to individualized management. A useful patient-accessible method for identifying these changes could result in improvement in glycemic control in patients with T1D affected by variability in glucose regulation during the menstrual cycle. This study sought to identify glycemic variability and insulin sensitivity changes using data available in the outpatient setting across menstrual cycle phases.
Methods
Study Design and Subjects
This study recruited 15 premenopausal women with T1D for an outpatient prospective clinical trial (September 2012- August 2013). Inclusion criteria included women ages 18-55 with T1D for at least 2 years with use of an insulin pump for at least 6 months, hemoglobin A1c 5-10% and regular menstrual cycles (approximately every 20-40 days). Exclusion criteria include pregnancy or intending to get pregnant; use of a medication or intervention that significantly alters the menstrual cycle such as oral contraceptives, Depo-Provera, or IUD; acetaminophen during CGM use; prednisone use for more than 10 days during the study; clinical diagnosis of polycystic ovarian syndrome, or elevated testosterone during screening; uncontrolled thyroid disease; or elevation in liver function tests. The study received Institutional Review Board approval, and subjects gave informed consent (NCT01653210).
Study Visits
Subjects participated in a screening visit followed by training on study equipment (CGM). Subjects were followed for 3 consecutive menstrual cycles with 11 follow-up assessments occurring in those time frames (see Figure 1). Each assessment was timed to a specific phase of the menstrual cycle as described below.
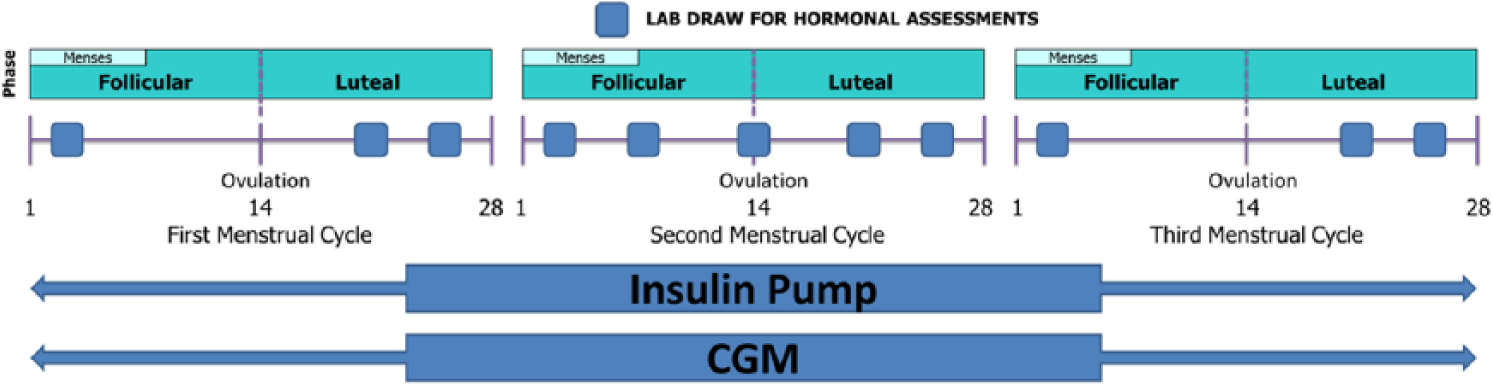
Timing of study assessments and interventions across 3 menstrual cycles.
Insulin and Glucose Assessment
Subjects wore their own personal insulin pump and downloaded the pump data. All subjects wore a study provided continuous glucose monitor (CGM) (DexCom Gen4 Platinum, San Diego, CA) over 3 menstrual cycles. Subjects were asked to perform at least 4 self-monitored blood glucoses (SMBGs) daily using a study provided glucometer (One Touch Ultra 2, LifeScan/Johnson & Johnson, Milpitas, CA). In addition, subjects consumed structured at-home meals for a 24-hour period timed the day after each follow-up assessment and provided food nutrition labels and photographs of meals for verification of dietary intake. Meal selection was done in conjunction with a certified diabetes educator to represent a typical food intake for the subject based on carbohydrate content and size. Subjects performed 7 SMBGs on those days (premeal, 2 hours postmeal, bedtime) as well as anytime on this day when the CGM read below 70. This structured meal day was designed to allow a precise field estimate of insulin action and glucose disposal.
Menstrual Cycle Assessment
Phase of menstrual cycle was determined based on dates of menses, ovulation prediction kits and serum assays of relevant sex steroids. 8 Study assessment times for each cycle were therefore determined individually and were not fixed. As an example, the phases of the menstrual cycle in an idealized 28-day cycle are depicted in Figure 2 beginning with the first day of menstrual flow (day 1) and ending on the day before the next menstrual flow (eg, day 28). The follicular phase is the first-half of the cycle prior to ovulation and varies in length among individuals; the luteal phase follows the luteinizing hormone (LH) peak/ovulation and is more predictable in duration (approximately 14 days) regardless of the total length of the cycle. 9 An ovulation prediction kit (Clearblue Easy, Inverness Medical) was used daily starting at day 6 of each cycle. Subjects were asked to come in within 1 day of having a positive finding for serum assays of sex steroid hormones to validate stage of menstrual cycle. Cycles with Luteal Phase progesterone > 5 ng/mL were considered ovulatory. 10 Phases in this study were defined as follows: early follicular phase = day 1-5; mid-late follicular phase = day 6 until 2 days prior to ovulation; periovulation phase = ovulation ± 1 day; early luteal phase = day 2-4 after ovulation; mid-luteal phase = day 5-9 after ovulation; late luteal phase = day 10 after ovulation until next menstrual cycle.
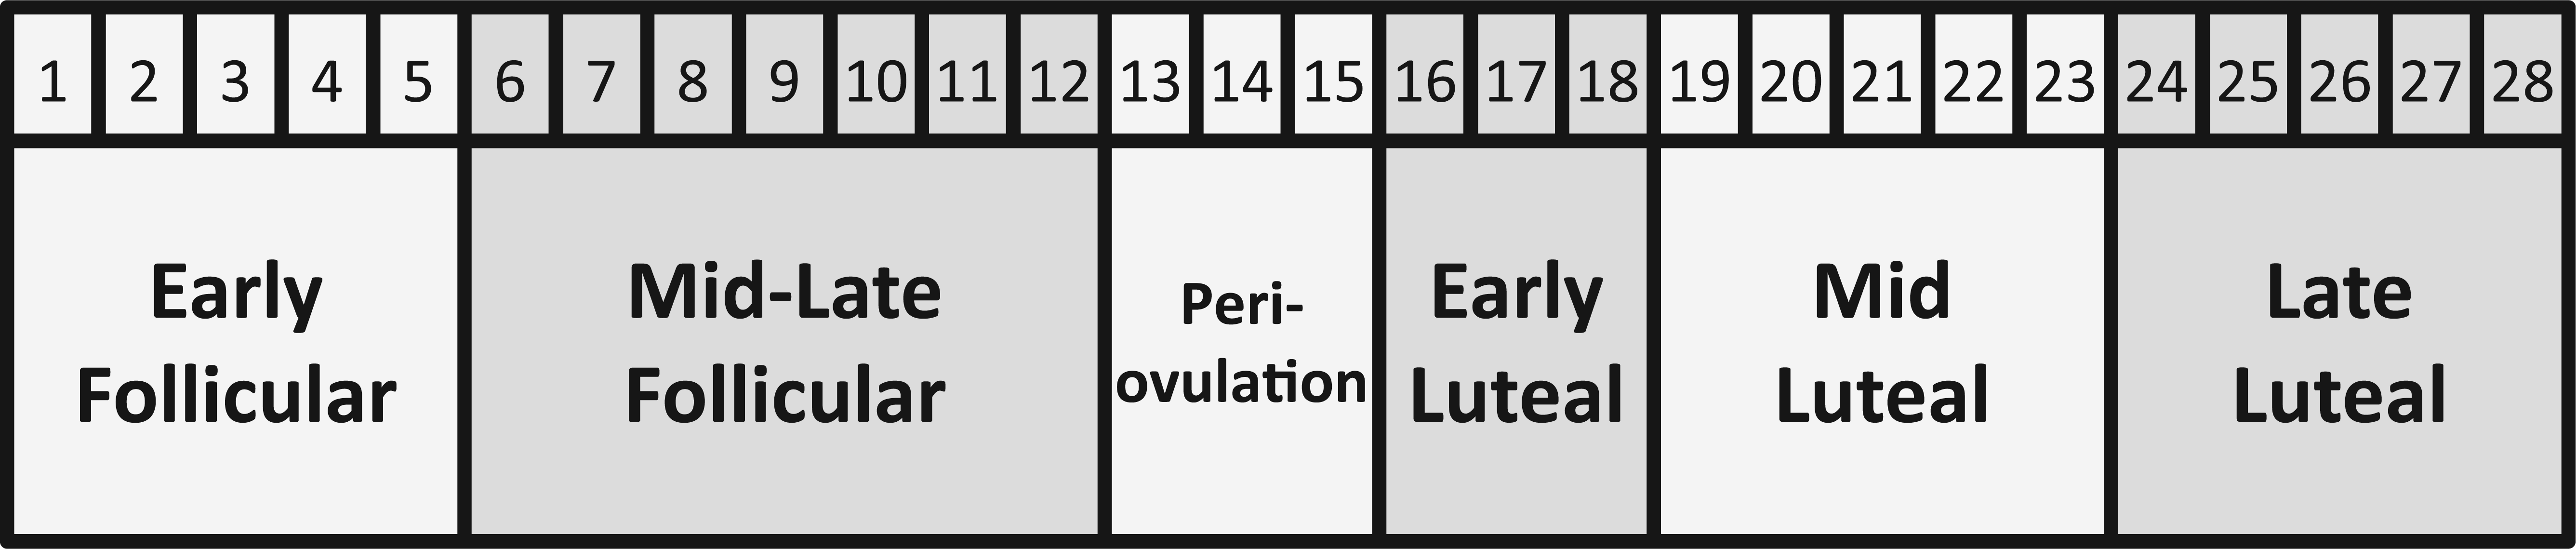
Study cycle phases in an idealized 28-day cycle.
Serum Assays
Screening assays included baseline hemoglobin A1c, complete metabolic profile, pregnancy test, hematocrit and total testosterone. At each follow-up assessment assays included estradiol, progesterone, luteinizing hormone, and follicular stimulating hormone (LabCorp, Burlington NC, Roche ECLIA Methodology).
Statistical Analysis
The primary hypothesis was that a subset of premenopausal women with T1D will experience an increased risk for hyperglycemia as measured by high blood glucose index (HBGI) in the luteal phase compared to the follicular phase. It was further hypothesized that this would be associated with a decrease in insulin sensitivity during the second half of the menstrual cycle (luteal phase). Secondary hypotheses include increased in risk for hypoglycemia during the early follicular phase and increased insulin sensitivity. Glycemic Risks were assessed from CGM data using the low- and high blood glucose indices (LBGI and HBGI) and average daily risk ratio (ADRR).11-13 The significance of the overall change of these measures was assessed by repeated measures ANOVA, specific phases were then emphasized using contrasts.
Insulin Sensitivity Measures
Insulin sensitivity analysis was performed across cycles and was estimated using 2 methods: (1) a novel approach using Kalman filtering (KF) and (2) a previously developed integration method.
14
The first method treated insulin sensitivity (SI) as a dynamic state and Kalman filtering was applied to track SI using CGM, and pump records as inputs. The model embedded in the KF was influenced by the minimal model of glucose kinetics which is at the core of modern SI estimation.
15
Details of the method are provided in the appendix. We used the average of the nocturnal SI estimate (1
The menstrual cycle was divided into phases according to the study protocol. The mean SI of each day was calculated and assigned to the relevant phase. We studied 2 different markers for insulin sensitivity: (1) for the 11 follow-up assessment days, SI was estimated across the entire day and the average nocturnal SI (1
Results
In all, 12 of the 15 recruited completed the study. One subject failed screening (elevated testosterone level), 1 dropped out due to time constraints and 1 was lost to follow-up and did not provide enough data for analysis. Study subject characteristics for completed subjects are provided in Table 1. There were no serious adverse events. One study subject experienced a mild rash at the CGM site. One study subject had a damaged CGM receiver requiring replacement.
Study Subject Characteristics (N = 12).
Hormonal Profiles
A total of 36 menstrual cycles were studied (3 in each of the 12 women). Ovulation was confirmed in 33 out of 36 cycles with luteal phase progesterone > 5 ng/mL. Subjects had regular cycles (28.7 ± 2.6 days) with consistent luteal phase length (15.1 ± 1.7 days). Hormonal profiles followed expected patterns and representative curves are drawn from mean values during the menstrual cycle phase (Table 2 and Figure 3, mean ± SE, units not shown). Total daily insulin as well as total daily carbohydrates or calories did not show any significant fluctuations (Table 2).
Variables by Study Cycle Phase.
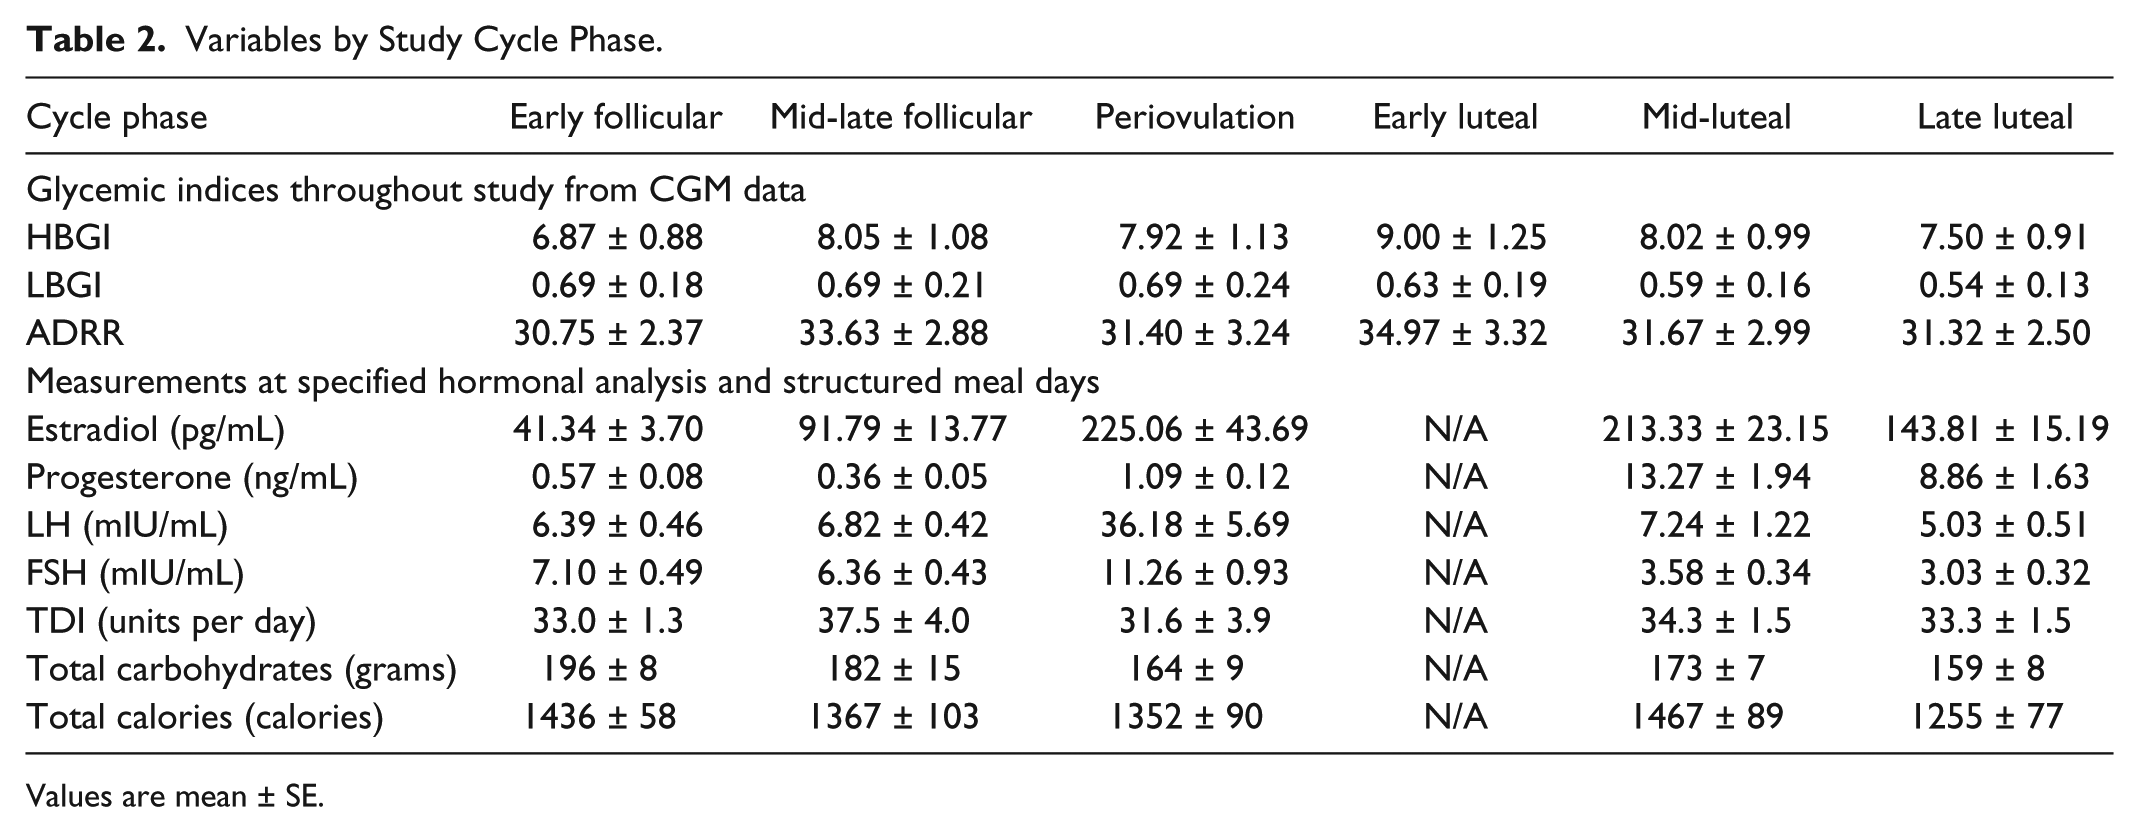
Values are mean ± SE.
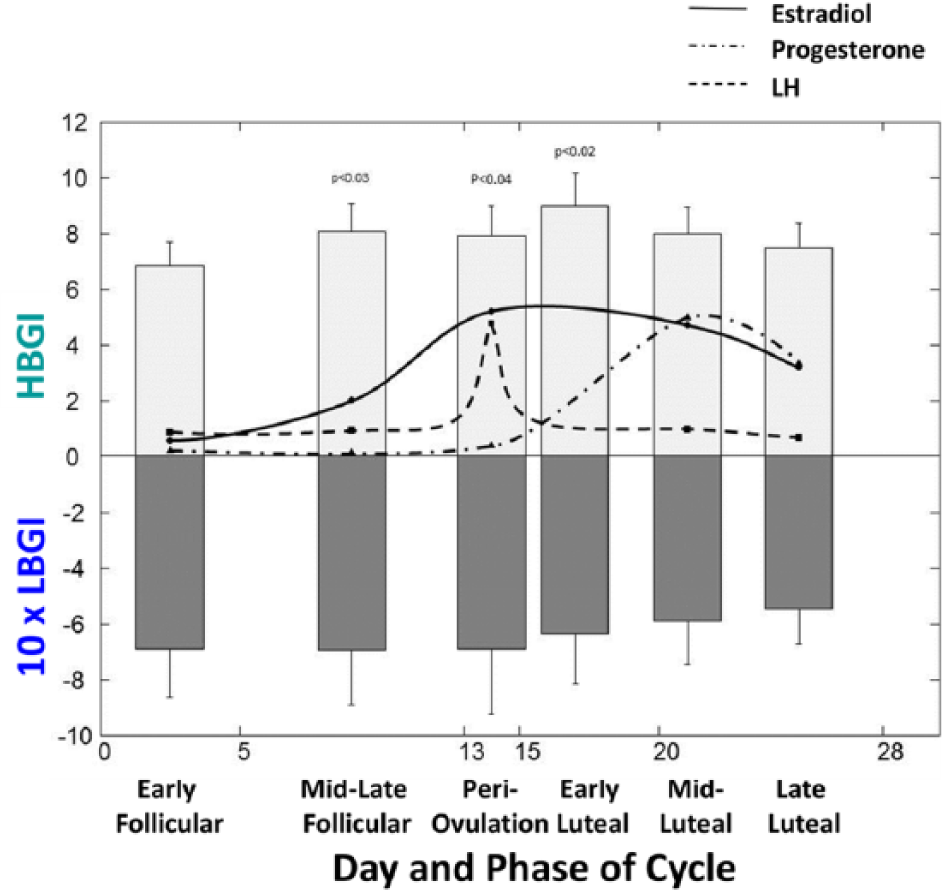
HBGI, LBGI, and hormone profiles by cycle phase. P values are compared to early follicular phase.
Glycemic Risks
HBGI and LBGI were calculated by day and across the menstrual cycle phases (Table 2). Risks for hyperglycemia changed significantly during the cycle (P = .023) with HBGI increasing until early luteal phase and then returning to initial levels (Figure 3, top graph, mean ± SE). Risk for hypoglycemia (LBGI) was steady during the follicular phase and decreasing thereafter but not significantly over the cycle (Figure 3, bottom graph, mean ± SE). ADRR increased significantly after ovulation (P = .02) to slowly return to initial levels during the luteal phase (Table 2).
Insulin Sensitivity
For the follow-up assessment days, the nocturnal SI by KF method in the early follicular phase, the early-mid-luteal phase and the late luteal phase were 4.6 ± 0.5 e-4/min per mU/l, 4.0 ± 0.9 e-4/min per mU/l (P = .05 vs early follicular phase) and 4.0 ± 1.0 e-4/min per mU/l (P = .03 vs early follicular phase) respectively (Figure 4). For comparison, a published methodology was utilized to analyze the SI based on the same data.
6
This method computed SI in the early follicular phase, the early-mid-luteal phase and the late luteal phase were 28 ± 19, 14 ± 7 (P = .03 vs early follicular phase) and 17 ± 9 e-4/min per mU/l (P = .1 vs early follicular phase) respectively. Paired 2-sample t tests showed that SIs from these 2 methods were not significantly different in early follicular phase (P = .08) and early-mid-luteal phase (P = .15) yet significantly different in late luteal phase (P < .01). Analysis of nocturnal SI (1
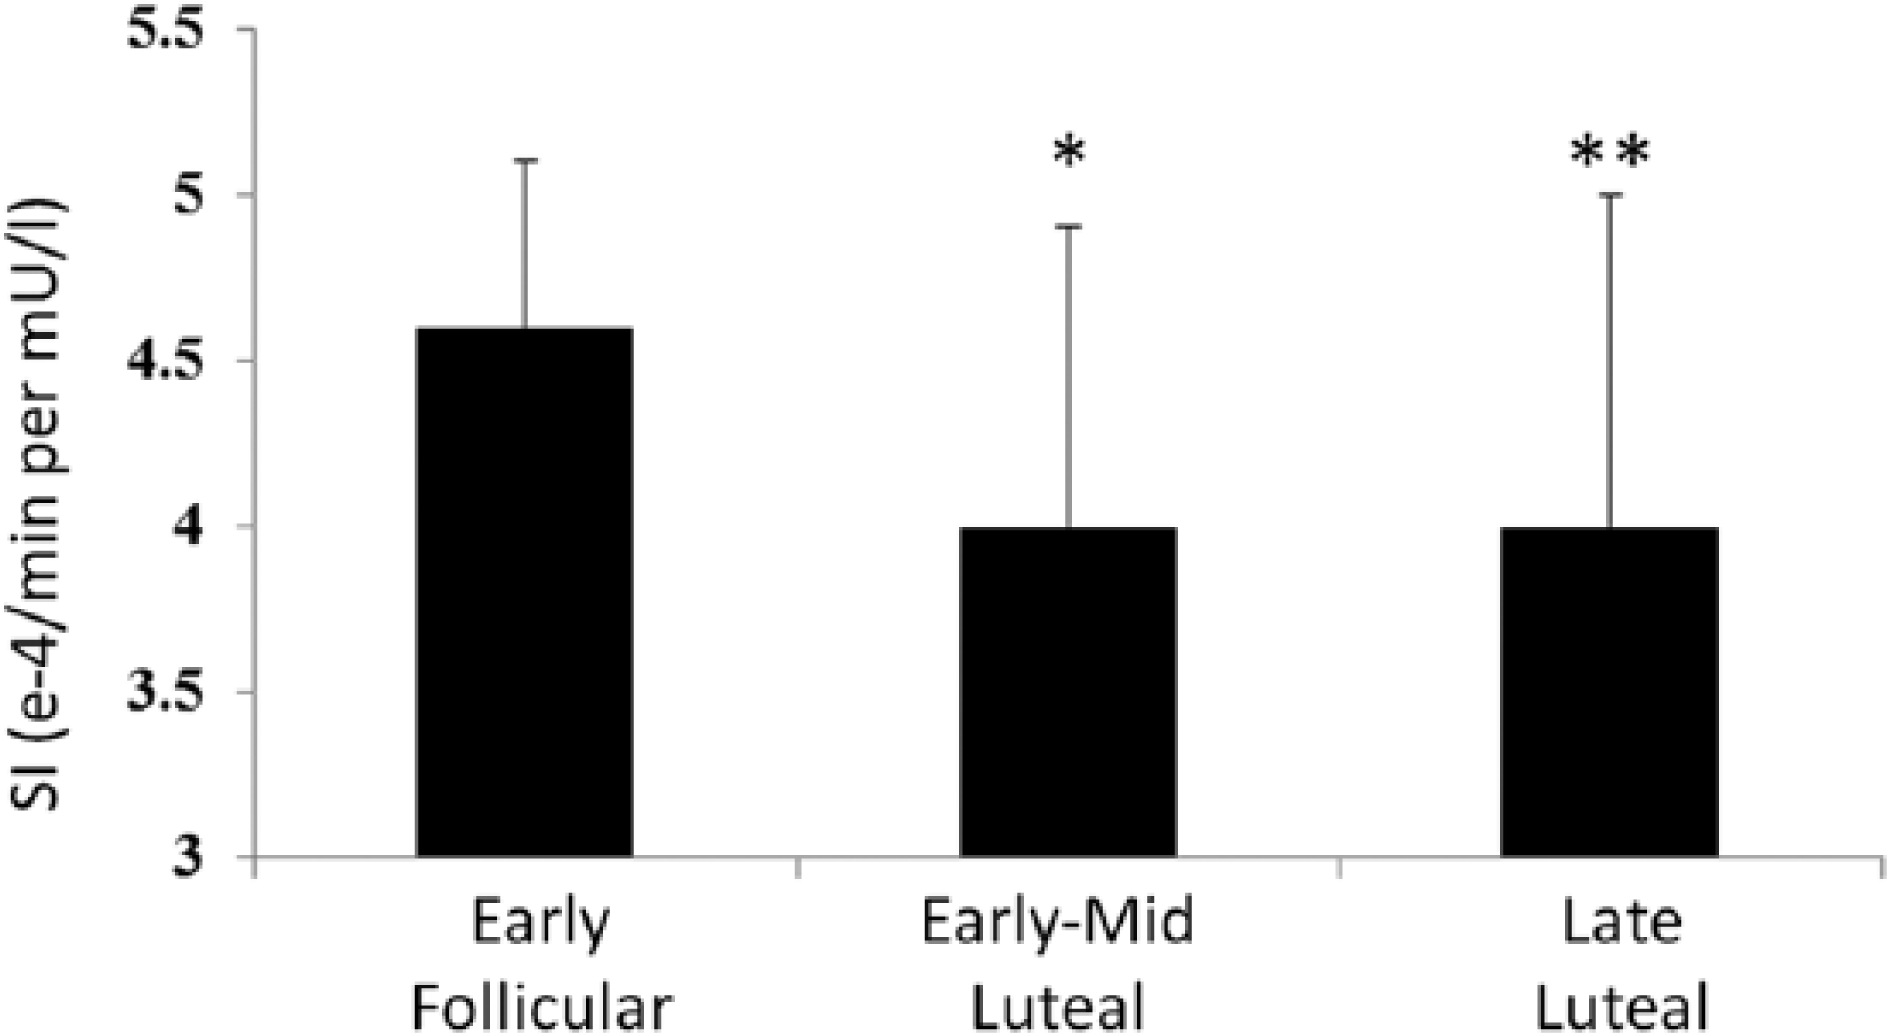
Nocturnal SI estimation by KF method (mean ± SD) by menstrual cycle phase.
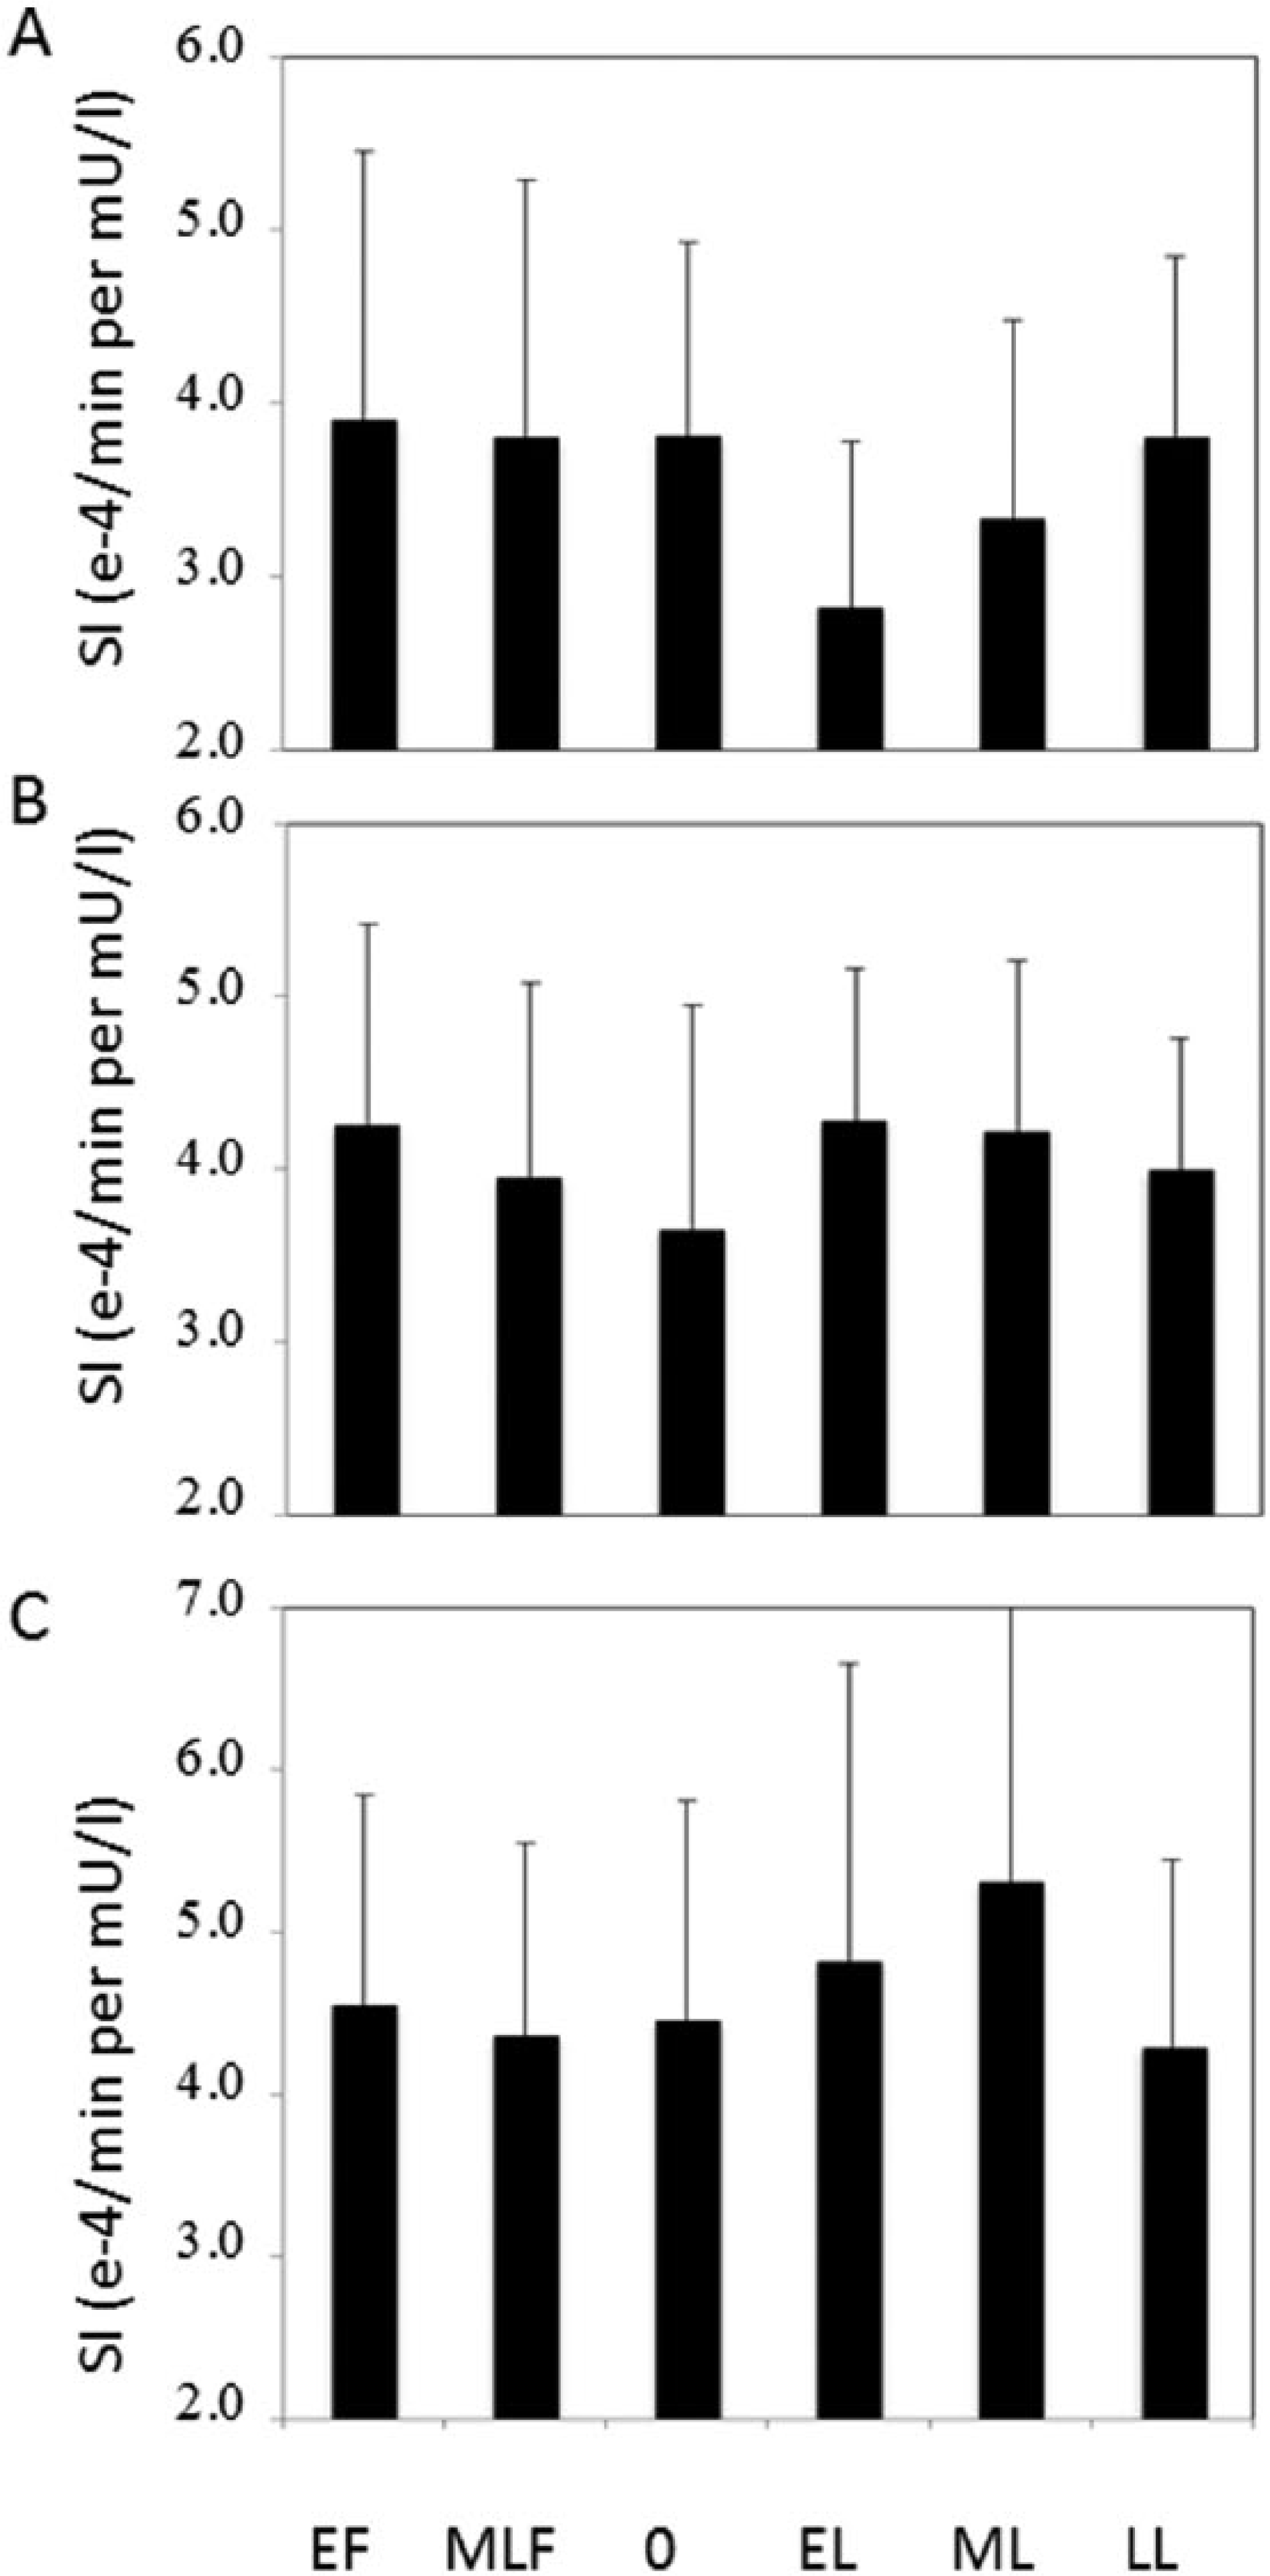
The 3 patterns of SI variations by menstrual cycle phase: (A) 15 out of 36 cycles experienced decreased SI (>5%) in luteal phase; (B) 13 out of 36 cycles experienced unchanged SI (<5%); (C) 8 out of 36 cycles experienced increased SI (>5%). EF, early follicular; MLF, mid-late follicular; O, periovulation; EL, early luteal; ML, mid-luteal; LL, late luteal.
Discussion
This pilot study demonstrated significant differences in risks of hyperglycemia in the ovulatory and early luteal phases in a small group of premenopausal women with T1D when studied across 3 menstrual cycles. The increased risk for hyperglycemia in the late luteal phase was accompanied by lower insulin sensitivity in the early to mid and late luteal phase when compared to the early follicular phase.
This study represents one of the few studies to incorporate continuous glucose monitors with state-of-the art accuracy across 3 menstrual cycles in T1D. Our study utilized a novel approach to measurement of insulin sensitivity that uses data readily available in an outpatient setting such as CGM, meal and insulin administration. This method demonstrated a significant decrease in insulin sensitivity during the luteal phase. Similar results were obtained when using a recently published method for assessing insulin sensitivity from CGM data showing consistent results with the exception of the late luteal phase that differed between the 2 methods. It is worth noting that the method proposed in this manuscript computed nocturnal SI while Schiavon’s method computed SI associated with meals (in the daytime).
The reasons for these changes in hyperglycemia and insulin sensitivity are not clear. It is possible that rising estradiol levels that precede ovulation may result in hyperglycemia. In addition, declining estradiol levels just prior to the start of the next menstrual cycle may contribute to hypoglycemia although this was not significant in this small group of subjects.
The luteal phase or second half of the menstrual cycle has been associated with increased caloric and/or carbohydrate intake, potentially driven by higher progesterone levels. 16 This has the potential to increase the tendency toward hyperglycemia. Our data do not indicate a significant difference in caloric and carbohydrate intake when assessed across the cycle at the time points specified.
It is notable that these findings of changes in HBGI and insulin sensitivity across the menstrual cycle were evident in a group that is largely well controlled. It is unknown whether these changes are more magnified or lessened at higher glucose averages.
One of the hypotheses of this study was that these changes in glycemic variability would be present in a subset of women. Prior to the study, 10 out of the 12 subjects at the time of screening reported an awareness of increased tendency toward hyperglycemia in the latter half of their cycle with 3 subjects noticing low glucoses at the time of menses. Our findings demonstrate 3 patterns of SI variation during the luteal phase when analyzing individual cycles: 42% of cycles with decreased SI, 36% increased SI and 22% with unchanged SI when compared to the early follicular phase. When analyzing individual subjects across 3 cycles, many subjects (9 out of 12) had a consistent change in at least 2 of the cycles whereas 3 out of 12 had different patterns across the cycle. This may be an explanation behind inconsistent findings across prior studies.
This study was limited in size with a small sampling of subjects with T1D who were well controlled on average (mean 6.8% with range of 5.4-7.8%). These results may therefore not be applicable in a larger more varied group with less well controlled glucose.
This information can better inform decision making regarding glycemic management and may be particularly useful to enable long-term use of closed loop control systems in cycling women. The magnitude of the impact on changes in glycemic risks across a menstrual cycle is not clear and given these findings reported here is worthy of further study when considering a nonglucose input into closed loop systems. In addition, application of the developed SI tracking techniques could be further studied to improve perimenstrual cycle glycemic control.
Conclusions
The identified glycemic risks and SI patterns can be used to predict the glycemic risk correlated to the menstrual cycle as a way to inform decision making for glycemic management in T1D women that could be useful in the further application in closed loop control.
Footnotes
Appendix
Acknowledgements
The authors would like to thank the participants in this trial.
Abbreviations
ADRR, average daily risk ratio; ANOVA, analysis of variance; BMI, body mass index; CGM, continuous glucose monitoring; CSII, continuous subcutaneous insulin infusion; FSH, follicular stimulating hormone; HBGI, high blood glucose index; LBGI, low blood glucose index; LH, luteinizing hormone; SD, standard deviation; SI, insulin sensitivity; T1D, type 1 diabetes.
Declaration of Conflicting Interests
The author(s) declared the following potential conflicts of interest with respect to the research, authorship, and/or publication of this article: SAB has received research support from Roche Diagnostics, DexCom, LifeScan, Medtronic, Animas, ConAgra. BJ is an employee of Medtronic. MMM is a consultant/employee for TypeZero Technologies, LLC. MDB has received honoraria/advisory board/consulting from Roche Diagnostics, Bayer, Merck, The Epsilon Group, Becton Dickinson, and Sanofi-Aventis and research support from Animas, DexCom, Insulet, Sanofi-Aventis, Roche Diagnostics, Medtronic, Beckton Dickinson, Bayer, Inspark, Senseonic, and Tandem Diabetes Care. MDB holds patents and patent applications related to the study technology and is a shareholder in TypeZero Technologies, LLC and in Inspark LLC.
Funding
The author(s) disclosed receipt of the following financial support for the research, authorship, and/or publication of this article: research funding from the University of Virginia Launch Pad program, material support in the form of food vouchers from ConAgra and glucometer supplies from LifeScan.