
Abstract
Background:
The relationship between the percent coefficient of variation (%CV) and the risk of severe hypoglycemia (SH) or non-severe hypoglycemia (NSH) in patients with type 1 diabetes (T1D) remains to be elucidated.
Materials and Methods:
The Effect of Intermittent-Scanning Continuous Glucose Monitoring to Glycemic Control Including Hypoglycemia and Quality of Life of Patients with Type 1 Diabetes Mellitus (ISCHIA) study was a crossover, randomized, controlled trial for hypoglycemia prevention in patients with T1D using multiple daily injections (MDIs). Blinded continuous glucose monitoring (CGM) data of 93 patients obtained during the Control period (84 days) were used for the post hoc analysis. The receiver operating characteristics (ROC) curves were analyzed to determine the discrimination thresholds of %CV corresponding to the low blood glucose index (LBGI) > 5 and LBGI ≥ 2.5, and the occurrence of SH.
Results:
The %CV corresponding to LBGI > 5 and LBGI ≥ 2.5 was 42.2% and 37.0%, respectively. The episodes of SH were observed in three patients, and the %CV corresponding to the occurrence of SH was 40.7%.
Conclusions:
The identification of the discrimination threshold of %CV associated with the risk of SH or NSH in patients with T1D is needed.
Introduction
Hypoglycemia, especially severe hypoglycemia (SH), requiring treatment assistance from another person, is a significant problem in insulin therapy for patients with type 1 diabetes (T1D).1 -3 In general, less variability in the blood glucose levels is considered to be associated with a decreased risk of hypoglycemia, whereas the greater variability is considered to be associated with an increased risk of hypoglycemia.
The percent coefficient of variation (%CV) is one of the indicators representing the degree of variability of the glucose levels measured by continuous glucose monitoring (CGM). The %CV is calculated by dividing the standard deviation of glucose levels by mean glucose levels. A discrimination threshold of 36% has been used for %CV. 4 The %CV < 36% corresponds to a relatively stable glucose profile, whereas the %CV of ≥ 36% or more corresponds to a relatively unstable glucose profile. However, these discrimination thresholds were determined mainly based on CGM data in patients with type 2 diabetes with stable glucose profiles. In brief, patients with type 2 diabetes were divided into four groups based on their treatment. Group 1: diet and/or insulin sensitizer alone; Group 2a: dipeptidyl peptidase 4 inhibitors; Group 2b: sulfonyl urea; Group 3: insulin. Patients with type 1 diabetes were included in Group 4. The discrimination threshold of 36% came from the upper limit of %CV in Group 1. This study did not investigate the relationship between the occurrence of SH and %CV. A case–control study comparing T1D patients with or without the history of SH reported that %CV calculated from the blinded CGM data was significantly higher in patients with the history of SH (46.4% vs. 41.9%, P = .008). 5 Another observational study that analyzed the risk factors of SH reported that CV of blood glucose level ≥ 36% was associated with the history of SH requiring medical treatment. 6 The post hoc analysis of the Technological Advances in Glucose Management in Older Adults (TANGO) study reported that, compared to the older T1D adults with low CV(≤36%), those with high CV (>36%) had significantly greater time below range (TBR), however, there was no significant difference in the occurrence of SH. 7 Another study reported that there was no significant difference in the hospitalization for hypoglycemia between individuals with T1D who had low CV (≤36%) and those who had high CV (>36%). 8
The relationship between %CV and indices for hypoglycemia risk, such as low blood glucose index (LBGI), remains to be elucidated. LBGI had been reported that high LBGI > 5 was associated with increased occurrence of SH. 9
In order to determine the discrimination thresholds of %CV corresponding to the LBGI > 5, LBGI ≥ 2.5, and the occurrence of SH, respectively, we used the blinded CGM data of T1D patients collected during the Control period of The Effect of Intermittent-Scanning Continuous Glucose Monitoring to Glycemic Control Including Hypoglycemia and Quality of Life of Patients with Type 1 Diabetes Mellitus (ISCHIA) study as post hoc analysis.10,11
Materials and Methods
Study Design
The ISCHIA study was a randomized, crossover trial that proved the use of intermittent-scanning continuous glucose monitoring (isCGM) combined with structured education decreased TBR in patients with T1D.10,11 During the Intervention period, the study participants used FreeStyle Libre (Abbott Diabetes Care, Alameda, CA, USA) isCGM after structured education, whereas during the Control period, they used self-monitoring of blood glucose (SMBG), and the glucose excursion was monitored by FreeStyle Libre Pro (Abbott Diabetes Care, Alameda, California) blinded CGM. This post hoc study used CGM data obtained during the Control period in order to exclude the effects of isCGM on hypoglycemia prevention. Receiver operating characteristics (ROC) curves were analyzed to determine the discrimination thresholds of %CV corresponding to the LBGI > 5, LBGI ≥ 2.5, and the occurrence of SH, respectively.
Setting
The ISCHIA study was conducted in an outpatient setting in Japan. The list of the location of the study sites and relevant dates were previously reported. 10
Participants
The characteristics of the 104 participants were previously reported. 11 The inclusion criteria were adults aged between 20 and 74 years; have been diagnosed with T1D based on the criteria of Japan Diabetes Society (JDS) for 5 years or longer; 12 have a baseline glycated hemoglobin (HbA1c) value of 8.5% or lower, which was measured at each institute following the standardized method determined by JDS; 13 have been managing their T1D with at least three daily insulin injections and performing SMBG at least three times per day within 30 days prior to providing their informed consent; provide written informed consent before enrollment. Participants could withdraw the informed consent at any time. The exclusion criteria were pregnancy or planning pregnancy within 1 year after providing their informed consent; end-stage renal failure (under hemodialysis or after kidney transplantation); blindness; using an embedded medical device (cardiac pacemaker device, etc); using insulin pump therapy; using premixed insulin; any episode of SH within the previous 1 year prior to the provision of informed consent; using oral hypoglycemic agents to manage their T1D within the previous 1 year prior to the provision of informed consent; unable to participate due to other factors, based on the opinion of the treating clinician at trial entry.
Variables
In this post hoc study, %CV, LBGI, and occurrence of SH were analyzed. LBGI was computed by using the method described in the original publication. 9 In brief, the following equations were used to calculate LBGI: Transformed BG = 1.509 * {(log [BG])1.084 − 5.381}, if blood glucose levels were in milligrams per deciliter: If Transformed BG is <0, Rsik (BG) = 10 * (Transformed BG), 2 otherwise Risk (BG) = 0: Finally, LBGI was calculated as the mean of these risk values across all readings of the glucose levels.
Data Sources
The dataset of 93 adults who completed the ISCHIA study was used as the data source of this study. 11
Bias
Being a post hoc study, data dredging bias may exist.
Study Size
The study size was optimized to the primary endpoint of the ISCHIA study.
Statistical Analysis
For continuous variables, one-way analysis of variance (ANOVA) followed by Tukey’s multiple comparison test was used for three-group comparison. For categorical variables, Fisher’s exact test was used to compare proportions. To analyze the trend of variables across three arms, the Jonckheere-Terpstra trend test was used for the continuous variables, and the Cochran-Armitage trend test for the proportions.
Optimal discrimination thresholds (i.e., cut-off points), sensitivity, and specificity for predicting >0.5 or ≥2.5 of LBGI and SH were determined from ROC curves. The area under the curve (AUC) > 0.9 was considered as excellent, 0.8 to 0.9 as very good, 0.7 to 0.8 as good, 0.6 to 0.7 as sufficient, 0.5 to 0.6 as bad, and lower than 0.5 as test not useful.
P-values of <.05 were considered to indicate statistical significance. Data are expressed as the mean (standard deviation [SD]) or percentage. All statistical analyses were conducted using R version 4.0.3 (R Project for Statistical Computing, Vienna, Austria).
Results
Data derived from 93 participants were used. Their detailed baseline characteristics were reported elsewhere. 11
Figure 1a and b shows the discrimination threshold of %CV corresponding to LBGI > 5 and that of %CV corresponding to LBGI ≥ 2.5, respectively. Episodes of SH were observed in three patients. The discrimination threshold of %CV corresponding to the occurrence of SH is presented in Figure 1c.
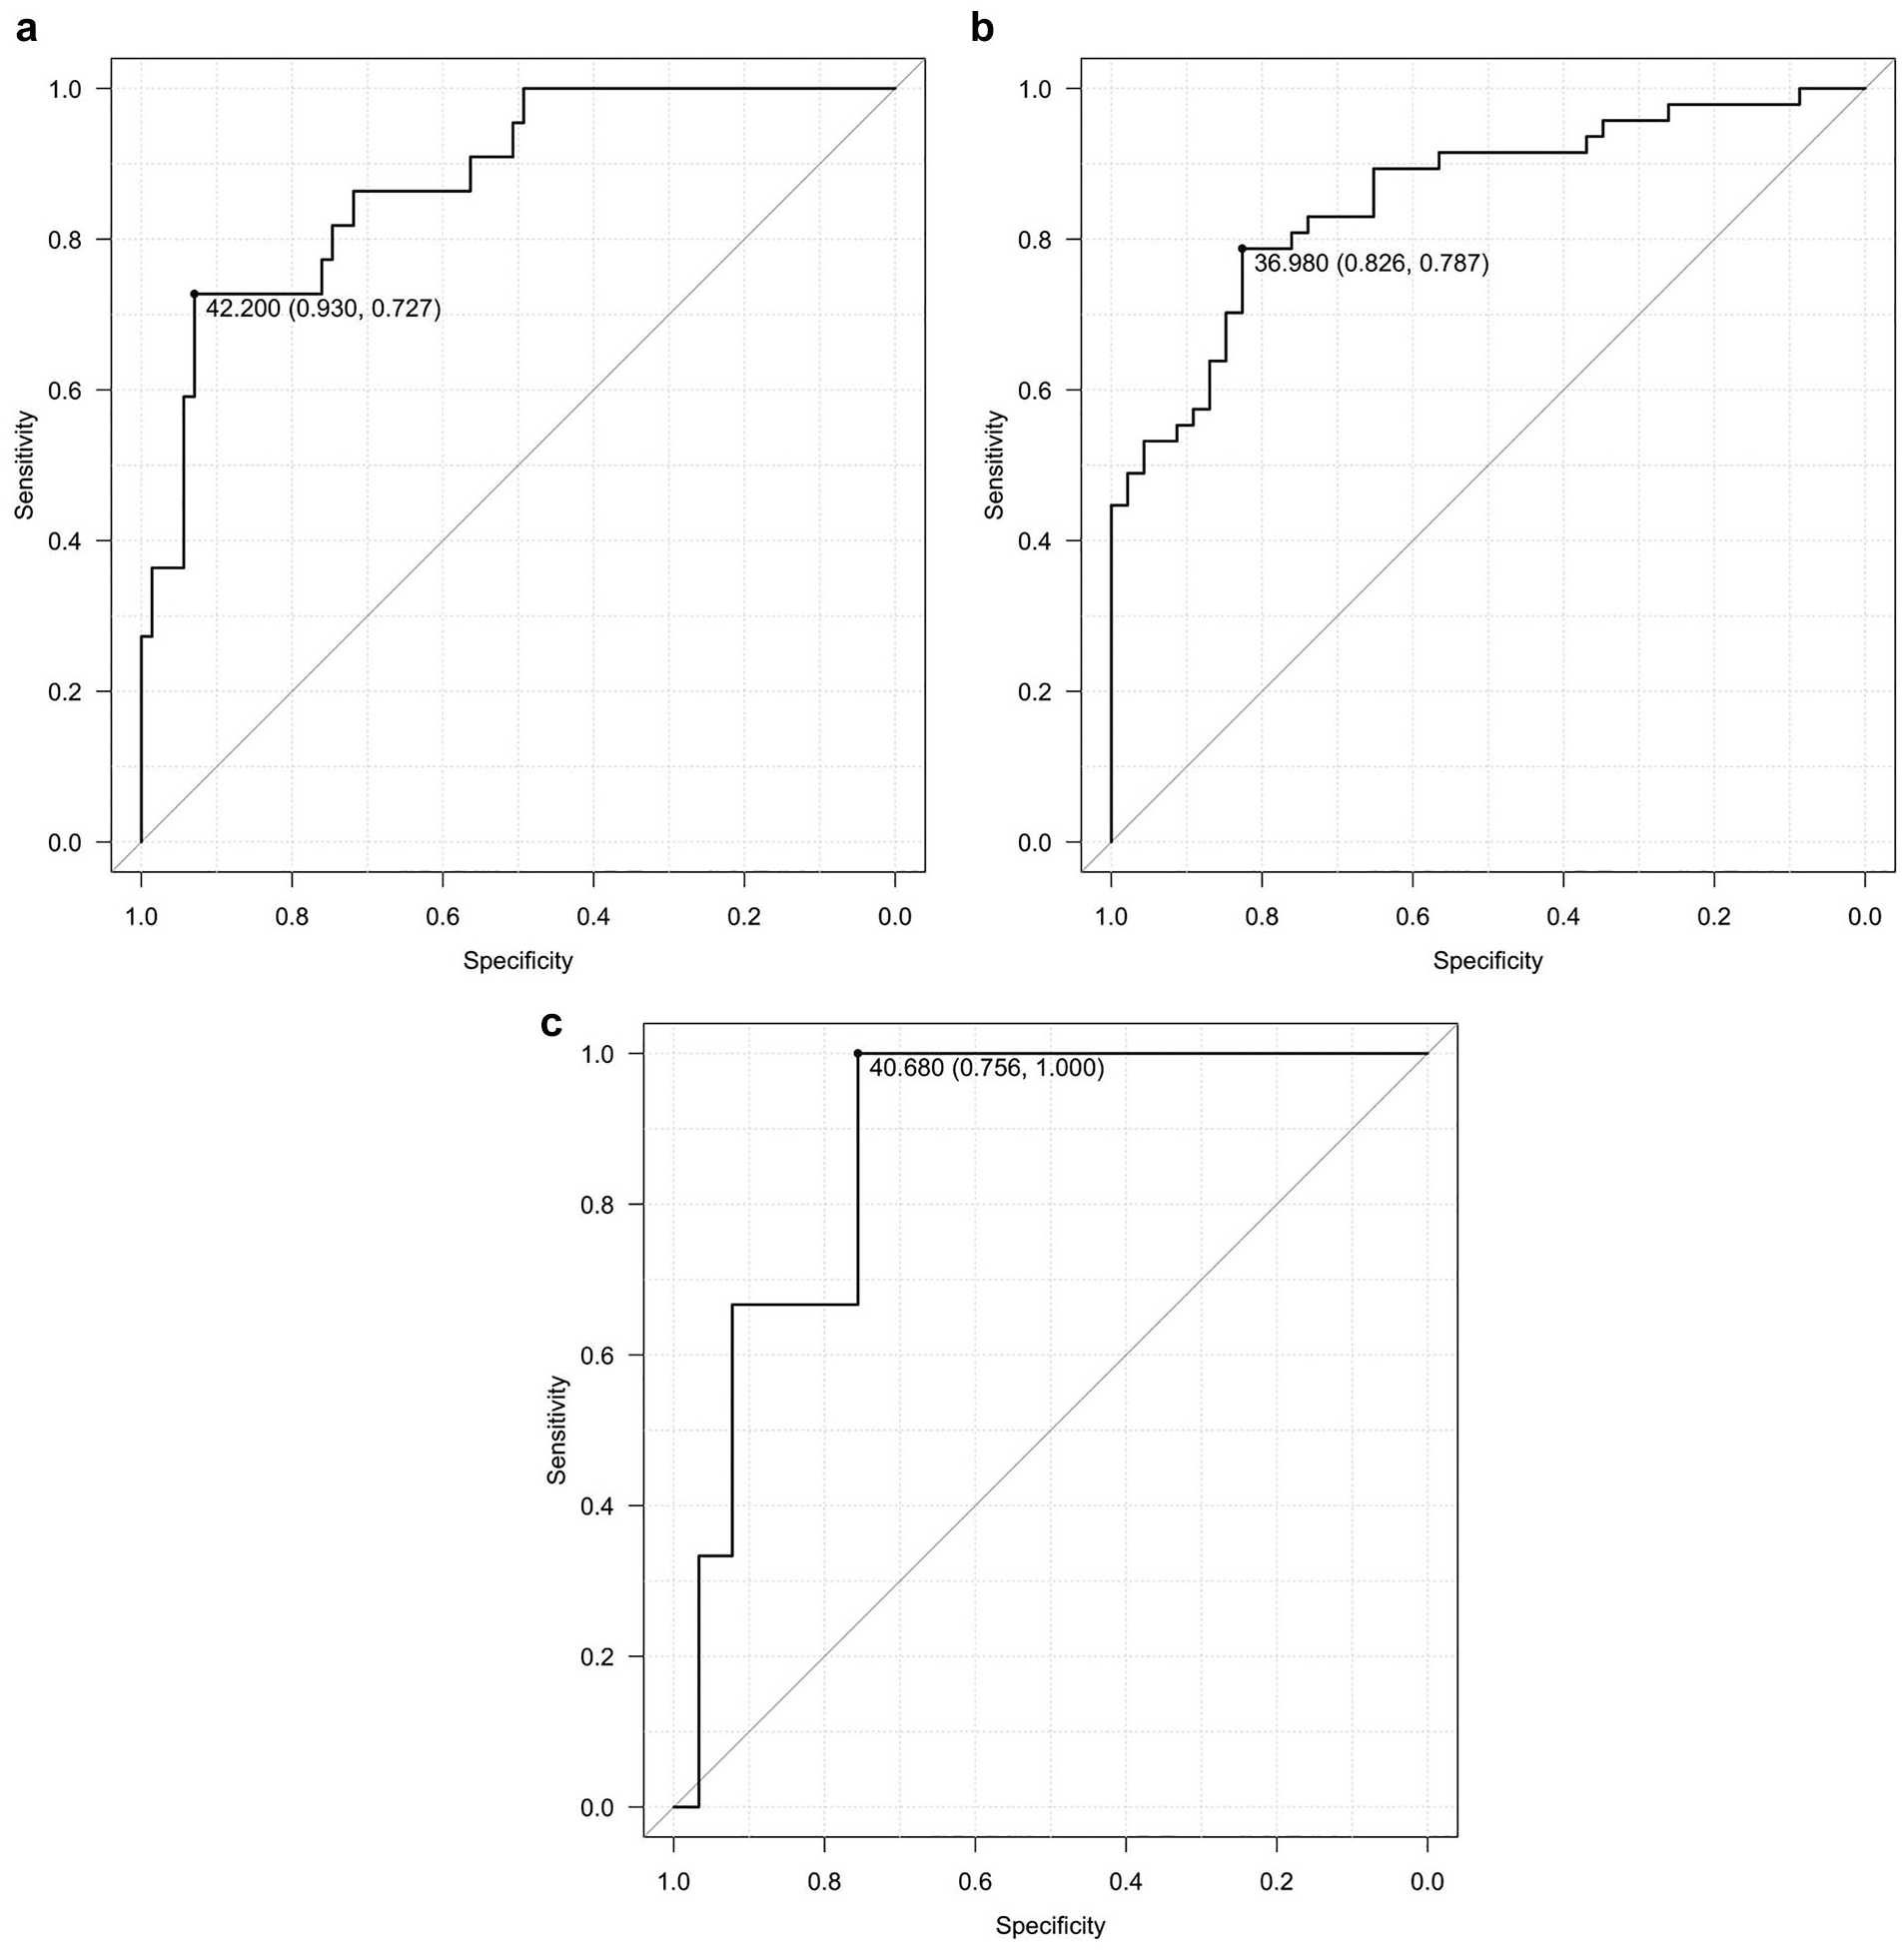
The ROC curves to determine the discrimination thresholds of LBGI > 5 and LBGI ≥ 2.5 and the occurrence of SH.
The average %CV of overall participants was 37.7 ± 5.7%. The lower tertile (n = 31, tertile 1), the middle tertile (n = 31, tertile 2), and the upper tertile (n = 31, tertile 3) of %CV corresponded to 31.8 ± 2.6% (range: 24.8–35.4), 37.1 ± 1.3% (range: 35.4–39.6), and 44.1 ± 3.4% (range: 39.7–50.6), respectively. There were no differences in the glycated albumin (GA), age, sex, diabetes duration, body mass index (BMI), presence of diabetes neuropathy, in the presence of diabetes retinopathy, in the presence of nephropathy, bolus insulin, basal insulin, and ratio of basal insulin to total daily dose (TDD) among the tertiles; however, there was a trend for significant increase in the TDD (unit/kg/day) across the tertiles (Table 1). There were significant differences in the mean glucose levels, in the glucose management indicator (GMI), in the time above range (TAR), in the time in range (TIR), in the TBR, average daily risk range (ADRR), in LBGI, and in the proportion of LBGI > 5 among the tertiles, and there was a trend for significant decrease in the high blood glucose index (HBGI) across the tertiles (Table 2). Noteworthily, the TBR of tertile 3 was significantly greater than that of tertile 2, and the TBR of tertile 2 was greater than that of tertile 1.
Clinical Characteristics of the Participants
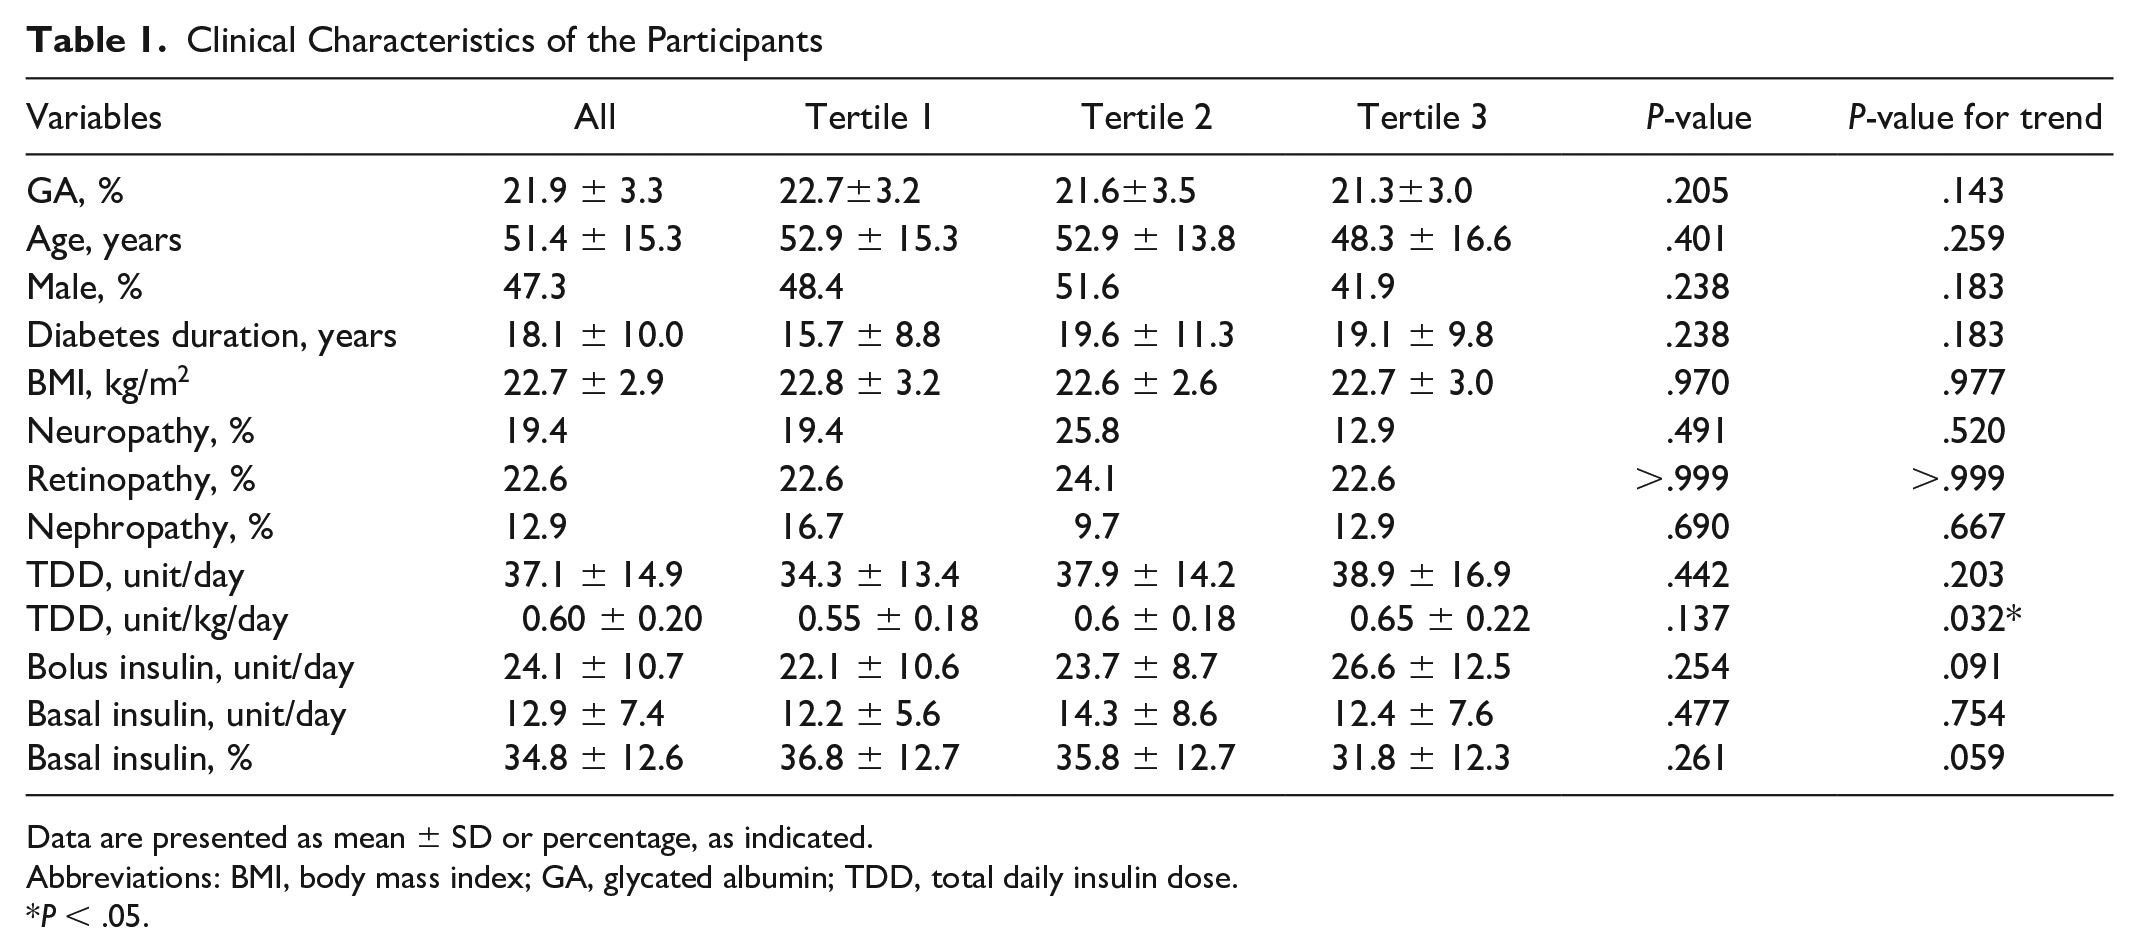
Data are presented as mean ± SD or percentage, as indicated.
Abbreviations: BMI, body mass index; GA, glycated albumin; TDD, total daily insulin dose.
P < .05.
CGM Metrics of the Participants According to the Tertile of CV.
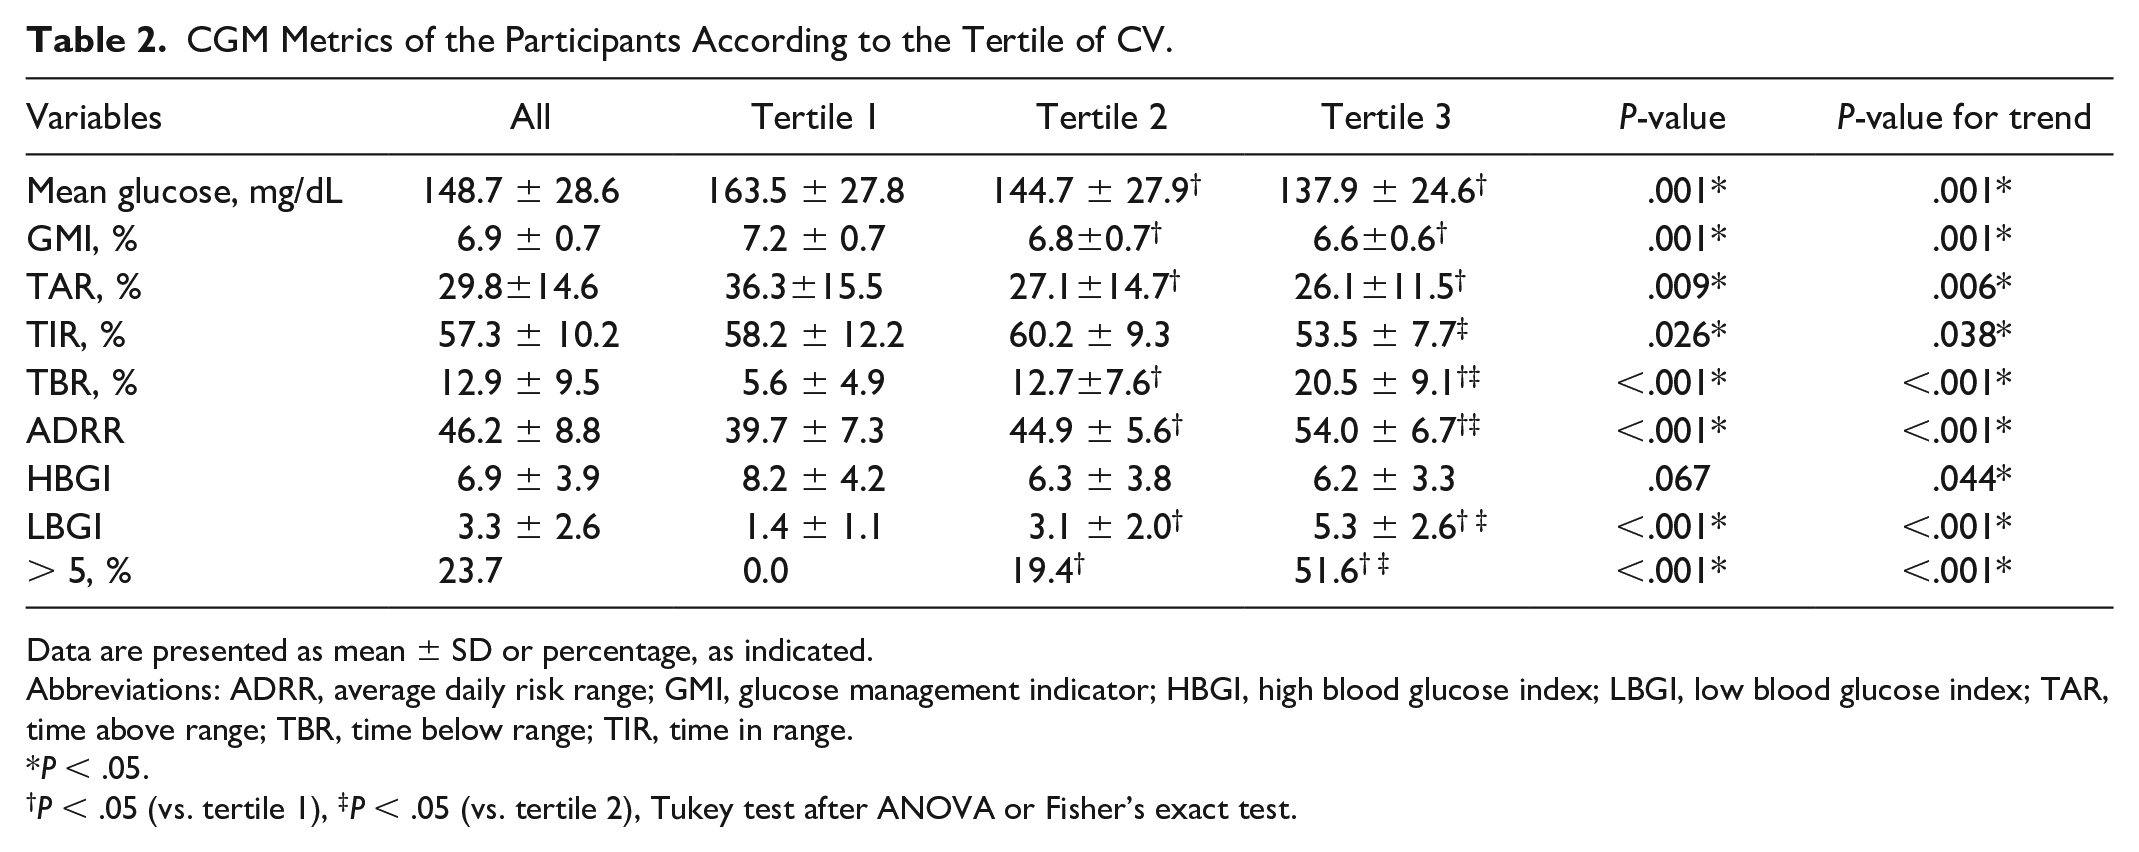
Data are presented as mean ± SD or percentage, as indicated.
Abbreviations: ADRR, average daily risk range; GMI, glucose management indicator; HBGI, high blood glucose index; LBGI, low blood glucose index; TAR, time above range; TBR, time below range; TIR, time in range.
P < .05.
P < .05 (vs. tertile 1), ‡P < .05 (vs. tertile 2), Tukey test after ANOVA or Fisher’s exact test.
Discussion
We conducted the post hoc analysis of the ISCHIA study to investigate the association of %CV with clinical characteristics and CGM metrics. The discrimination threshold of %CV corresponding to LBGI >5 was 42.2%, to LBGI ≥ 2.5 was 37.0%, and to the occurrence of SH was 40.7%. Furthermore, %CV was associated with the mean glucose levels, GMI, TAR, TIR, TBR, ADRR, LBGI and the proportion of LBGI > 5.
The observations reported in this post hoc analysis suggest that the discrimination threshold of %CV corresponding to the risk of SH is about 40% to 42%, which is different from the 36% reported in a previous study. 4 On the other hand, the discrimination threshold of %CV corresponding to LBGI ≥ 2.5 was close to 36%. Thus, the discrimination threshold of %CV corresponding to the risk of NSH in T1D may be around 36%.
Previous studies reported that transient hyperglycemia observed in patients with impaired glucose tolerance (IGT) is associated with an increased risk of macrovascular complications.14,15 Therefore, a high %CV may also be associated with macrovascular complications, although it is not clear at this moment. Further interventional trials or prospective observational studies are required to address this issue.
This study has several limitations that may restrain the generalizability of the hypotheses raised by this post hoc analysis. The ISCHIA study excluded T1D patients with the episode of SH within the previous 1 year prior to the provision of informed consent, 10 and therefore, those who were prone to SH were not included in this study. The number of participants who experienced SH during the observation period was small. The sample size was not optimized for this post hoc study, as it was calculated to test the primary endpoint, the decrease in TBR during the Intervention period. 10 As the ISCHIA study had a short wash-out period of 28 days, HbA1c levels were not measured during Period 2; 10 therefore, GMI was used for the analysis instead. Due to the nature of post hoc analysis, there is a possibility that data dredging bias may exist, although we minimized bias by including all the subjects who completed the study.
The observations from this post hoc study may be generalized to patients with T1D to a certain extent. However, users of insulin pump and/or real-time CGM may have different discrimination thresholds of %CV corresponding to the risk of SH, as the usage of the latest diabetes technology, which is capable of automatic insulin delivery (AID) driven by the sensor glucose levels of CGM is associated with further lower risk of hypoglycemia. 16 To address these issues, prospective observational studies specifically designed to investigate the discrimination threshold of %CV corresponding to the risk of SH or post hoc analyses of previous studies with greater sample sizes may be useful.
Conclusion
Further studies are needed to identify the discrimination threshold of %CV associated with the risk of SH or NSH in patients with T1D.
Footnotes
Appendix
Individuals and institutes that constitute the ISCHIA Study Group are described in the “List of investigators” section.
Acknowledgements
The authors thank Yuki Fushiki and Masayuki Domichi (NHO Kyoto Medical Center, Kyoto, Japan) for supporting the study management. An abstract of this study in Japanese was presented at the 23h annual meeting of the Japanese Study Group of Advanced Diabetes Treatment and Type 1 Diabetes (October 12–13, 2024, Toyama, Japan). English editorial assistance was provided by Medical English Service (Kyoto, Japan).
Abbreviations
ADRR, average daily risk range; AID, automatic insulin delivery; AMED, Agency for Medical Research and Development; ANOVA, analysis of variance; AUC, area under curve; BMI, body mass index; CGM, continuous glucose monitoring; COI, conflicts of interest; GMI, glucose management indicator; HbA1c, glycated hemoglobin; HBGI, high blood glucose index; IGT, impaired glucose tolerance; isCGM, intermittent-scanning continuous glucose monitoring; ISCHIA study, The Effect of Intermittent-Scanning Continuous Glucose Monitoring to Glycemic Control Including Hypoglycemia and Quality of Life of Patients with Type 1 Diabetes Mellitus study; JDS, Japan Diabetes Society; LBGI, low blood glucose index; MDIs, multiple daily injections; NCVC, National Cerebral and Cardiovascular Center; NSH, non-severe hypoglycemia; ROC, receiver operating characteristics; SD, standard deviation; SH, severe hypoglycemia; SMBG, self-monitoring of blood glucose; TANGO study, Technological Advances in Glucose Management in Older Adults study; TAR, time above range; TBR, time below range; TDD, total daily insulin dose; TIR, time in range; T1D, type 1 diabetes; %CV, percent coefficient of variation.
Author Contributions
TM chaired and designed the study, interpreted data, and drafted and revised the manuscript. MM, AK, MT, YH, MO, SS, KK, AT, YM, SM, JM, KN, AS, and KH designed the study, interpreted data, and drafted and revised the manuscript. NS designed the study, conducted statistical analyses, interpreted data, and drafted and revised the manuscript. All the authors approved the final version of the manuscript to be published.
Declaration of Conflicting Interests
The author(s) declared the following potential conflicts of interest with respect to the research, authorship, and/or publication of this article: No potential conflicts of interest (COI) were reported by the ISCHIA Study Group relevant to this article. Potential COI concerning all individual investigators were reviewed by the Certified Review Board in accordance with the Clinical Trials Act. 17 The COI of the members of the writing group are as follows: TM received lecture fees from Dexcom and Abbott and received a research grant from Medtronic. MM received lecture fees from Abbott, Eli Lilly, Novo Nordisk, and Sanofi and received a research grant from Novo Nordisk. AK received a lecture fee from Eli Lilly. MT received lecture fees from MSD, Mitsubishi Tanabe, Eli Lilly, Novo Nordisk, and Sumitomo and received subsidies from LifeScan and Takagi. YH received lecture fees from Abbott, Eli Lilly, Sanofi, Novo Nordisk, Sumitomo and Terumo received research grants from Kyowa Kirin, Medtronic, and Sumitomo and received a scholarship donation from Abbott. MO received lecture fees from Sumitomo, Eli Lilly, Novo Nordisk, Daiichi Sankyo, Ono, Mitsubishi Tanabe, Otsuka, Sanwa Kagaku Kenkyusho, Kowa, Mochida, and received subsidies from LifeScan. AT received lecture fees from Abbott, Eli Lilly, Sanofi, and Terumo. SM received lecture fees from Eli Lilly, Kowa, Sumitomo, and Novo Nordisk. JM received lecture fees from Novo Nordisk and Terumo and received a research grant from Terumo. SS, KK, YM, KN, AS, KH, and NS declare that they have no COI.
Funding
The author(s) disclosed receipt of the following financial support for the research, authorship, and/or publication of this article: This work was supported by the Japan Agency for Medical Research and Development (AMED) (grant numbers: 18ek0210104h0001, 19ek0210104h0002, 20ek0210104h0003) and Japan IDDM Network, Non-Profit Corporation (grant number: not available).