
Abstract
Background:
Nocturnal hypoglycaemia is a burden for people with diabetes, particularly when treated with multiple daily injections (MDI) therapy. However, the characteristics of nocturnal hypoglycaemic events in this patient group are only poorly described in the literature.
Method:
Continuous glucose monitoring (CGM) data from 185 study participants with type 1 diabetes using MDI therapy were collected under everyday conditions for up to 13 weeks. Hypoglycaemic events were identified as episodes of consecutive CGM readings <70 mg/dl or <54 mg/dl for at least 15 minutes. Subsequently, the time <54 mg/dl (TB54), time below range (TBR), time in range (TIR), time above range (TAR), glucose coefficient of variation (CV), and incidence of hypoglycaemic events were calculated for diurnal and nocturnal periods. Furthermore, the effect of nocturnal hypoglycaemic events on glucose levels the following day was assessed.
Results:
The incidence of hypoglycaemic events <70 mg/dl was significantly lower during the night compared to the day, with 0.8 and 3.8 events per week, respectively, while the TBR, TB54, and incidence of events with CGM readings <54 mg/dl was not significantly different. Nocturnal hypoglycaemic events <70 mg/dl were significantly longer (60 vs 35 minutes) and enveloped by less rapidly changing glucose levels. On days following nights containing hypoglycaemic events, there was a decrease in TAR, mean CGM glucose level and morning glucose levels and an increase in TB54, TBR, and CV.
Conclusions:
The results showed that nocturnal hypoglycaemic events are a common occurrence in persons with type 1 diabetes using MDI with significant differences between the characteristics of nocturnal and diurnal events.
Keywords
Introduction
The occurrence of hypoglycaemia is one of the main barriers to achieving good glycemic control in people with type 1 or insulin-treated type 2 diabetes mellitus. In particular nocturnal hypoglycaemia is of concern, as half of severe hypoglycaemic events have been reported to occur during sleep.1,2 Therefore, nocturnal hypoglycaemia imposes not only a substantial physiological, but also a psychological and socio-economic burden on people with diabetes, as discussed in an article by Kulzer et al 3 published in the same special issue as this article. Continuous glucose monitoring (CGM) systems coupled with devices for continuous subcutaneous insulin infusion, first using a low glucose suspend feature,1,4 and more recently, as part of automated insulin delivery systems, 5 have mitigated the problem of nocturnal hypoglycaemia.
However, these insulin pump–based technological solutions are not available to persons with diabetes using multiple daily insulin injection (MDI) therapy, which were estimated to make up approximately 34% of all patients with type 1 diabetes in the United States in 2021, 6 and approximately 65% of adults with type 1 diabetes in Germany in 2022. 7 The combination of MDI and CGM for the treatment of persons with type 1 diabetes has shown to reduce the frequency of overall but also nocturnal hypoglycaemia. 1 However, the studies mainly used early-generation, adjunctive CGM systems,8-10 included specific participant populations, 11 or had short observation periods. 12 Furthermore, the definition of a hypoglycaemic event was inconsistent across studies which impairs the comparability of the findings. As a result, the characteristics of overall, and in particular nocturnal hypoglycaemia in the general population of type 1 diabetes patients using MDI and a modern, non-adjunctive CGM system, observed over several weeks, have not been examined.
The aims of this article are therefore threefold. The first aim is to provide a transparent and well-described definition of hypoglycaemic events, based on the consensus recommendations by Danne et al. 13 The second aim is to determine the extent to which the complication of overall and nocturnal hypoglycaemia persists in persons with type 1 diabetes using CGM and MDI, by characterizing the incidence and time course of hypoglycaemic events with an emphasis on the difference between nocturnal and diurnal events. The third aim is to examine the relationship between the occurrence of nocturnal hypoglycaemic events and glucose levels the following day.
Methodology
Study design and data collection
The data used in this article were collected in a previously unpublished observational, multicentre study. After receiving approval from the responsible ethics committee, the study was conducted between February 2017 and March 2018 in 15 specialized diabetes practices and research centers in Germany. The main purpose of the study was the development and assessment of methods for the prediction of glucose levels. This article thus presents a secondary analysis not within the scope of the original study design.
The main study inclusion criteria were age ≥18 years, diagnosis of type 1 diabetes mellitus for >1 year and treatment via MDI. The main exclusion criteria were pregnancy, severe chronic or acute illness that might interfere with study conductance or results, use of acetaminophen and employment involving shift work, in particular during night.
After study inclusion, baseline characteristics of the participants including HbA1c measurements were documented. The participants were trained in the use of a CGM system (Dexcom G5 Mobile, Dexcom Inc., San Diego, USA), including the performance of calibrations with capillary blood glucose measurements (Accu-Chek® Aviva blood glucose monitoring system, Roche Diabetes Care GmbH, Mannheim, Germany). During the study, the participants used the CGM system under everyday conditions for up to 13 weeks, thereby following their normal daily routine. The CGM system was not blinded and the glucose information displayed on the connected smart device could be used to make therapy decisions.
CGM data processing
Gaps in the CGM data shorter than 30 minutes were imputed using linear interpolation. 14 Individual CGM recordings indicating a rate of change >10 mg/dl/min (0.55 mmol/l/min) in either direction were removed as such rapid changes in prevailing glucose levels are physiologically implausible and are indicative of discontinuities in the signal due to user calibration. CGM readings below the lower measurement limit of 40 mg/dl (2.2 mmol/l) were replaced with a value of 40 mg/dl. For the data of a participant to be included in the analysis, at least 14 days of CGM data with a daily data recovery rate of at least 80% had to be available. 13 A day was defined as the time between 00:00 and 23:59, divided in a nocturnal or nighttime period from 00:00 to 05:59 and a diurnal or daytime period from 06:00 to 23:59. 13 Morning glucose levels were calculated for each day as the mean of CGM readings between 06:00 and 07:59.
Identification of hypoglycaemic events
Based on the consensus statement by Danne et al, 13 and given a CGM system with a 5-minute sampling interval, the start of a hypoglycaemic event was defined as the time point of the first of at least four consecutive CGM readings (≥15 minutes) below the threshold. Correspondingly, the end of a hypoglycaemic event was defined as the time point of the last CGM reading below the threshold, which is followed by at least four consecutive CGM readings (≥15 minutes) at or above the threshold. Therefore, the minimum duration of a hypoglycaemic event is 15 minutes and can contain episodes of up to three consecutive CGM readings above the threshold (Figure 1a-b).
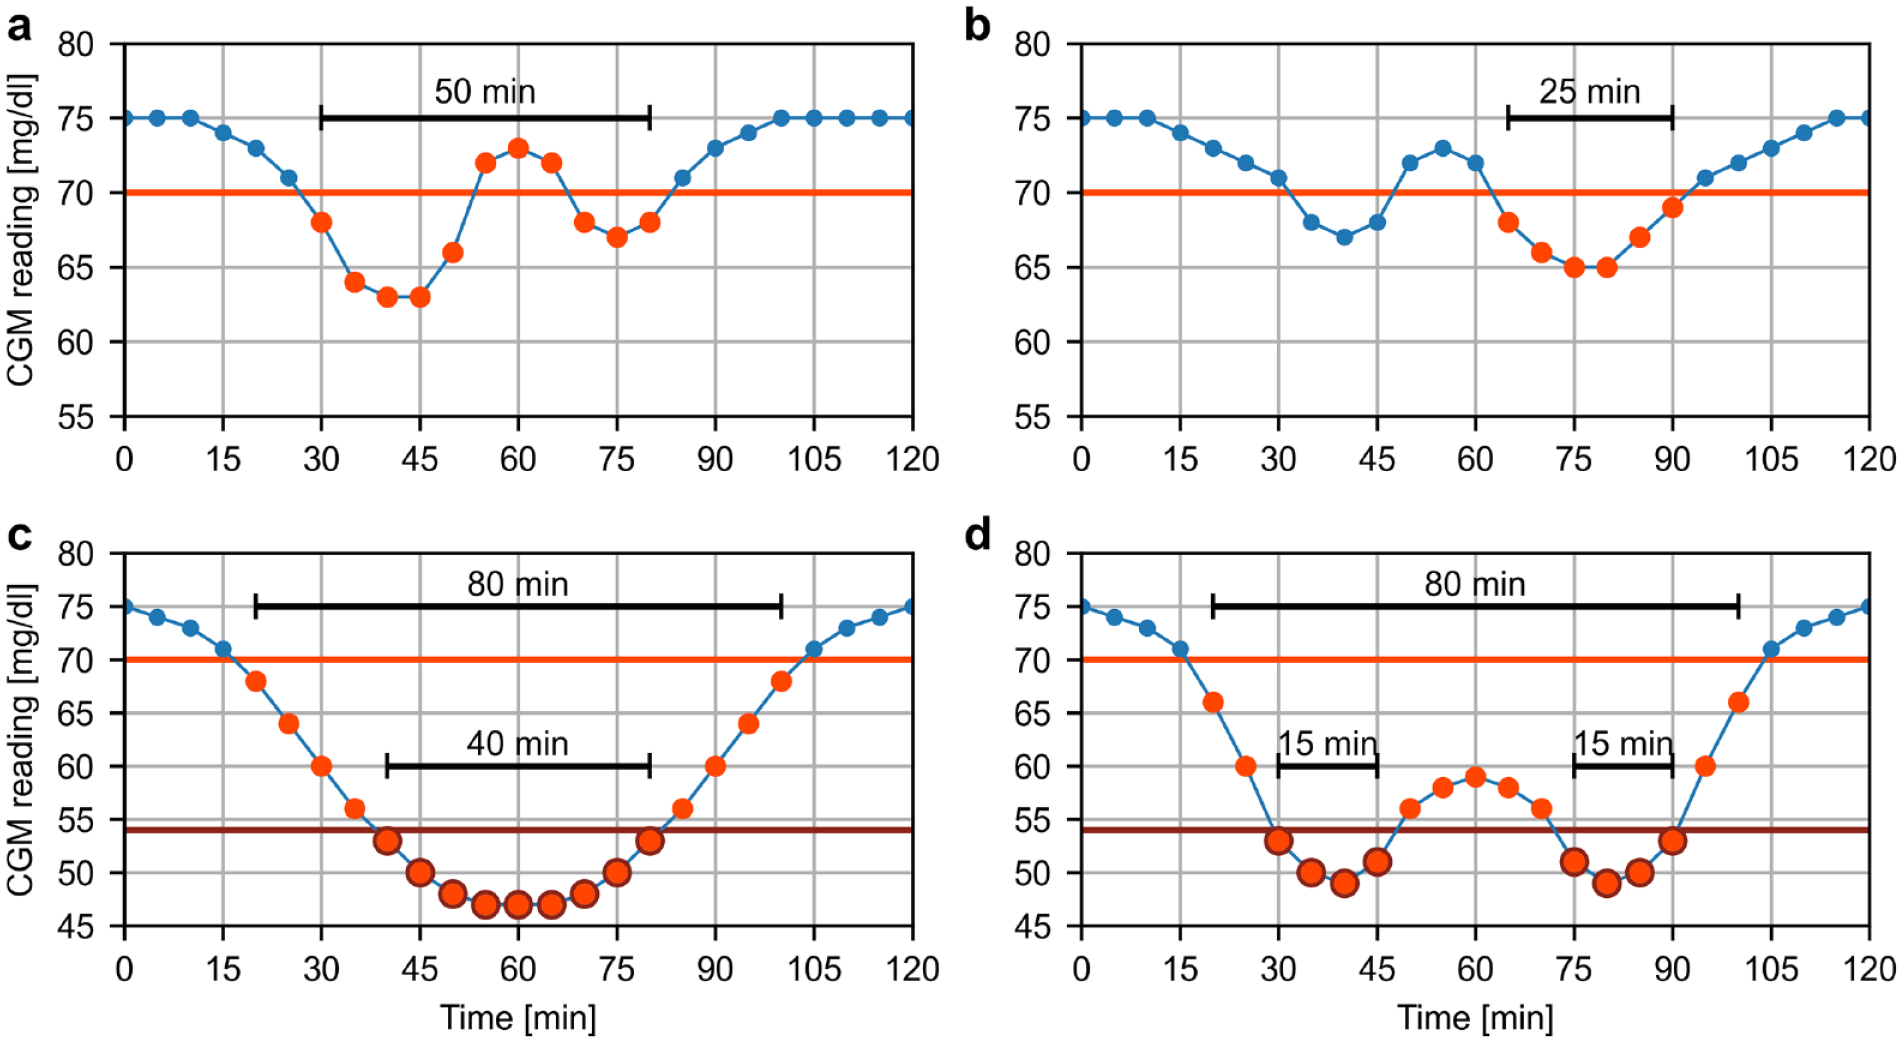
Illustrations of the hypoglycaemic event identification (light red: general event <70 mg/dl; dark red: level 2 event <54 mg/dl) on artificial CGM profiles. Panel a: After identifying the beginning of the event at 30 minutes, the event is extended to the time point at 80 min, as the three consecutive CGM readings ≥70 mg/dl within the event only constitute 10 minutes. Panel b: The beginning of the event is identified at 65 minutes, as the three consecutive CGM readings <70 mg/dl at 35, 40, and 45 minutes do not constitute a beginning. Panel c: The level 2 event is fully enveloped by a general event. Panel d: Two separate level 2 events within the same general event.
In accordance with Danne et al, 13 we chose thresholds of 70 mg/dl (3.9 mmol/l) and 54 mg/dl (3.0 mmol/l) to identify general hypoglycaemic events and level 2 (L2) hypoglycaemic events, respectively. This means that every L2 event is contained within a general event and multiple L2 events can occur within the same general event (Figure 1b-c). Events were assigned to the nocturnal or diurnal time period depending on the time of the start of the events.
Statistical analysis
Time <54 mg/dl (TB54), time below range (TBR), time in range (TIR), and time above range (TAR) were calculated as the percentage of CGM readings <54 mg/dl (3.0 mmol/l), <70 mg/dl (3.9 mmol/l), 70-180 mg/dl (3.9-10.0 mmol/l), and >180 mg/dl (10.0 mmol/l) out of all available CGM readings for each participant separately. Similarly, glycemic variability was assessed using the coefficient of variation (CV) calculated as the ratio between standard deviation and the mean value of the available CGM readings in percent. To compare TB54, TBR, TIR, and TAR between nocturnal and diurnal periods, they were calculated from CGM readings assigned to the corresponding time periods. The participant-specific CVs during the overall, nocturnal and diurnal periods were calculated as the mean of daily CVs, thus reflecting the glycemic variability within days as well as within nocturnal and diurnal periods.
The incidence of hypoglycaemic events was expressed as the number of events per week. While this quantification has a useful clinical interpretation, it prohibits a direct comparison between the incidence during nocturnal and diurnal periods due to the differences in the duration of nighttime (6 hours) and daytime (18 hours). The incidence of hypoglycaemic events was therefore normalized by expressing it as the number of events per 100 hours of night- and daytime, respectively. To further characterize the events, their duration was calculated. In addition, the median time courses of CGM levels before, during, and after hypoglycaemic events, aligned with the time of start and end, were determined.
To assess whether nocturnal hypoglycaemia events were associated with changes in glycaemia during the next day, the following analysis was carried out. First, participants without any nocturnal hypoglycaemic events were excluded. Subsequently, all diurnal periods from a specific participant were categorized into periods with and without at least one hypoglycaemic event the previous night. After that, the diurnal TB54, TBR, TIR, TAR, CV, mean CGM glucose level and morning glucose level across all categorized time periods were calculated for each study participant separately. Finally, the differences between these metrics on days with and without preceding nocturnal hypoglycaemic events were calculated. Here, positive differences indicate an increase in the metric of interest following a night with a hypoglycaemic event, whereas negative differences indicate a decrease.
Throughout the article, numerical results are provided as the median and interquartile range. To assess statistical differences, non-parametric tests in the form of the Wilcoxon signed-rank test for paired data and the Mann-Whitney U rank test for unpaired data with a significance threshold of 0.05 were applied.
Results
Participant population
A total of 209 study participants were enrolled, of which 10 subjects dropped out after enrolment. After data processing and application of the previously described data exclusion criteria, data from 185 participants were included in the analysis. The baseline descriptive characteristics of the participant population are shown in Table 1. In accordance with the inclusion criteria, all participants were diagnosed with type 1 diabetes and treated with MDI using a basal-bolus regimen. For that, most of the participants used analogue insulins. Overall, the analyzed data set consisted of 8905 patient-days (24.4 patient-years) of CGM data.
Baseline Descriptive Characteristics of the Participant Population (n = 185).
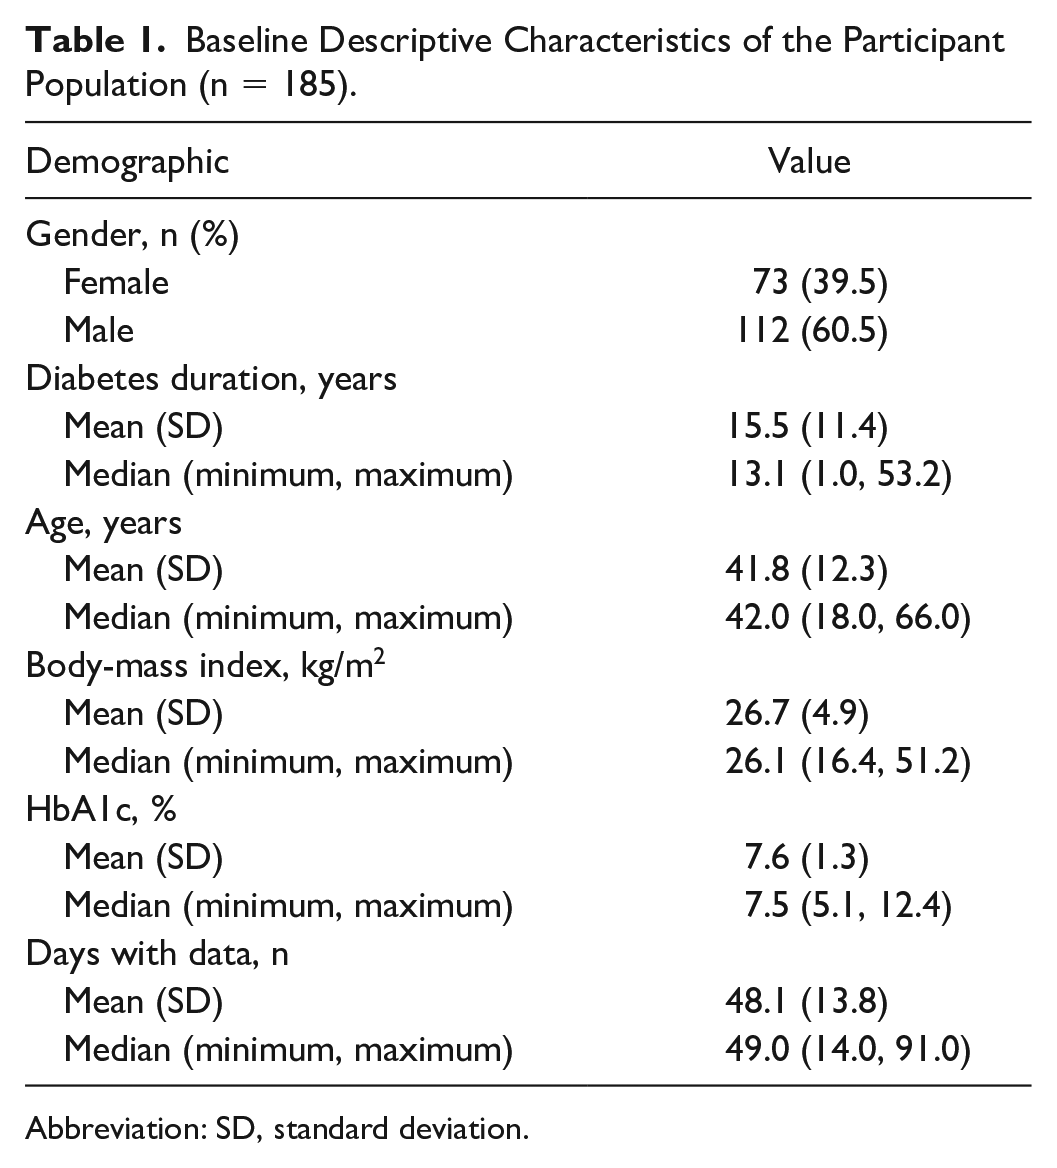
Abbreviation: SD, standard deviation.
Characteristics and effects of hypoglycaemic events
The glycemic control metrics and incidence of hypoglycaemic events during the complete study (overall time period), as well as separated by night- and daytime are shown in Table 2. In total, 97.3% of the participants experienced at least one hypoglycaemic event <70 mg/dl over all time periods, and 90.3% of participants experienced at least one nocturnal hypoglycaemic event. Considering only L2 events, the corresponding percentages are 87.6% for all time periods and 65.9% for nocturnal events only. No severe hypoglycaemic event requiring third-party assistance was observed during the study. The percentages of days with at least one general and L2 event were 46.7% and 16.6%, respectively.
Glycemic Control Metrics and Incidence of Hypoglycaemic Events During the Complete Study (Overall), as Well as Separated by Night- and Daytime.
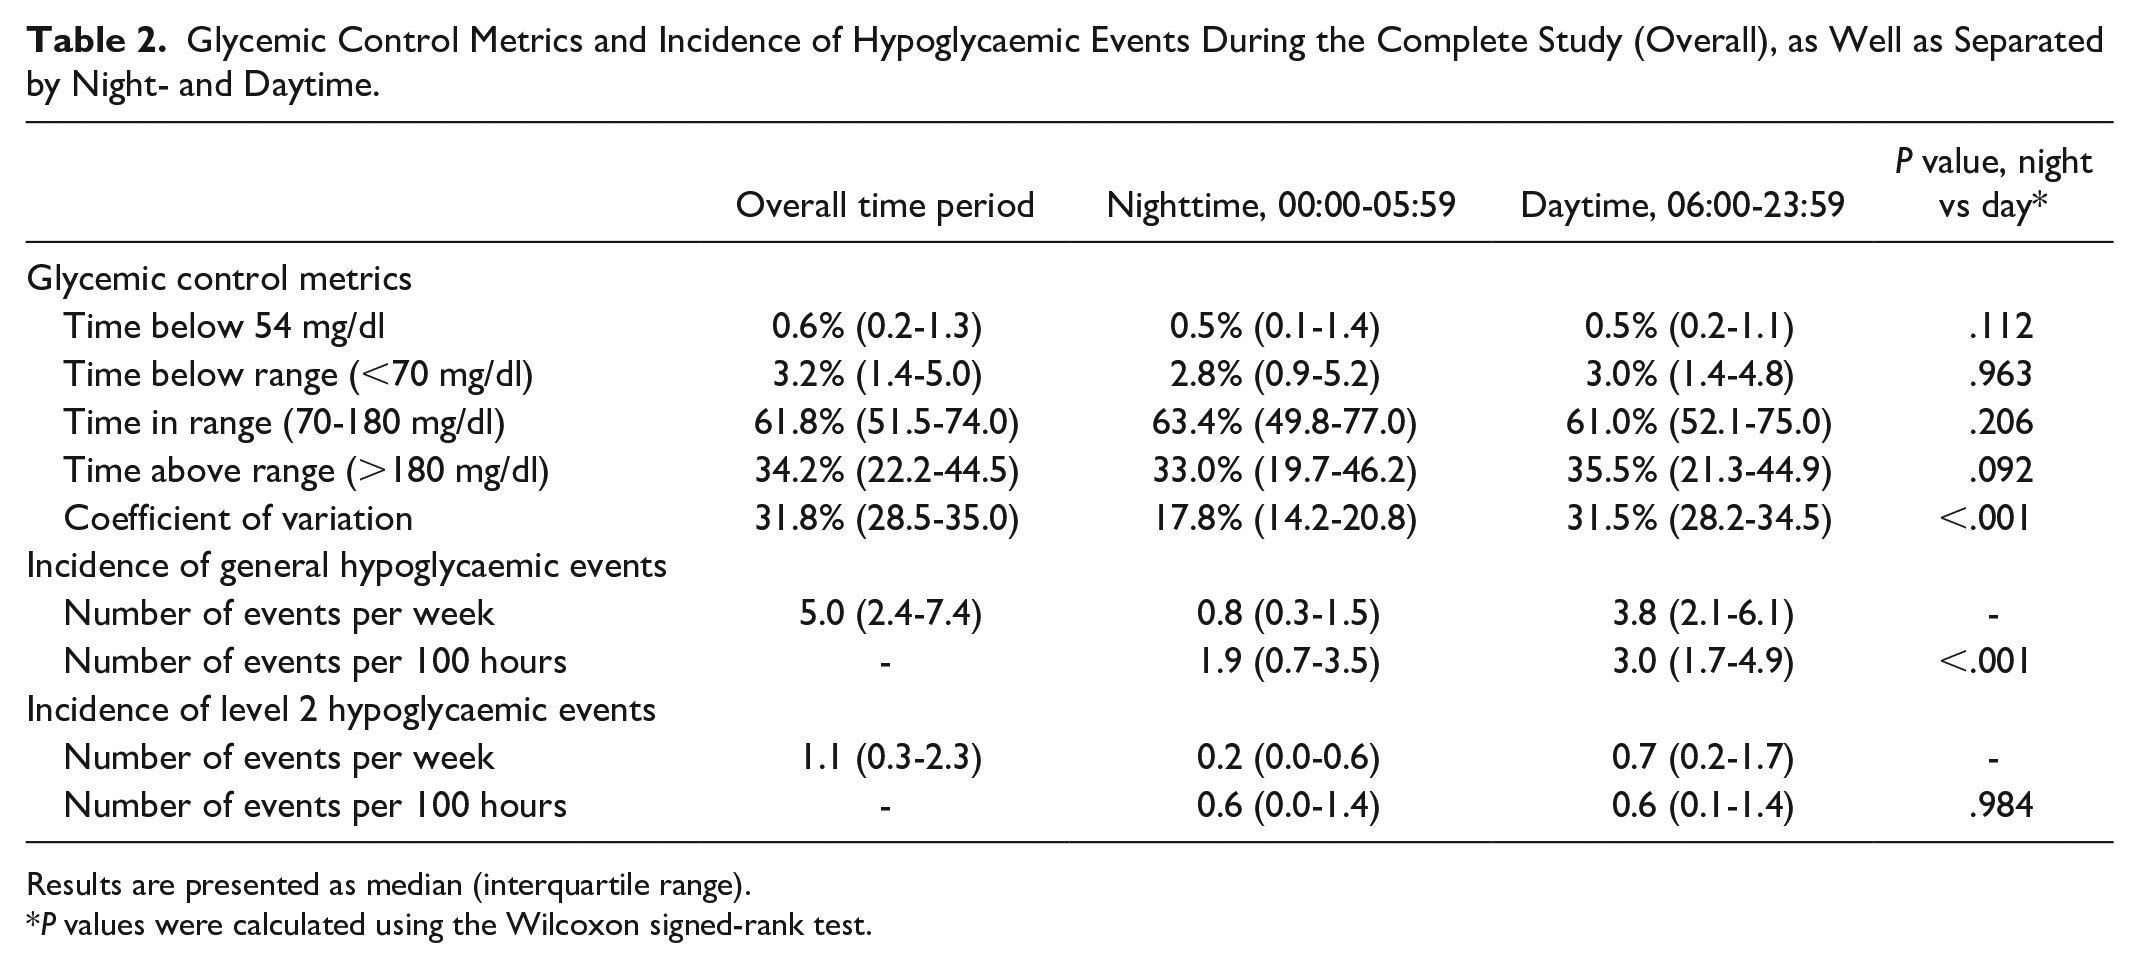
Results are presented as median (interquartile range).
P values were calculated using the Wilcoxon signed-rank test.
The only glycemic control metric that showed a significant difference between day- and nighttime was the CV, with nocturnal CVs being decreased. In particular, TBR showed no significant difference, while the normalized incidence of general nocturnal hypoglycaemic events was lower, which was not the case for L2 events. The hypoglycaemic event incidences for each participant grouped by the corresponding participants’ TIR are shown in Figure 2. More detailed distributions of the hypoglycaemic event start times with respect to the time of day are displayed in Figure 3.
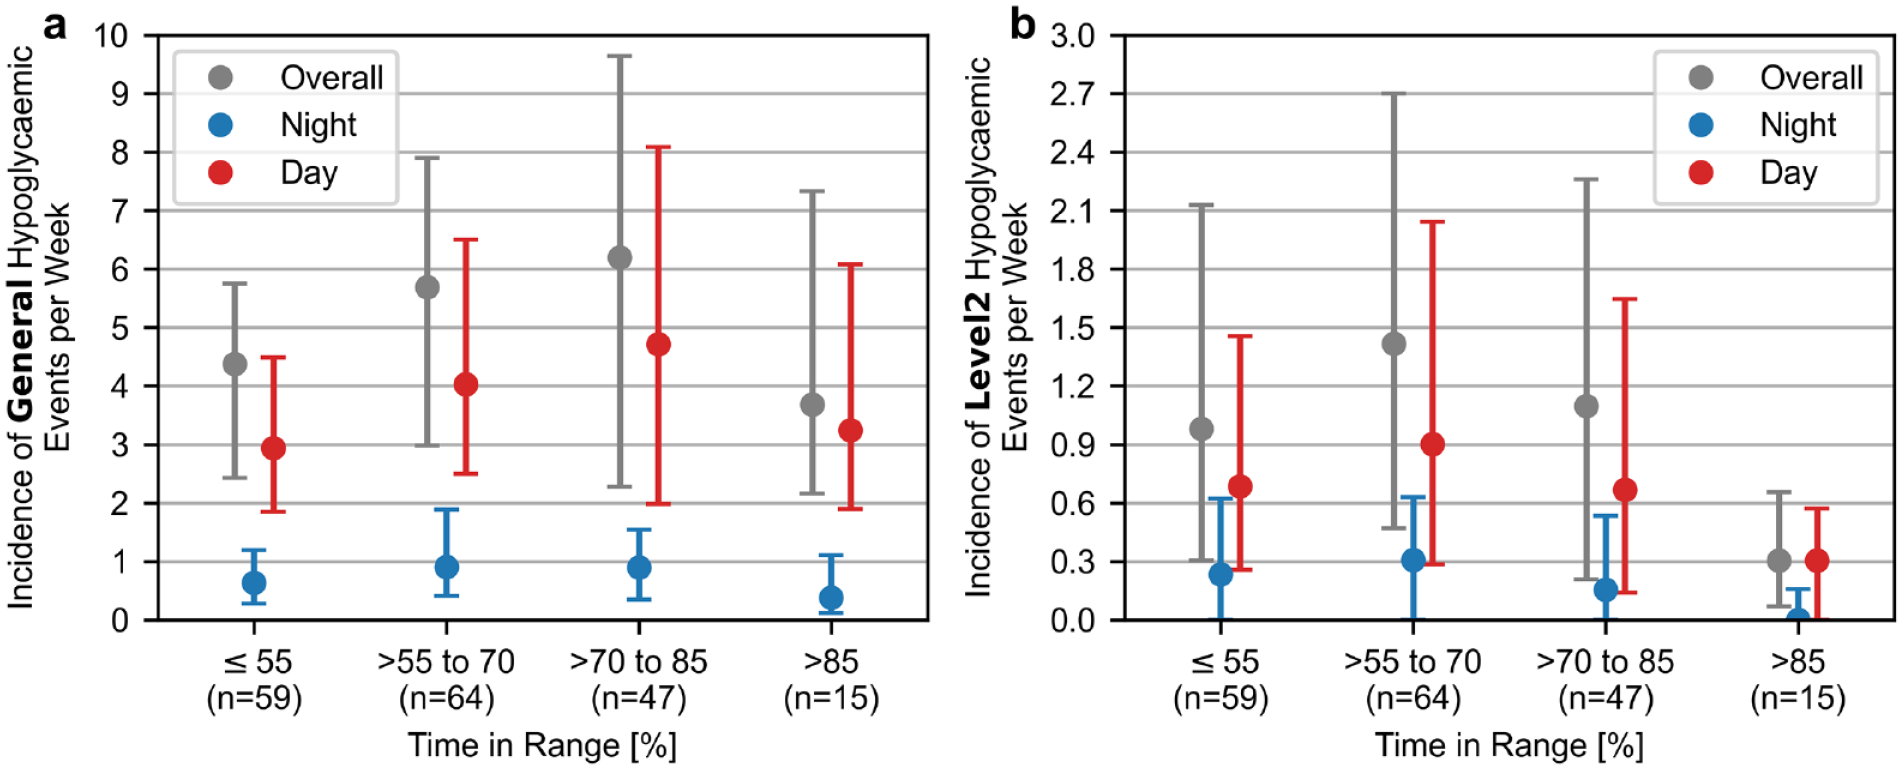
Participant-specific incidences of general (panel a) and level 2 (panel b) hypoglycaemic events grouped by their overall time in range observed during the study. Shown are median and interquartile range.
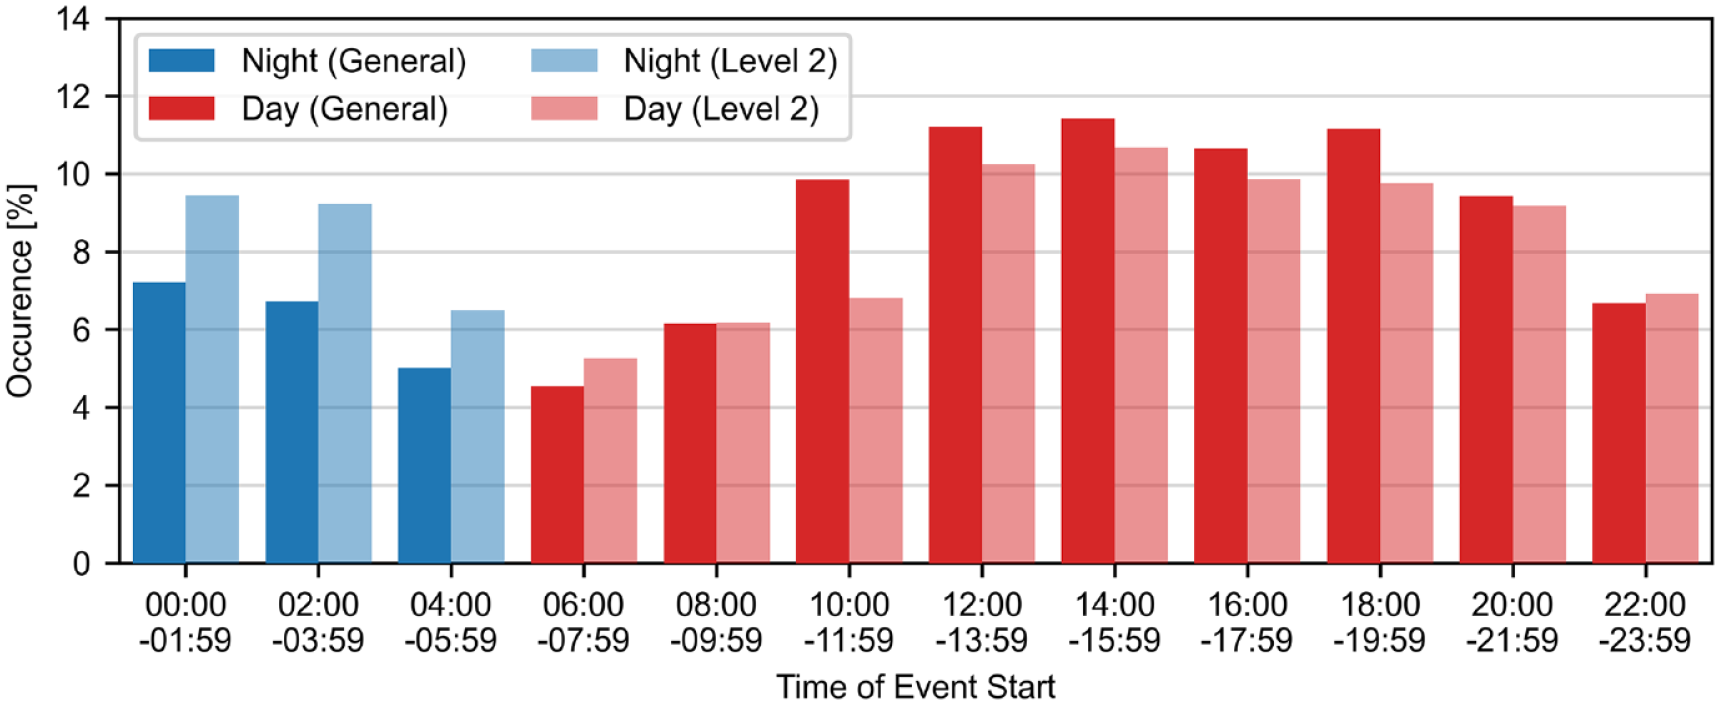
Distribution of general (CGM readings <70 mg/dl, n = 6869) and level 2 (CGM readings <54 mg/dl, n = 1865) hypoglycaemic event start times over the course of the day.
The median time profiles of nocturnal and diurnal hypoglycaemic events as well as the time before and after are shown in Figure 4. It demonstrates that general nocturnal hypoglycaemic events were longer in duration in comparison to diurnal events (60 [30-105] minutes vs 35 [25-55] minutes, P < .001). L2 hypoglycaemic events were on average shorter in duration, compared to events <70 mg/dl, with the difference between nocturnal and diurnal events being less pronounced (35 [20-65] minutes vs 25 [20-40] minutes, P < .001).
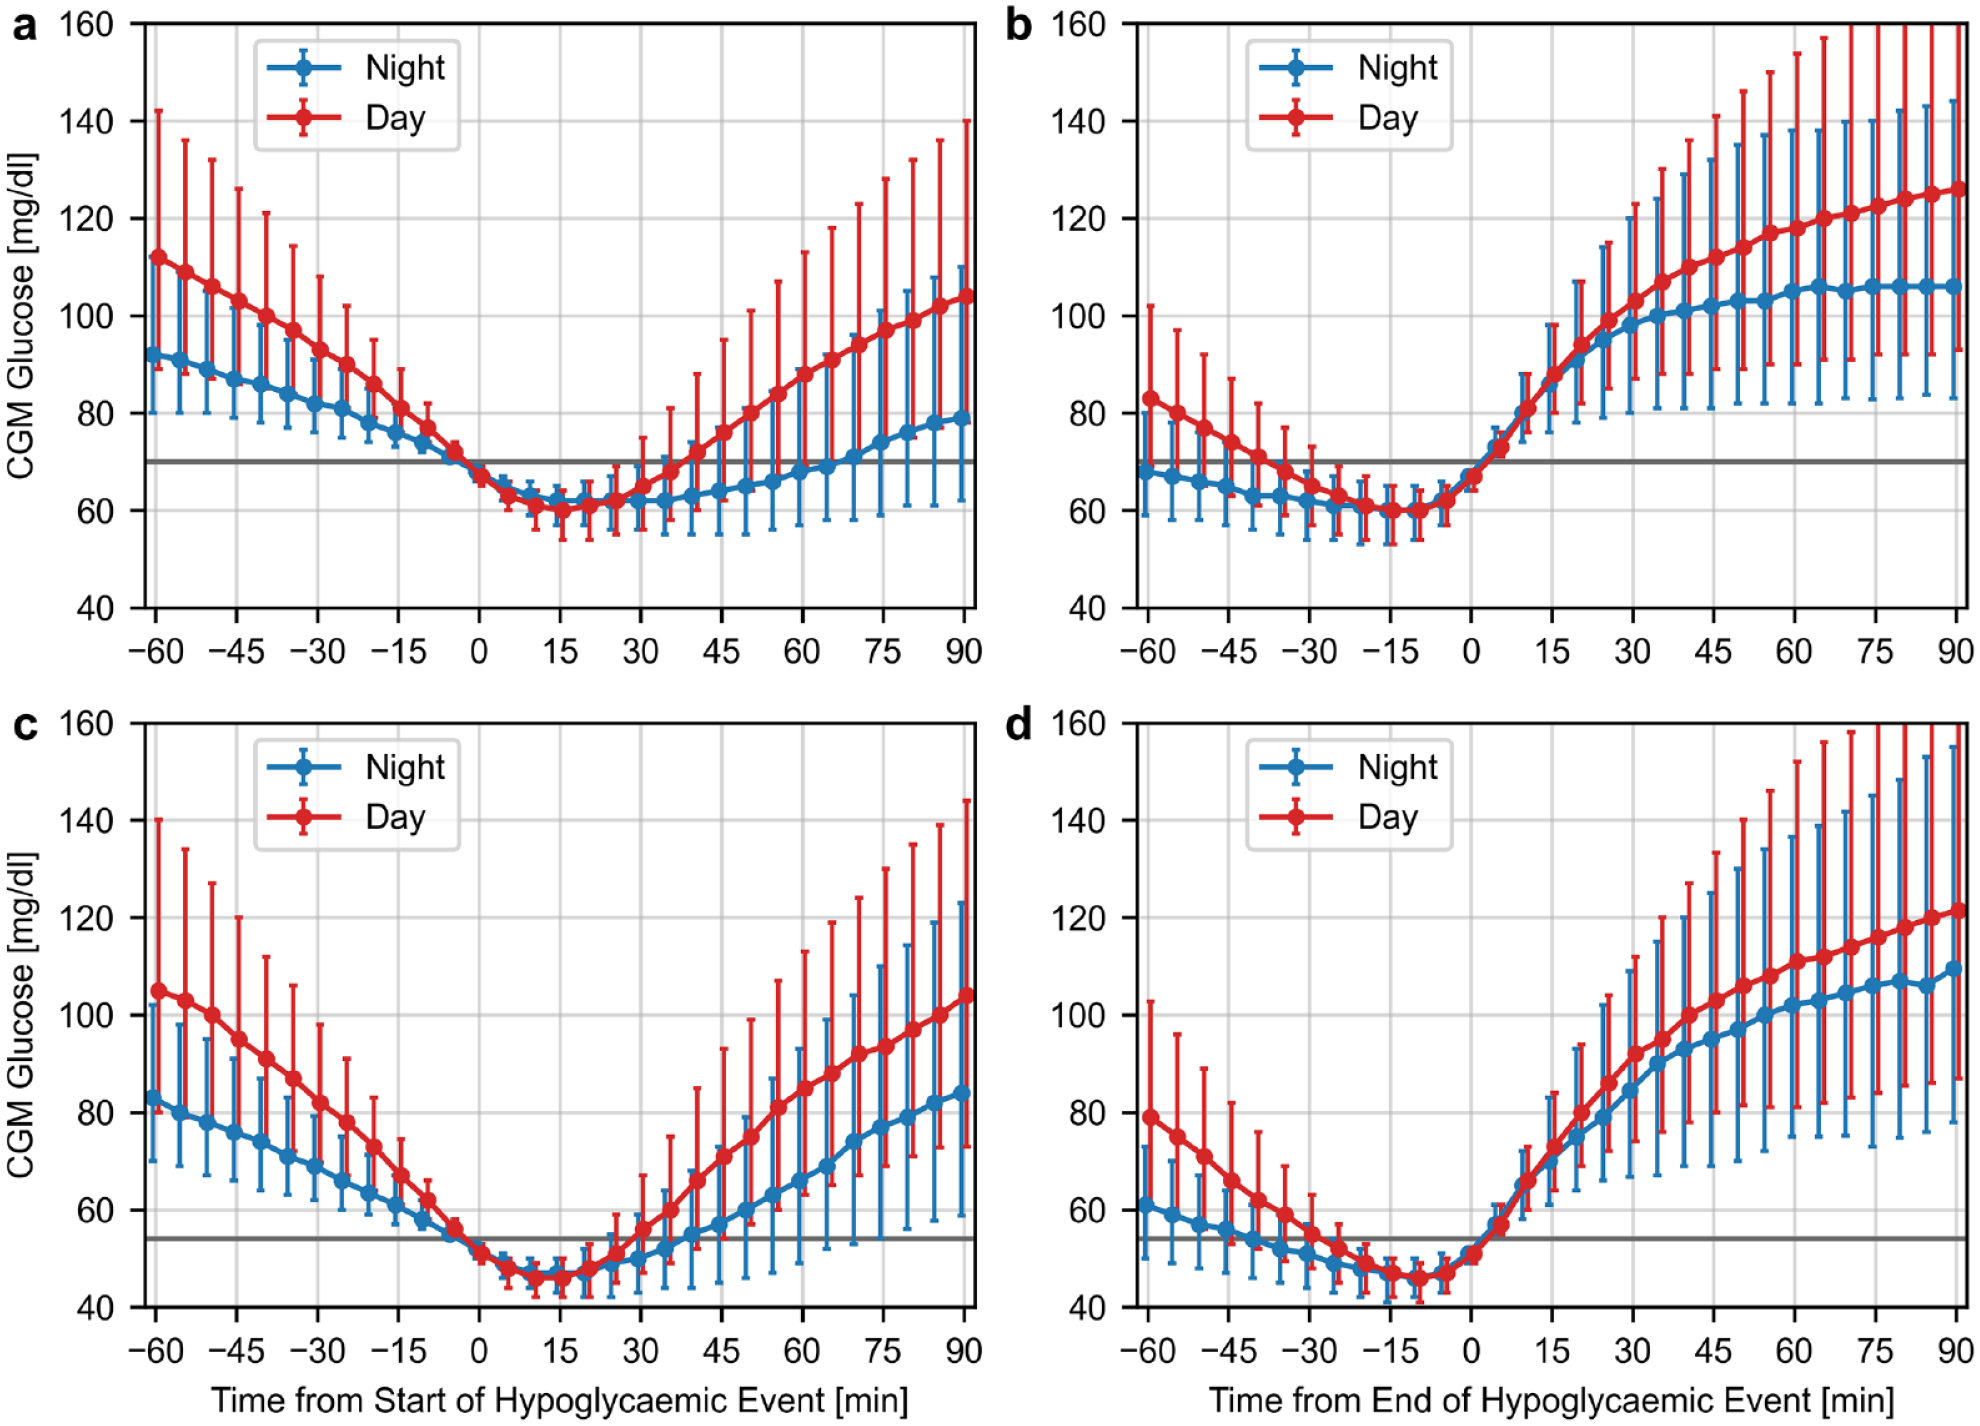
Median time profiles and interquartile range (error bars) of nocturnal and diurnal hypoglycaemic events normalized to the start/end of the events with CGM readings <70 mg/dl (panels a and b), and with CGM readings <54 mg/dl (panels c and d).
The results of analyzing the effect of nocturnal hypoglycaemic events on glucose levels during the following day are shown in Table 3.
Diurnal (06:00-23:59) Glycaemia Metrics on Days With and Without Nocturnal Hypoglycaemic Events.
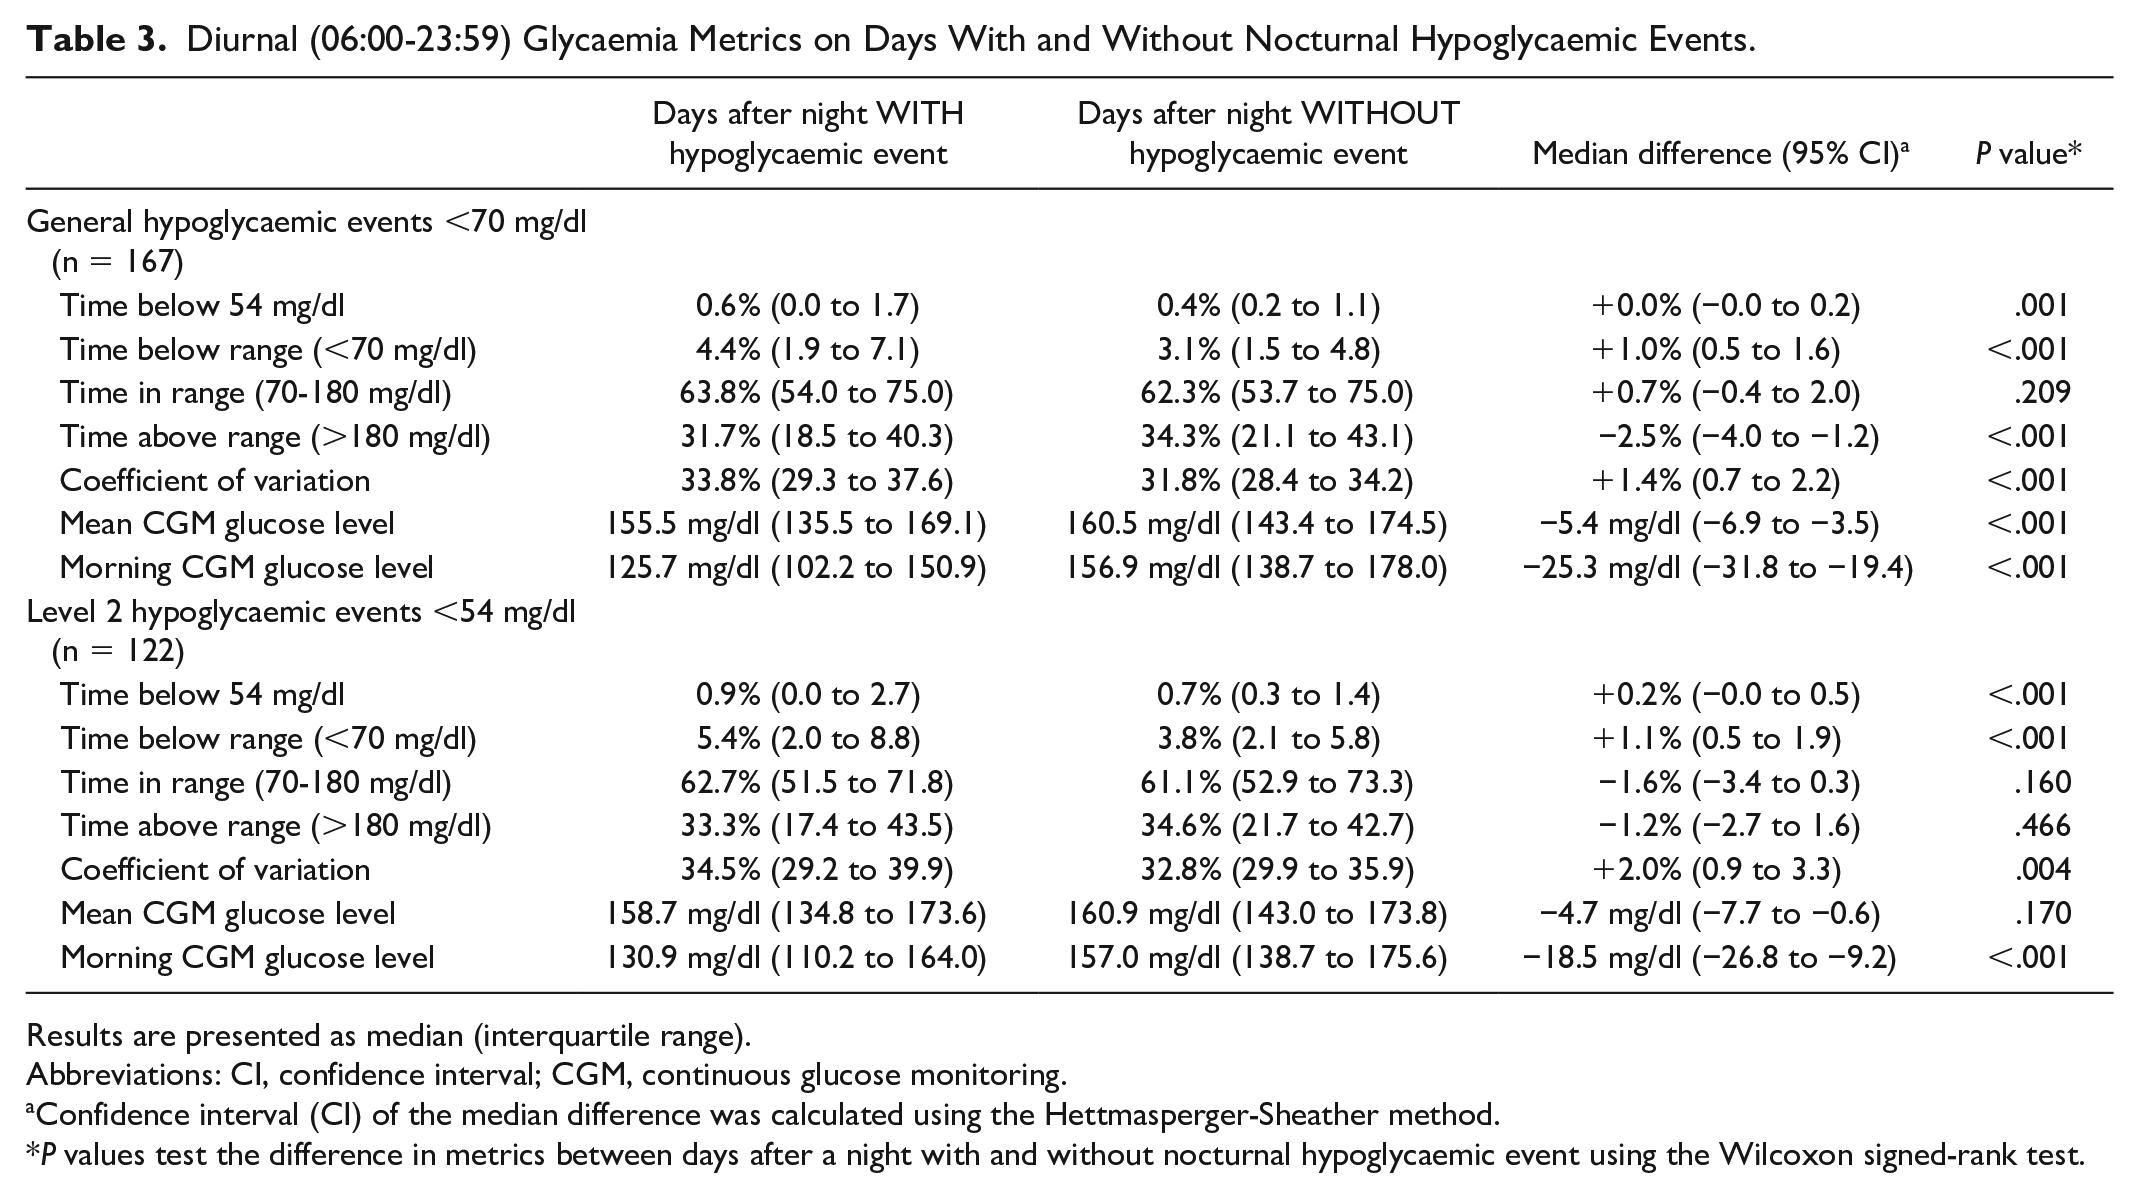
Results are presented as median (interquartile range).
Abbreviations: CI, confidence interval; CGM, continuous glucose monitoring.
Confidence interval (CI) of the median difference was calculated using the Hettmasperger-Sheather method.
P values test the difference in metrics between days after a night with and without nocturnal hypoglycaemic event using the Wilcoxon signed-rank test.
Discussion
This analysis examined the characteristics and consequences of nocturnal hypoglycaemic events in a population of persons with diabetes type 1 treated with MDI therapy using CGM. One of the main findings of this analysis is that nocturnal hypoglycaemic events with CGM readings <70 mg/dl occurred less frequently in comparison to diurnal events, even when accounting for the different lengths of night and day, whereas the incidence of L2 hypoglycaemic events with CGM readings <54 mg/dl was not significantly different between night and day. In contrast, the duration of both types of hypoglycaemic events was significantly longer during the night (60 minutes vs 35 minutes for a threshold of 70 mg/dl; 35 minutes vs 25 minutes for a threshold of 54 mg/dl) which can explain the similar TBRs and TB54s during night- and daytime. In addition to the duration, the CGM readings before and after a hypoglycaemic event were different between night- and daytime as shown in Figure 4. Analyzing the distribution of hypoglycaemic event start times over the course of the day (Figure 3) showed considerable heterogeneity. In particular, hypoglycaemic events were least common in the morning hours and most common around lunch and dinner time. There was also a clear reduction in the occurrence of hypoglycaemic events starting between 04:00h and 05:59h compared to the preceding night hours.
Examining the relationship between the participants’ TIR over the entire study and their incidence of hypoglycaemic events (Figure 2) revealed that participants with a TIR between 70% and 85% who met the target of >70%, 15 had the highest incidence of general hypoglycaemic events across all time periods, and an incidence of L2 hypoglycaemic events similar to participants with a TIR ≤55%. While there was also a large variability between participants, this indicates that even patients with a TIR above the target can suffer from a high hypoglycaemic event incidence. Only when TIR was >85%, a considerable reduction in the hypoglycaemic event incidence was observed.
Although hypoglycaemia is a well-studied acute complication of diabetes management, it is difficult to compare the results presented in this article with the findings reported in the literature. While the CGM-identified frequency of nocturnal or overall hypoglycaemic events in participants using MDI have been reported,10-12,16 the results are not directly comparable because of differing definitions of hypoglycaemic events with respect to duration and thresholds. Furthermore, only one of these studies made a similar comparison between CGM-identified nocturnal and diurnal hypoglycaemic events, meaning the exact definition of a hypoglycaemic event is less relevant when comparing results. In fact, their results showed a similar pattern to the present article of lower general, and similar L2, hypoglycaemic event incidences during the night. 10
Finally, this article analyzed the effect of nocturnal hypoglycaemic events on glycaemia the following day (Table 3). For days, following nights containing at least one hypoglycaemic event, there was a change in almost all examined glycemic metrics, with a decrease in TAR, mean CGM glucose level and morning glucose levels and an increase in TB54, TBR, and CV. This increase indicates that nocturnal hypoglycaemic events are associated with a higher glucose variability and risk of hypoglycaemic events the following day. However, the clinical relevance of the effect size appears to be limited. The observed reduction of morning glucose levels after nights with a hypoglycaemic event agrees with a previous study 17 ; therefore, providing additional evidence for the rarity of the Somogyi effect, which postulates that fasting hyperglycaemia can be caused by the release of counter-regulatory hormones in response to nocturnal hypoglycaemia.
The dataset underlying this analysis has several limitations that should be discussed. The use of optional hypoglycaemia alert functions of the CGM system, apart from the default alert setting for CGM readings ≤55 mg/dl, was not controlled. Therefore, it is not known to which extent hypoglycaemia alerts influenced its incidence. Another limitation is the CGM system used (Dexcom G5), which is an older-generation CGM system with a reduced accuracy in comparison to newer CGM system generations.18,19 While this CGM system has shown reduced accuracy at glucose levels <70 mg/dl, it is difficult to infer how this affected the identification of hypoglycaemic events. Furthermore, information on insulin administration and food intake, as well as certain aspects of the participants’ behavior such as exercise or alcohol consumption was not included in the analysis. In addition, the presence of diabetes-related complications, in particular impaired hypoglycaemia awareness (IHA), was not documented, which impaired the ability to judge the extend by which the study population represent the general cohort of people with type 1 diabetes using MDI. Here, the fact that no severe hypoglycaemic episode occurred throughout the study indicates that people with IHA might have been underrepresented. A general issue when using CGM systems is the fact that the detection of nocturnal hypoglycaemic events was likely influenced by the possible occurrence of pressure-induced sensor attenuations, also known as compression artifacts. These artifacts are characterized by a sudden drop in CGM readings and are more common during the night because of lying on the sensor which can lead to reduced circulation in the tissue around the sensor insertion site. 20 Some of these artifacts were likely removed during the data processing by identifying changes in the CGM signals >±10 mg/dl/min; however, the possible presence of remaining artifacts might have overestimated incidence of nocturnal hypoglycaemic events. Finally, it should be mentioned that the nocturnal period (00:00 to 05:59) does not necessarily coincide with actual sleep, despite the fact that nightshift work was among the exclusion criteria for this study. Here, a recent study showed that there can be a difference in the hypoglycaemic event incidence depending on whether clock or actual sleep time is considered. 21
Conclusion
This study and analysis showed significant differences between the characteristics of nocturnal and diurnal hypoglycaemic events in patients on MDI therapy who use a CGM system. Further research into this topic by applying the approach to hypoglycaemic event identification and analysis presented in this article to other data sets collected on similar or different patient groups is encouraged.
The results of this study showed that nocturnal and overall hypoglycaemic events are a common occurrence in persons with type 1 diabetes using MDI therapy, even when current TIR targets are met. While patients using continuous subcutaneous insulin infusion can access technical solutions for the mitigation of nocturnal hypoglycaemic events, this study suggests that similar technological support systems for the prevention of nocturnal hypoglycaemic events in patients on MDI therapy could be beneficial.
Footnotes
Acknowledgements
The authors are grateful to the PREDICT study participants for making this research possible. They thank Dr Daniel Militz, Dr Sandra Moceri, Dr Christian Ringemann, and Christine Zepezauer for careful review of the manuscript.
Abbreviations
CGM, continuous glucose monitoring; CV, coefficient of variation; IHA, impaired hypoglycaemia awareness; L2, level 2 hypoglycaemia; MDI, multiple daily injections; TAR, time above range; TB54, time <54 mg/dl; TBR, time below range; TIR, time in range.
Declaration of Conflicting Interests
The author(s) declared the following potential conflicts of interest with respect to the research, authorship, and/or publication of this article: GF is the general manager and medical director of the Institute for Diabetes Technology (Institut für Diabetes-Technologie Forschungs- und Entwicklungsgesellschaft mbH an der Universität Ulm, Ulm, Germany), which carries out clinical studies, for example, with medical devices for diabetes therapy on its own initiative and on behalf of various companies. GF/IfDT have received research support, speakers’ honoraria or consulting fees in the last 3 years from Abbott, Ascensia, Berlin Chemie, Boydsense, Dexcom, Lilly Deutschland, Novo Nordisk, Perfood, Pharmasens, Roche, Sinocare, Terumo, and Ypsomed. ME, DW, and SÖ are employees of IfDT. LH is a shareholder of the Profil Institut für Stoffwechselforschung GmbH, Neuss, Germany. LH is a consultant for several companies that are developing novel diagnostic and therapeutic options for diabetes treatment. RZ has received speakers’ honoraria or consulting fees in the last 3 years from Abbott, Dexcom, Lilly, Medtronic, mySugr, Novo Nordisk, Roche Diabetes Care, VitalAire, and Ypsomed. BK has received speakers’ honoraria or consulting fees from Abbott, Bayer, Berlin Chemie, Dexcom, Embecta, Emperra, Lilly, Novo Nordisk, Roche, Sanofi, Ypsomed. OS is the founder and general manager of Sciarc GmbH, Baierbrunn, Germany. OS is a consultant for several companies that are developing diagnostic and therapeutic options for the management of cardiovascular diseases, chronic kidney diseases, obesity, and metabolic diseases. TG is an employee and stockholder of Roche Diabetes Care GmbH, Mannheim, Germany.
Funding
The author(s) disclosed receipt of the following financial support for the research, authorship, and/or publication of this article: This study and associated scientific activities were sponsored by Roche Diabetes Care GmbH.