
Abstract
Background:
Standardized reporting of continuous glucose monitoring (CGM) metrics does not provide extra weighting for very high or very low glucose, despite their distinct clinical significance, and thus may underestimate glycemic risk in people with type 1 diabetes (T1D) during exercise. Glycemia Risk Index (GRI) is a novel composite metric incorporating clinician-validated extra weighting for glycemic extremes, which may provide a novel summary index of glycemia risk around exercise.
Methods:
Adults (≥18 years) in the T1D EXercise Initiative study wore CGM and activity trackers for four weeks. For this analysis, exercise days were defined as 24 hours following ≥20 minutes of exercise, with no other exercise in the 24-hour period. Sedentary days were defined as any 24 hours with no recorded exercise within that period or the preceding 24 hours. Linear mixed-effects regression was used to evaluate exercise effects on GRI and CGM metrics within 24 hours postexercise.
Results:
In 408 adults with T1D with >70% CGM and activity data, GRI on exercise (N = 3790) versus sedentary days (N = 1865) was significantly lower (mean [SD]: 29.9 [24.0] vs 34.0 [26.1], respectively, absolute mean difference −1.70 [−2.73, −0.67], P < .001), a ~5% reduction in glycemic risk. Percent time in range (TIR; 70-180 mg/dL) increased on exercise days (absolute mean difference 2.67 [1.83, 3.50], P < .001), as did time below range (TBR; relative mean difference 1.17 [1.12, 1.22], P < .001), while time above range (TAR) decreased (relative mean difference 0.84 [0.79, 0.88], P < .001).
Conclusions:
Glycemia Risk Index improved on exercise versus sedentary days, despite increased TBR, which is weighted most heavily in the GRI calculation, due to a robust reduction in TAR.
Introduction
There is a significant body of evidence demonstrating that exercise improves both physical and psychosocial well-being, and improves glucose time in range (TIR; 70-180 mg/dL) in the subsequent 24-hour period compared to sedentary days in people with type 1 diabetes (T1D).1,2 However, more than two-thirds of adults with diabetes are not meeting physical activity and exercise guidelines, with fear of hypoglycemia as a key barrier to participation. 3 Exercise increases the risk of hypoglycemia in people with T1D due to the pharmacokinetics of subcutaneously delivered insulin, which has a delayed onset and offset of action. 4 Conversely, with increasing exercise intensity, there can be a corresponding increase in counter-regulatory hormone-mediated insulin resistance which may cause blood glucose levels to rise, also leading to glycemic disturbances. 5 Importantly, this increased risk of hypoglycemia and/or glycemic instability occurs independent of insulin delivery modality, 6 where even advanced automated insulin delivery (AID) systems remain challenged by exercise.
Glucose TIR is often used as an index for overall glycemic management; however, TIR may not provide the best index of the overall glycemic profile around exercise. While TIR is significantly correlated with the time above range (TAR; >180 mg/dL), it is poorly correlated with the time below range (TBR; <70 mg/dL). 7 Importantly, current standardized reporting of continuous glucose monitoring (CGM) metrics also does not add extra weight to very high (level 2 hyperglycemia; >250 mg/dL) or very low glucose levels (level 2 hypoglycemia; <54 mg/dL), despite their increased clinical significance, and thus may potentially underestimate glycemic risk exposure in people with T1D. 8 The clinical implications for time spent in level 1 hypoglycemia (<70 mg/dL) versus level 2 hypoglycemia (<54 mg/dL) are significant, and no current single metric assessing glycemic control weighs these factors. The Glycemia Risk Index (GRI) is a novel, recently defined composite glycemic metric, based on 330 experienced clinician’s rankings of CGM tracings from 225 insulin-treated adults with diabetes, which they ranked based on the overall “risk” of the glycemic profiles. 8 The GRI provides a single number rating (i.e., lower GRI is better) of a glycemic profile incorporating weighting factors to the time spent in low, very low, high, and very high glycemic ranges. 8 Importantly, the GRI places a greater overall emphasis on TBR versus TAR, as well as a greater emphasis on time spent in the extreme ranges of hypo- and hyperglycemia. In addition, in contrast to other composite metrics for assessing overall glucose control, GRI is easily calculated from standard, commonly reported CGM metrics. To date, GRI has been predominantly discussed in the context of overall glycemic control, with several recent publications evaluating GRI from real-life CGM data,9-12 highlighting its usefulness for assessing glycemic quality in a clinical context but not specifically regarding its utility to describe glucose control with exercise.
Thus, GRI provides an ideal index of the glycemic profile with exercise compared to standard CGM metrics which have been criticized for not being adequately sensitive to hypoglycemia. In addition, GRI provides a supplementary avenue to assess a range of factors regarding their influence on glycemic quality and/or risk with exercise, such as baseline glucose, TIR, TBR, and TAR, as well as exercise type, prandial state, and insulin delivery modality. Accordingly, the aim of this analysis was to compare glycemic risk (via GRI) related to glucose instability and hypoglycemia, on exercise days versus sedentary days using data in adults with T1D from the Type 1 Diabetes EXercise Initiative (T1DEXI) database. We hypothesized that GRI would be higher on exercise versus sedentary days, despite increased TIR, due to the impact of exercise on increasing overall time spent in hypoglycemia.
Methods
Study Design and Population
The T1DEXI study was an observational real-world study in adults with T1D that assessed glycemic responses to exercise. The primary study was conducted with Jaeb Center for Health Research (JAEB) and various researchers in clinical diabetes management, exercise physiology, and diabetes-related technologies. The project was funded by the Leona M. and Helmsley B. Charitable Trust and in partnering with Vivli (Center for Global Clinical Research, Cambridge, MA, USA), this dataset was made open access and publicly available.
Participants used a CGM system (personal or professional Dexcom G6 CGM; San Diego, CA, USA) and a physical activity tracker (Verily; San Francisco, CA, USA) throughout the study period. Participants were allocated to six video-guided exercise sessions over four weeks, and for the study duration, were encouraged to achieve >150 minutes weekly physical activity, and used a study-specific mobile app (T1DEXI app) to capture exercise details including time, duration, activity type, self-reported exercise intensity, and timing since the last meal. Additional details on the study design are published elsewhere. 2
As there was no CGM data collected prior to the study start, in lieu of proper “baseline” CGM metrics, “overall CGM metrics” were calculated as the average of the entire four-week study duration.
Exercise days were defined as the 24-hour period following exercise commencement. To be included in the present analysis, exercise bouts were required to last at least 20 minutes, with no further exercise performed in the subsequent 24-hour period. A sedentary day was defined as any 24-hour period during which there was no recorded exercise (of any duration), and additionally had no exercise recorded in the preceding 24-hour period. Both exercise and sedentary days were included only if at least 70% of CGM data were available. Participants who did not have at least one exercise and one sedentary day were excluded from the analysis.
The heart rate (HR) data during exercise was captured using a Verily physical activity tracker (San Francisco, CA, USA). Exercise intensity was reported as a percentage of age-predicted max HR (APHRmax 13 ; i.e., 220-age) and further classified into high intensity (>75%), moderate intensity (50%-75%), and low intensity (<50%).
The prandial state was self-reported by the participants and defined as postprandial where a participant consumed a meal was consumed >four hours pre-exercise.
Statistical Analyses and Outcomes
Descriptives are presented using median (interquartile range), mean (standard deviation), and count (percentage). The GRI value was computed as described by Klonoff et al, 8 such that GRI = (3.0 × TBR <54 mg/dL) + (2.4 × TBR <70-54 mg/dL) + (1.6 × TAR >250 mg/dL) + (0.8 × TAR >180-250 mg/dL). Glycemia Risk Index scores fall within five categories as described by Klonoff et al, 8 which represent the five quintiles corresponding to the most optimal (Zone A; 0-20th percentile) to least optimal (Zone E: 80th-100th percentile) “quality” of glycemia. The CGM outcomes and GRI were compared between exercise and sedentary days using a linear mixed-effects model with unstructured covariance, where participants were included as random effects and exercise indicator was included as fixed effect. Results are presented as mean difference between exercise and sedentary days with 95% confidence intervals. Some outcomes required transformation using natural logarithm to enable a better model fit (GRI components, times in hyperglycemia ranges, times in hypoglycemia ranges). These results are presented as relative difference (exponentiated coefficient) with 95% confidence intervals. Effect of baseline characteristics (insulin delivery, sex, overall CGM metrics) on change in GRI was evaluated with the same model as described above while including the characteristics, interaction between characteristics, and exercise indicator as fixed effects.
The relationship between exercise intensity and both GRI and standard CGM metrics was evaluated using only exercise days. Linear mixed-effects regression with unstructured covariance was used, participants were entered as random effects and exercise intensity, exercise duration and timing of last meal were entered as fixed effects. Some outcomes required transformation as described above. The same analysis was performed to evaluate the association between timing of the last meal and GRI and CGM metrics (adjusted for exercise intensity and exercise duration). An additional analysis using only CGM from exercise start to two hours postexercise was performed. All statistical hypotheses were two-sided and tested at the 0.05 level of significance. All statistical analyses were conducted using STATA 18 (StataCorp LLC, Texas, USA).
Results
Study Participants
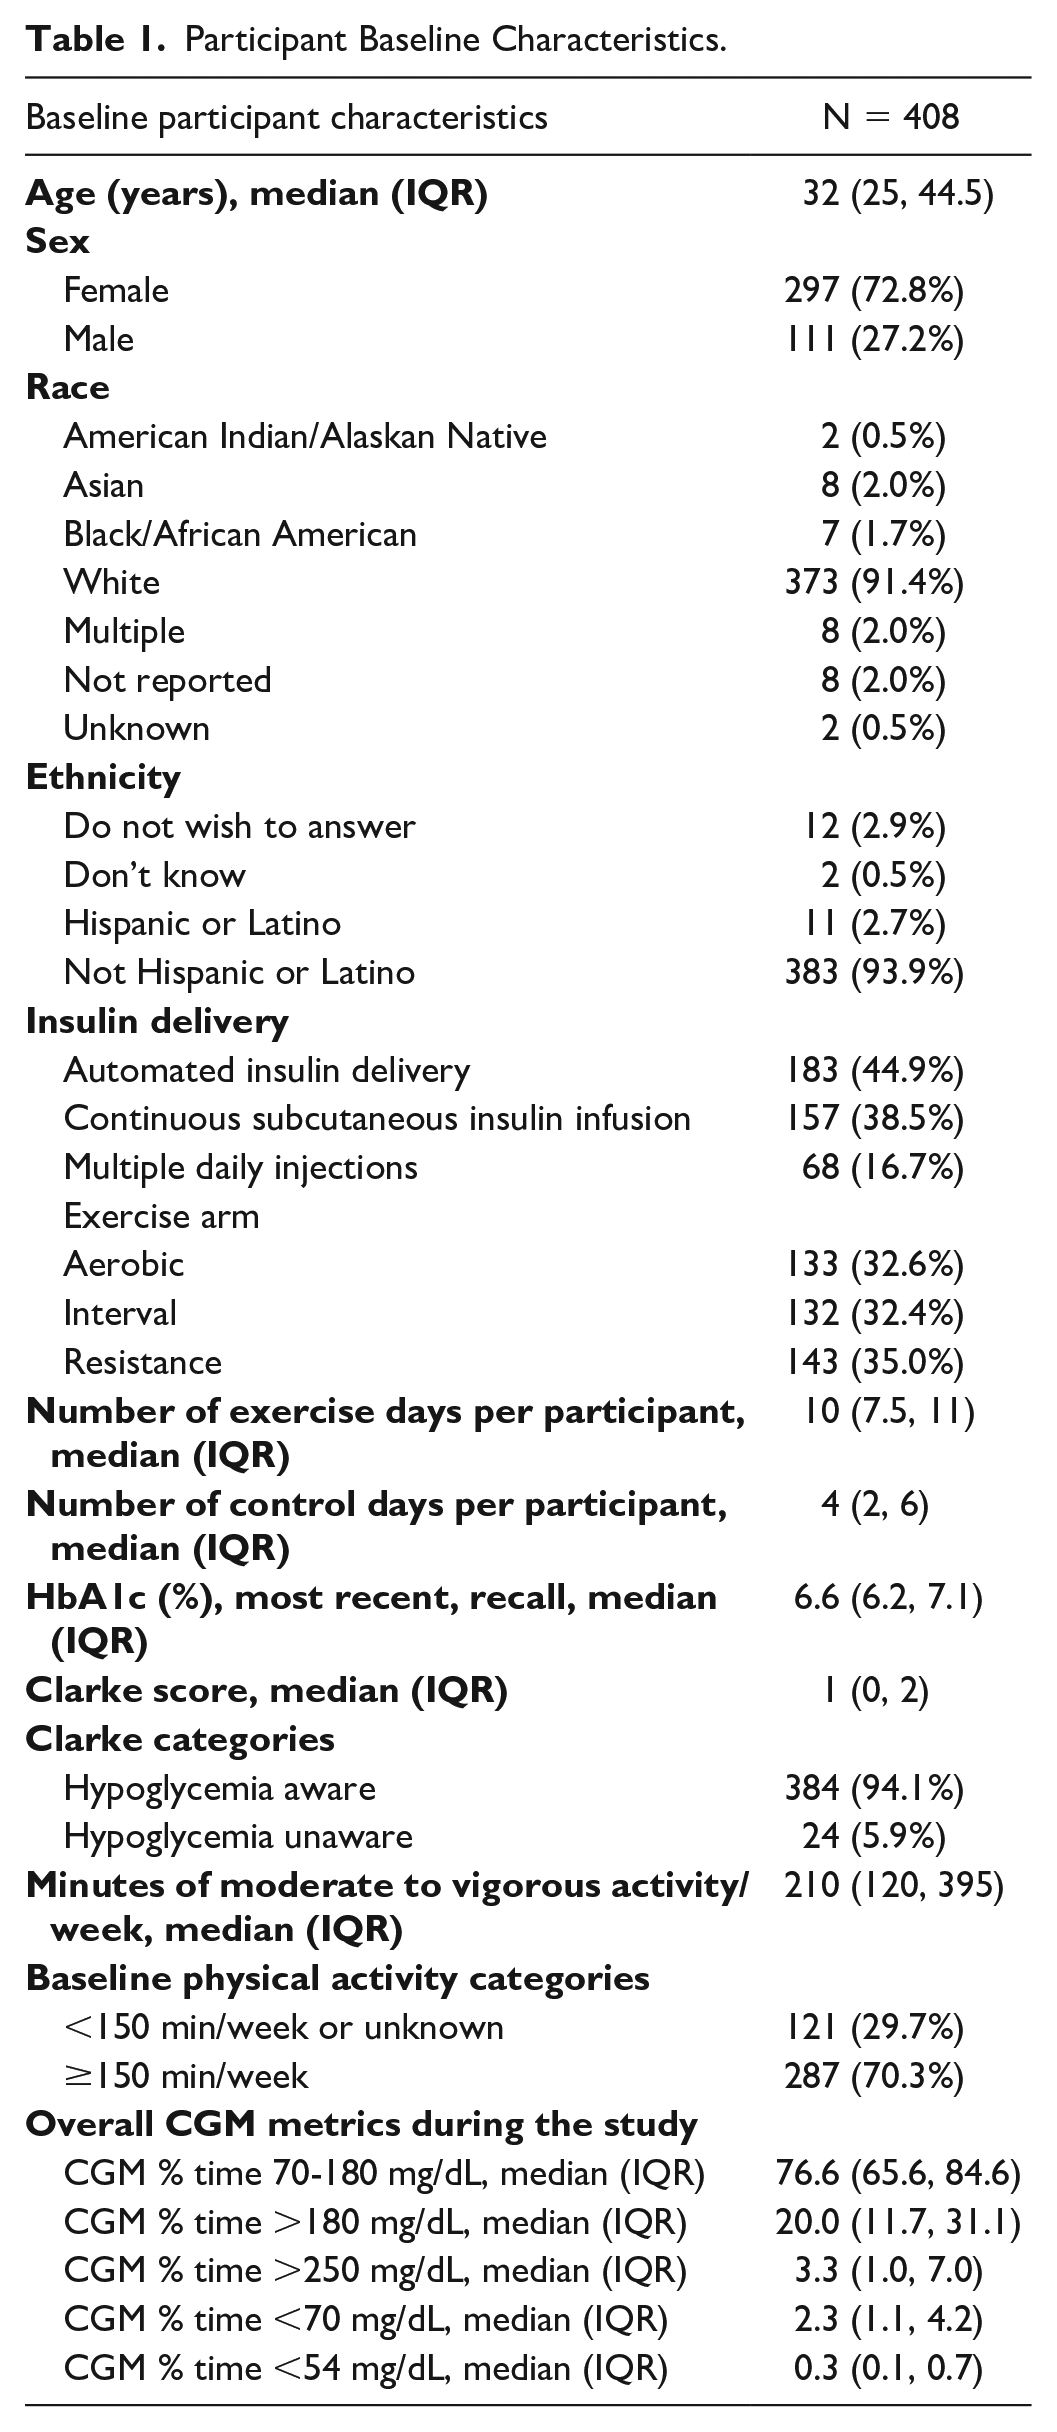
A total of 561 adults with T1D were enrolled in the study and 408 participants met the criteria necessary for inclusion in the present analysis (Supplementary Figure 1). The median age was 32.0 (interquartile range [IQR]: 25.0, 44.5) years, 72.8% female, 91.4% self-identified as White, 93.9% as non-Hispanic. A total of 16.7% (n = 68) of participants were using multiple daily injections (MDI), 38.5% (n = 157) were using open-loop therapy/continuous subcutaneous insulin infusion (CSII), and 44.9% (n = 183) were using AID systems (Table 1). Analysis included a total of 3790 exercise days and 1865 sedentary days. Median duration of exercise was 32 (IQR 30-53) minutes, where 70% of exercise sessions were classified as moderate intensity (mean HR 50%-75% of maximum HR), approximately 10% as high-intensity exercises (HR >75% max) and 12% as low intensity (HR < 50% max). The remaining 10% of exercise sessions could not be classified due to lack of available HR data.
Participant Baseline Characteristics.
Exercise Versus Sedentary Days
Glycemia Risk Index
The GRI was significantly lower on exercise (mean [SD]; 29.9 [24.0]) versus sedentary (34.0 [26.1]) days (Table 2; Figure 1, P = .001), an overall ~5% reduction in glycemic risk. This was reflective of a significantly reduced GRI hyperglycemia component (~15% reduction) following exercise and despite an increased GRI hypoglycemia component (~17% increase) of the GRI calculation (Table 2, P < .001).
Comparison of CGM Metrics on Exercise Versus Sedentary Days.
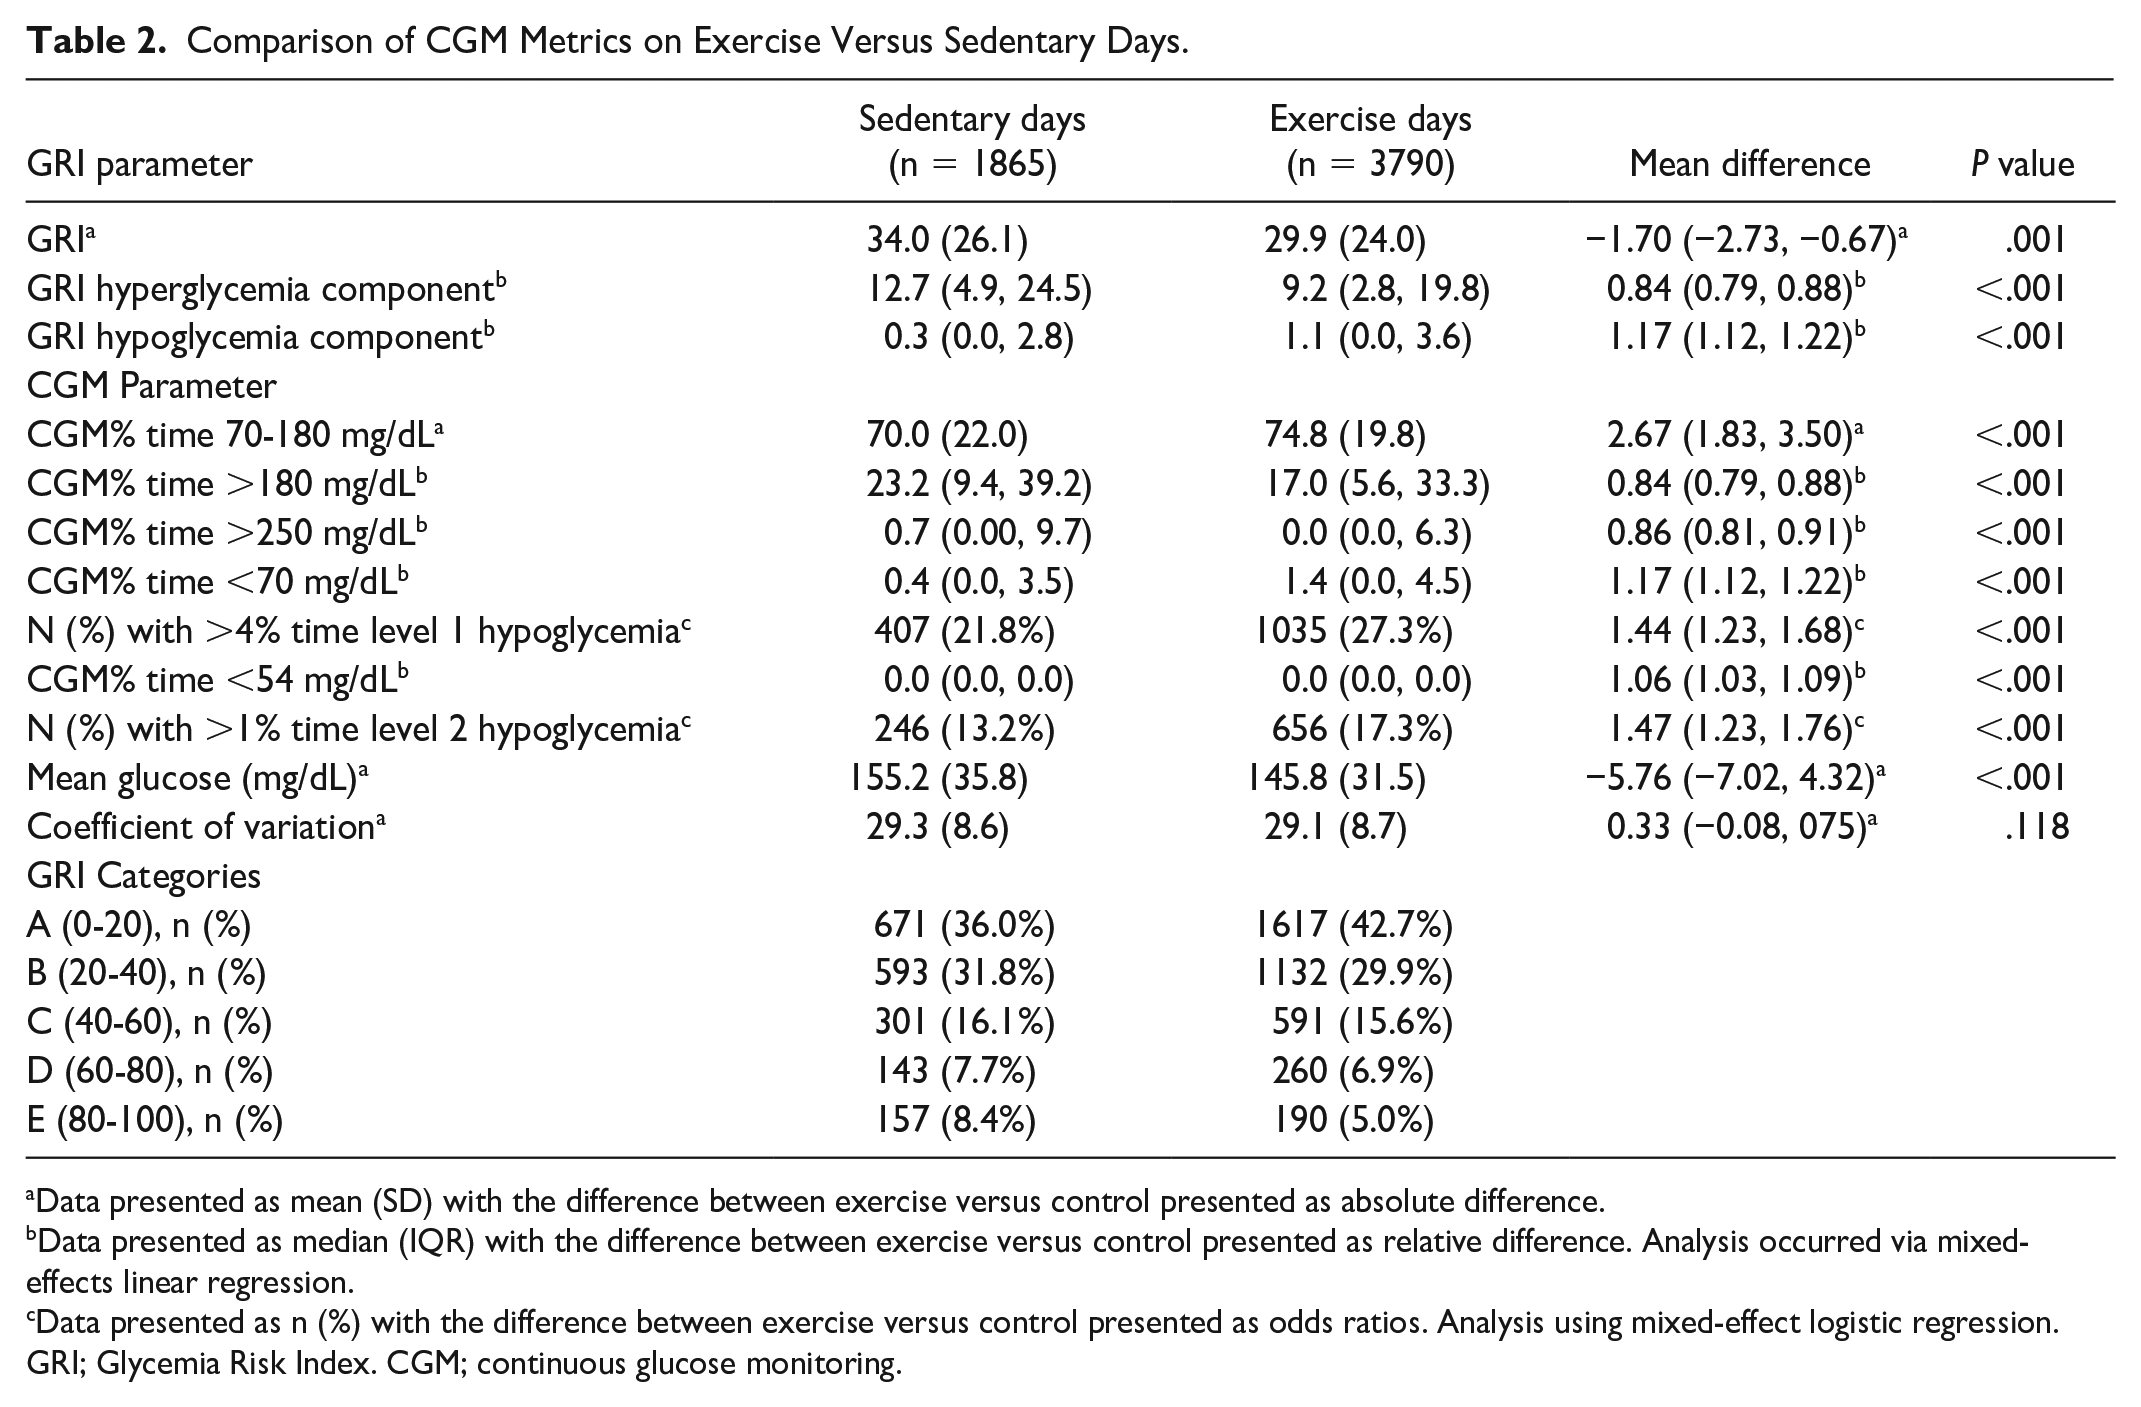
Data presented as mean (SD) with the difference between exercise versus control presented as absolute difference.
Data presented as median (IQR) with the difference between exercise versus control presented as relative difference. Analysis occurred via mixed-effects linear regression.
Data presented as n (%) with the difference between exercise versus control presented as odds ratios. Analysis using mixed-effect logistic regression.
GRI; Glycemia Risk Index. CGM; continuous glucose monitoring.
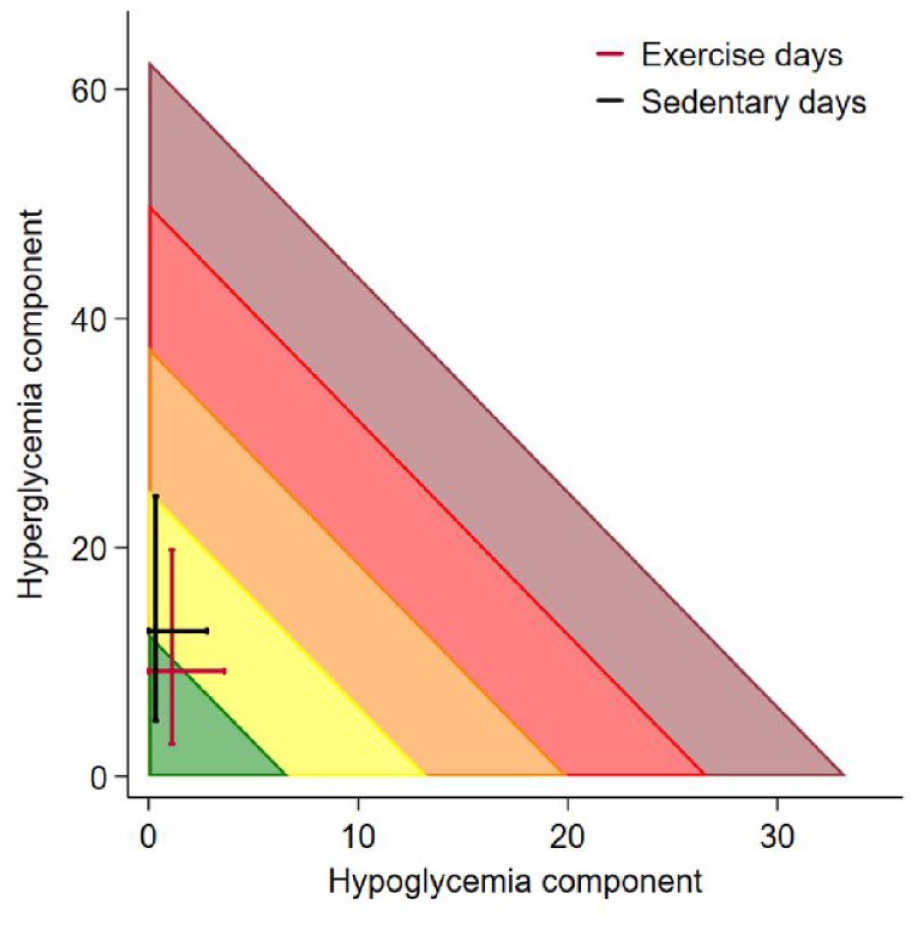
A Glycemic Risk Index (GRI) grid showing the hyperglycemia component versus the hypoglycemia component on exercise (red lines) and sedentary days (black lines). Each line represents interquartile range whereby they cross at median values.
Standard CGM metrics
Glucose TIR (70-180 mg/dL) was significantly greater on exercise versus sedentary days, an overall ~4% increase (Table 2, P < .001). Time spent in level 1 hypoglycemia (<70 mg/dL) and level 2 hypoglycemia (<54 mg/dL) were also significantly greater on exercise versus sedentary days (Table 2; P < .001). Time spent in level 1 hyperglycemia (>180 mg/dL) and level 2 hyperglycemia (>250 mg/dL) were significantly lower following exercise versus sedentary days (Table 2; P < .001). Co-efficient of variation was not significantly different between exercise and sedentary days (Table 2; P = .118).
Effect of Baseline Characteristics
Insulin delivery modality
Glycemia Risk Index
Insulin delivery modality significantly affected the change in GRI observed with exercise (Supplementary Table 1, P = .035). The largest improvement in GRI for exercise versus sedentary days occurred in those using MDI (absolute mean difference [95% confidence interval (CI)]; −4.44 [−7.13, 1.74], P = .001), greater than those using CSII (−2.21 [−3.86, −0.55], P = .009]). There was no significant change in GRI on exercise versus sedentary days for those using AID (−0.52 [−2.02, 0.99], P = .5; Figure 2).
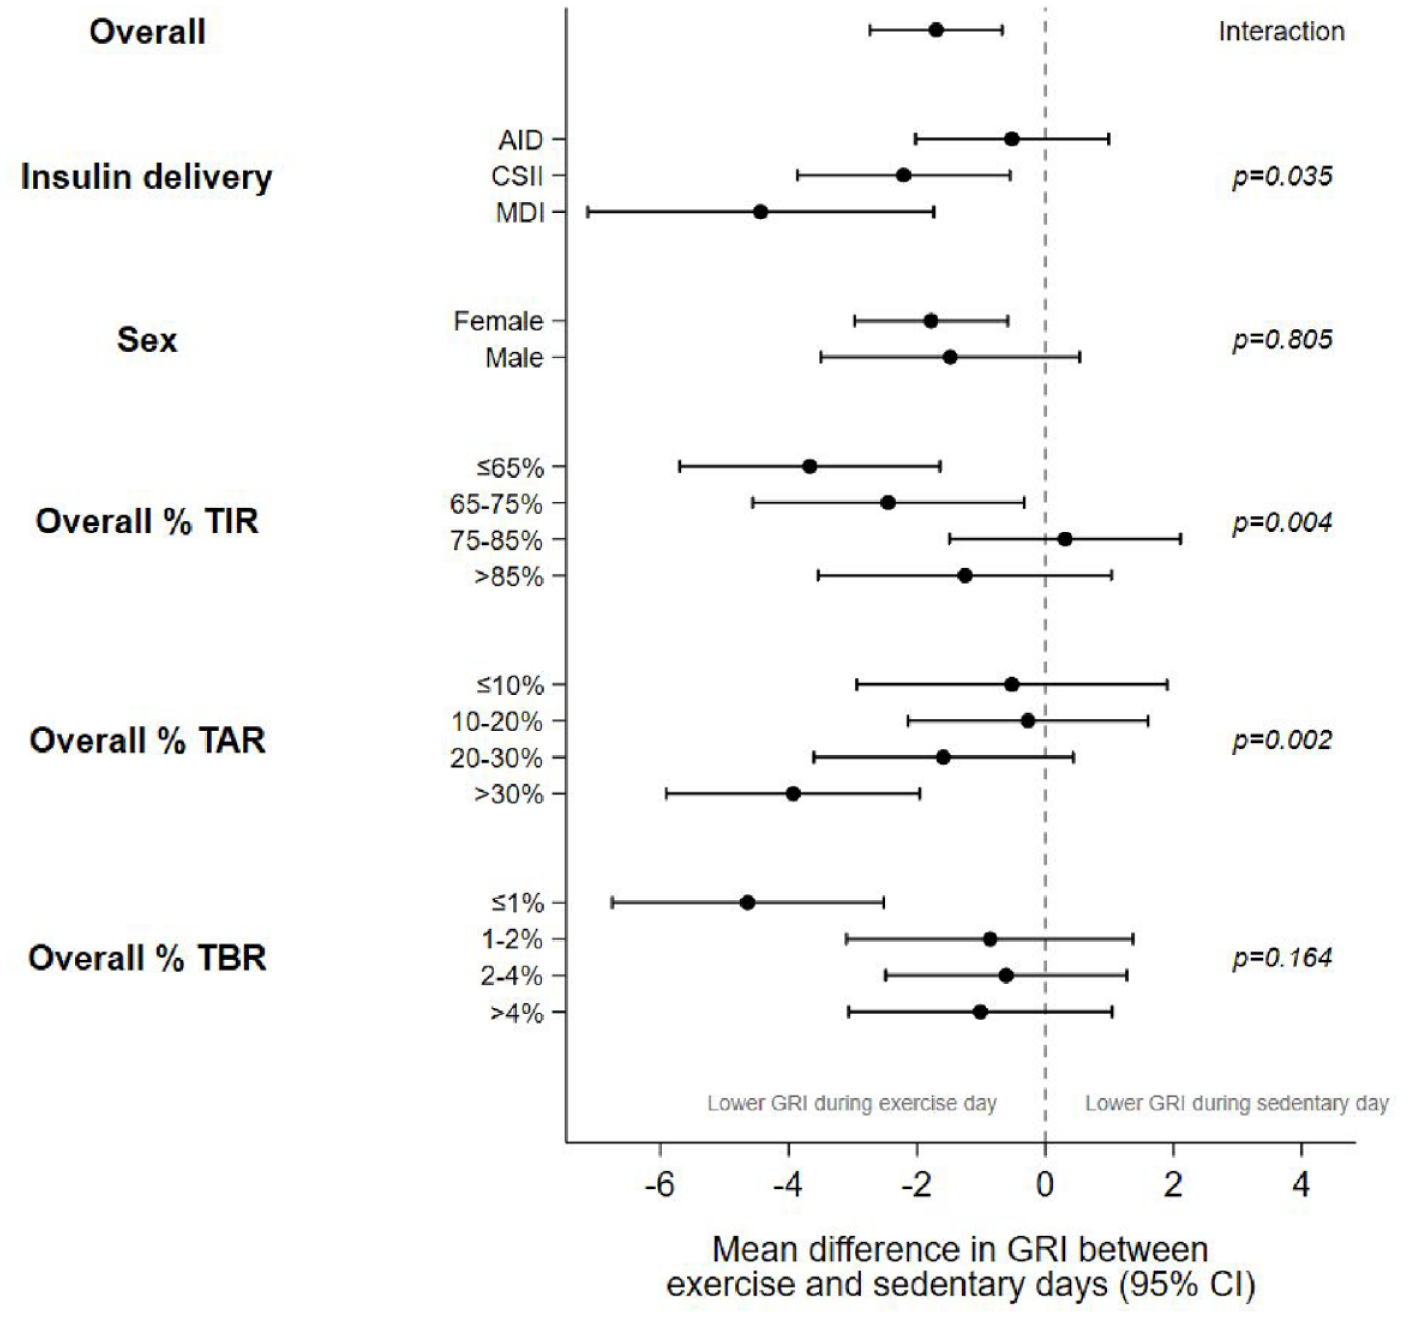
Forest plot showing the mean difference (95% CI) in GRI between exercise and sedentary days for subgroups based on baseline characteristics.
Standard CGM metrics
Insulin delivery modality significantly affected the change in glucose TIR with exercise (Supplementary Table 1; P = .01). The largest improvement in TIR for exercise versus sedentary days occurred in those using MDI (absolute mean difference [95% CI]; 4.83 [2.65, 7.01]) compared to CSII (2.44 [2.10, 4.78]) and AID (1.40 [0.18, 2.62]).
Time spent in level 1 hypoglycemia was significantly greater on exercise versus sedentary days for those using AID (P < .001) and CSII (P < .001), but not MDI (P = .133); with no significant difference between insulin delivery modalities (Supplementary Table 1). However, insulin delivery modality significantly affected the change in time spent in level 2 hypoglycemia (Supplementary Table 1, P = .013). The largest increase in time spent in level 2 hypoglycemia occurred in those using CSII (relative mean difference [95% CI]; 1.11 [1.06, 1.16]), greater than those using AID (1.04 [1.00, 1.09]); with no significant change in those using MDI (0.99 [0.93, 1.06], P = .826).
Insulin delivery modality also significantly affected the change in time spent in level 1 hyperglycemia with exercise (Supplementary Table 1; P = .013). The largest reduction in time spent in level 1 hyperglycemia occurred in those using MDI (relative mean difference [95% CI]; 0.74 [80.65, 0.85]), followed by CSII (0.79 [0.73, 0.86]) and least in those using AID (0.91 [0.84, 0.98]). Time spent in level 2 hyperglycemia was significantly lower on exercise versus sedentary days for those using AID (P = .016), CSII (P < .001), and MDI (P = .012); with no significant difference between insulin delivery modalities (Supplementary Table 1).
The co-efficient of variation was not significantly different between insulin delivery modalities.
Sex
There were no significant differences between males and females for GRI (Figure 2) or for any of the standard CGM metrics (data not shown).
Overall CGM profile
Participants who had a lower overall TIR (≤75%) showed significantly larger decreases in GRI on exercise days compared to those with higher overall TIR (>75%; Figure 2, P = .004). Those with higher overall TAR (>30%) also showed significantly larger decreases in GRI compared to those with lower overall TAR (≤30%; P = .002). While overall TBR was not significantly associated with a change in GRI on exercise days (P = .164), only those with very low (<1%) overall TBR showed a significant decrease in GRI on exercise days (−4.6 [−6.8, −2.5], P < .001).
Exercise Intensity
Glycemia Risk Index
After adjusting for exercise duration and the last meal consumed, GRI was not significantly different in the 24-hour period following high intensity (>75% APHRmax) versus low intensity (<50% APHRmax) exercise (0.02 [−1.6, 1.6], P = .977), with no change observed in the hypoglycemia or hyperglycemia component of GRI (Supplementary Table 2).
Standard CGM metrics
After adjusting for the duration of exercise and the last meal, no differences were observed in any of the standard CGM metrics (Supplementary Table 2).
Prandial State
Two hours postexercise
Glycemia Risk Index
After adjusting for exercise duration and intensity, GRI in the period from exercise onset to two hours postexercise was significantly higher for postprandial versus postabsorptive exercise (absolute mean difference [95% CI]; 5.1 [2.4, 7.8], P < .001), an overall ~20% increase in glycemic risk. This was reflective of a significantly greater GRI hypoglycemia component (relative mean difference [95% CI]; 1.22 [1.11, 1.34], P < .001), but no change to the GRI hyperglycemia component of the GRI calculation following postprandial exercise (relative mean difference 1.04 [0.92, 1.18], P = .541; Supplementary Table 3).
Standard CGM metrics
In the 2 hours postexercise for postprandial exercise (after adjusting for exercise duration and intensity), TIR was significantly lower compared to postabsorptive exercise (absolute mean difference [95% CI]; −3.0 [−5.4, −0.6], P = .013). Time spent in both level 1 and level 2 hypoglycemia was significantly greater for postprandial exercise, (relative mean difference [95% CI]; 1.23 [1.11, 1.36], P < .001; 1.09 [1.03, 1.15], P = .002, respectively), as was the co-efficient of variation (1.36 [0.48, 2.24], P = .003; Supplementary Table 3). Time spent in level 1 and level 2 hyperglycemia was not significantly impacted by the prandial state.
Twenty-four hours postexercise
Glycemia Risk Index
After adjusting for exercise duration and intensity, GRI in the period from exercise onset to 24 hours postexercise was not significantly different between postprandial and postabsorptive exercise (Supplementary Table 4; P = .702).
Standard CGM metrics
There were no significant differences in the 24 hours postexercise for any standard CGM metrics between postprandial and postabsorptive exercise (Supplementary Table 4).
Discussion
The observational T1DEXI dataset was analyzed to compare the novel composite glycemic metric GRI on days where exercise was performed versus sedentary days. In contrast to our hypothesis that exercise would increase GRI (i.e., increasing overall glycemic risk), the main finding was that GRI improved on exercise versus sedentary days. This occurred despite an increase in the time spent in level 1 (<70 mg/dL) and level 2 (<54 mg/dL) hypoglycemia; metrics whose importance are weighted most heavily by GRI.
The current analysis demonstrates that a modest exposure to glucose TBR on exercise days, coupled with a significant reduction in level 1 and 2 TAR resulted in an improvement in the GRI. Although the relative percentage change in TAR and TBR were similar, the low overall TBR in the present cohort means that the change in TAR was much more highly reflected in the GRI calculation. Similar to the main T1DEXI study findings, 2 our analysis also demonstrated improved TIR on exercise days, and the improvement in GRI on exercise days (~5%) was similar to that shown via TIR alone (~4%). A key finding of the current analysis is that GRI was improved on exercise days regardless of the overall glycemic status, with the greatest improvement occurring in those with the overall highest TAR and lowest TIR. In addition, those who had the highest overall hypoglycemia were generally not at a greater overall glycemic “risk” on exercise days. Important to note is that despite significantly increased TBR on exercise days, over 70% of exercise days still met the current clinical CGM consensus targets of <4% level 1 hypoglycemia (<70 mg/dL), 14 and the time spent in level 2 hypoglycemia (<54 mg/dL) was limited with more than 80% of days meeting the <1% target. These findings should provide reassurance to individuals with T1D that exercise generally improves the overall glycemic risk profile compared to remaining sedentary, despite a modest increase in glucose TBR. Although GRI is a relatively novel glucose metric without published data regarding its association with overall health outcomes, increased TIR has been consistently shown to associate with a reduced risk of complications in people with T1D,14,15 thus similar correlations are likely to exist for GRI, but further research is warranted.
A plethora of data now exist demonstrating that AID systems improve glucose control compared to CSII and MDI,16,17 and a recent meta-analysis showed that AID use also improves glucose control around exercise. 18 The current findings agree, with GRI on both exercise and sedentary days being lower (i.e., better) compared to those using CSII and MDI. However, exercise still challenges AID systems with regards to the risk of hypoglycemia, largely due to the pharmacokinetics of subcutaneously delivered insulin. For this reason, GRI was not improved on exercise days in those using AID as there was still an increase in TBR, which was not accompanied by a robust decrease in TAR as seen in those using CSII and MDI, likely due to a floor effect, where overall TAR was significantly lower in those using AID and thus had less scope for improvement. Importantly, TBR was modest across all insulin delivery modalities, and while GRI was not improved in those using AID on exercise versus sedentary days, it also did not significantly worsen. Finally, while exercise is beneficial for all people with T1D, the impact on glycemic risk and overall improvement in GRI is especially apparent for those using MDI.
Interestingly, these results show that the prandial state at exercise onset did not have a significant effect on GRI or standard CGM metrics across the subsequent 24 hours. However, GRI in the acute 2 hours postexercise was significantly greater for postprandial (meal >four hour pre-exercise) versus postabsorptive (meal >two hours pre-exercise) exercise; reflective of significantly increased TBR. Thus, people with T1D who wish to exercise while minimizing the risk of hypoglycemia should consider avoiding postprandial exercise (i.e., within two hours post-meal bolus) or be prepared to initiate carbohydrate feeding, as needed. Indeed, current guidelines for pre-exercise preparation in people with T1D include recommendations targeted at minimizing insulin on board (IoB) at exercise onset,19,20 as starting IoB is strongly correlated with the change in glucose during exercise. 2 However, GRI across the whole day when postprandial exercise occurred remained significantly lower than sedentary days, further highlighting the cumulative benefit of exercise on glucose control, even when performed under suboptimal conditions.
There are several limitations with the current analysis worth noting. Despite the large sample size and range of insulin delivery modalities, the present cohort of participants could be considered as having stable glucose control—where the median TIR was 70.0% and median TBR 0.4%, which is meeting clinical consensus CGM targets of >70% TIR and <4% TBR. In addition, median baseline HbA1c in this cohort was 6.6%, and therefore, the present findings limit our ability to generalize across all populations. Importantly, GRI as a metric was developed based on CGM profiles across a 14-day period and has been validated for clinical interpretation across that period, 8 and thus caution should be used in interpreting the data from this study in the context of single exercise and sedentary days. In addition, the current analysis was limited such that it did not provide sufficient granularity to compare the extreme ranges of exercise modes and/or intensity, such as ultra-long endurance events (e.g., marathon or triathlon events), extremely vigorous exercise (powerlifting, combat sports, etc.), or competition scenarios when counter-regulatory hormones and stress may significantly influence glycemic responses. In such cases, the effects of exercise on glycemia may be more extreme and erratic, thus resulting in a potential worsening in GRI on exercise days.
In conclusion, glucose control as described using the novel composite CGM metric GRI is improved on days where exercise occurs in comparison to sedentary days, in contrast to our hypothesis that exercise would increase the overall glycemic risk. This benefit was greatest in those with the poorest overall glycemia, and importantly, this risk was not increased in those with the highest overall TBR. These findings further emphasize that exercise should be a priority for all people with T1D regardless of sex, glycemic status, or insulin delivery modality, and even when performed under suboptimal conditions (i.e., postprandially), can improve cumulative glucose control.
Supplemental Material
sj-docx-1-dst-10.1177_19322968241246458 – Supplemental material for Assessment of Glycemia Risk Index and Standard Continuous Glucose Monitoring Metrics in a Real-World Setting of Exercise in Adults With Type 1 Diabetes: A Post-Hoc Analysis of the Type 1 Diabetes and Exercise Initiative
Supplemental material, sj-docx-1-dst-10.1177_19322968241246458 for Assessment of Glycemia Risk Index and Standard Continuous Glucose Monitoring Metrics in a Real-World Setting of Exercise in Adults With Type 1 Diabetes: A Post-Hoc Analysis of the Type 1 Diabetes and Exercise Initiative by Dale Morrison, Sara Vogrin and Dessi P. Zaharieva in Journal of Diabetes Science and Technology
Footnotes
Acknowledgements
This manuscript is based on research using data from the Type 1 Diabetes EXercise Initiative (T1DEXI) Study that has been made available through Vivli, Inc. Vivli has not contributed to or approved, and is not in any way responsible for, the contents of this publication.
Abbreviations
AID, automated insulin delivery; APHRmax, age-predicted heart rate maximum; CGM, continuous glucose monitoring; CSII, continuous subcutaneous insulin infusion; CV, coefficient of variation; GRI, Glycemia Risk Index; HR, heart rate; MDI, multiple daily injections; SD, standard deviation; T1D, type 1 diabetes; T1DEXI, Type 1 Diabetes Exercise Initiative; TAR, time above range; TBR, time below range; TIR, time in range.
Declaration of Conflicting Interests
The author(s) declared the following potential conflicts of interest with respect to the research, authorship, and/or publication of this article: D.P.Z. has received honoraria for speaking engagements from Ascensia Diabetes, Insulet Canada, and Medtronic Diabetes. D.P.Z also serves as a member of the DexCom Advisory Board. D.P.Z. has received research support from the Leona M. and Harry B. Helmsley Charitable Trust (G-2002-04251-2) and the ISPAD-JDRF Research Fellowship. S.V and D.M have nothing to disclose.
Funding
The author(s) received no financial support for the research, authorship, and/or publication of this article.
Supplemental Material
Supplemental material for this article is available online.
References
Supplementary Material
Please find the following supplemental material available below.
For Open Access articles published under a Creative Commons License, all supplemental material carries the same license as the article it is associated with.
For non-Open Access articles published, all supplemental material carries a non-exclusive license, and permission requests for re-use of supplemental material or any part of supplemental material shall be sent directly to the copyright owner as specified in the copyright notice associated with the article.