
Abstract
Background:
To evaluate the glycemia risk index (GRI) as a new glucometry in pediatric and adult populations with type 1 diabetes (T1D) in clinical practice.
Methods:
A cross-sectional study of 202 patients with T1D receiving intensive treatment with insulin (25.2% continuous subcutaneous insulin infusion [CSII]) and intermittent scanning (flash) glucose monitoring (isCGM). Clinical and glucometric isCGM data were collected, as well as the component of hypoglycemia (CHypo) and component of hyperglycemia (CHyper) of the GRI.
Results:
A total of 202 patients (53% males and 67.8% adults) with a mean age of 28.6 ± 15.7 years and 12.5 ± 10.9 years of T1D evolution were evaluated.
Adult patients (>19 years) presented higher glycated hemoglobin (HbA1c) (7.4 ± 1.1 vs 6.7 ± 0.6%; P < .01) and lower time in range (TIR) (55.4 ± 17.5 vs 66.5 ± 13.1%; P < .01) values than the pediatric population, with lower coefficient of variation (CV) (38.6 ± 7.2 vs 42.4 ± 8.9%; P < .05). The GRI was significantly lower in pediatric patients (48.0 ± 22.2 vs 56.8 ± 23.4; P < .05) associated with higher CHypo (7.1 ± 5.1 vs 5.0 ± 4.5; P < .01) and lower CHyper (16.8 ± 9.8 vs 26.5 ± 15.1; P < .01) than in adults.
When analyzing treatment with CSII compared with multiple doses of insulin (MDI), a nonsignificant trend to a lower GRI was observed in CSII (51.0 ± 15.3 vs 55.0 ± 25.4; P= .162), with higher levels of CHypo (6.5 ± 4.1 vs 5.4 ± 5.0; P < .01) and lower CHyper (19.6 ± 10.6 vs 24.6 ± 15.2; P < .05) compared with MDI.
Conclusions:
In pediatric patients and in those with CSII treatment, despite a better control by classical and GRI parameters, higher overall CHypo was observed than in adults and MDI, respectively. The present study supports the usefulness of the GRI as a new glucometric parameter to evaluate the global risk of hypoglycemia-hyperglycemia in both pediatric and adult patients with T1D.
Introduction
The widespread use of interstitial continuous real-time glucose monitoring (CGM) has meant a great advance in the glycemic control of patients with type 1 diabetes (T1D). Its use has facilitated the assessment of the glycemic profile because of new glycemic variables that allow the quality of glycemic control to be determined beyond classic parameters, as well as identifying key points for improvement in glycemic control. In addition, the use of CGM has been associated in several studies with better metabolic control and quality of life and the reduction in long-term complications.1 -3
The American Diabetes Association (ADA) recommends the use of the Ambulatory Glucose Profile (AGP) report, which summarizes the main results of both CGM and isCGM. 4 The AGP report contains information on the time in range (TIR) and variability of blood glucose levels below or above a given control target: time below range (TBR) and time above range (TAR), respectively. These variables are highly interdependent, which means that, when trying to improve one of them, the rest of the measures may improve or worsen, making it difficult to interpret and optimize treatments to achieve good glycemic control. 5 In addition, the simultaneous assessment of the different parameters of the AGP report and the daily CGM registry is highly time consuming. It is, therefore, necessary to obtain new parameters to allow the synthesis of existing data and to guide professionals in the management of T1D.5,6
The development of the glycemia risk index (GRI) aims to summarize the overall quality of glycemic control of a given patient in a single parameter. 5 This new parameter arises from analyzing the different scores given by 330 international T1D experts to the CGM data of 225 insulin-treated patients with diabetes, from best to worst glycemic control. The analysis showed that the clinicians’ scores depended primarily on two components: one related to the time in CHypo and the other related to time in CHyper, particularly to extreme glucose values.
These combined components allow the GRI to be calculated, which presents a high correlation (r = 0.95) with the clinicians’ glycemic score. 5 In addition, the GRI can be categorized and graphically represented by percentiles (Pc) in five zones from best (Pc: 0-20) to worst (Pc: 80-100) glycemic control. It allows key points to be identified for improvement and to monitor the effects on glycemic quality. 5
Despite the advantages of integrating this new glycemic metric into the AGP report, its recent appearance, the lack of evidence in daily clinical practice, and the absence of automatic calculation in the CGM make its widespread use difficult, and the current and future implications are unknown.
The aim of the present study was to evaluate the GRI as a new metric of glycemic control in a pediatric and adult population with T1D in clinical practice.
Material and Methods
Study Population
A cross-sectional study of a cohort of 202 patients with T1D on intensive insulin treatment (CSII or MDI) and isCGM (FreeStyle Libre, Abbott Diabetes Care, Witney, UK), under follow-up in the Pediatric Endocrinology and Endocrinology Departments at Hospital Clínico Universitario de Valladolid, Spain.
Procedures
Clinical and metabolic control data were prospectively collected. Data on the use of the system and metabolic control were evaluated through the analysis of downloaded device information. The past 14 days of isCGM prior to the patients’ visit were downloaded and analyzed, in all cases after a minimum of three months of using the device. HbA1c was also measured between seven and 10 days before the patients’ visit by turbidimetric inhibition immunoassay standardized to the National Glycohemoglobin Standardization Program (NGSP) (Roche Diagnostics, Geneva, Switzerland).
All patients with T1D and isCGM with a scheduled appointment between February 2019 and March 2019 were consecutively enrolled. Patients with inadequate use of the system (percentage of use less than 70% in past 14 consecutive days), 7 or with recent changes in their insulin regimen (insulin type or CSII initiation) or who were less than one year after the onset of T1D were excluded. None of the patients met the exclusion criteria.
Glucometric data of isCGM were defined as mean glucose (mg/dL), glucose management indicator (GMI)%, TIR (% of the time with glucose levels between 70-180 mg/dL), TAR (% of time above 180 mg/dL), TBR (% of the time below 70 mg/dL), and number of daily scans. Glycemic variability was determined through CV% and standard deviation (SD) mg/dL. Time above range and TBR were also classified as very low glycemia level <54 mg/dL (<3.0 mmol/L)—TBR<54; low glycemia level 54-70 mg/dL (3.0-3.9 mmol/L)—TBR54-70; high glycemia level 181-250 mg/dL (10.1-13.9 mmol/L)—TAR180-250; very high glycemia level >250 mg/dL (>13.9 mmol/L)—TAR>250; CHypo (TBR<54 + [0.8 × TBR54-70]); and CHyper (TAR>250 + [0.5 × TAR180-250]), as well as GRI ([3.0 × CHypo] + [1.6 × CHyper]) were calculated from isCGM data as previously described. 5 In addition, patients were classified into five areas by Pc according to their GRI from best to worst glycemic control: zone A (Pc: 0-20); zone B (Pc: 21-40); zone C (Pc: 41-60); zone D (Pc: 61-80); and zone E (Pc: 80-100).
Statistical Analysis
The results were expressed as mean ± SD. The normal distribution of the variables was analyzed with the Kolmogorov-Smirnov test. The quantitative variables with normal distribution were analyzed using a bilateral Student’s t test, and nonparametric variables were evaluated by using the Mann-Whitney U-test. Categorical variables were assessed using the chi-square test or the Fisher exact test if necessary. Comparisons between more than two groups were based on analysis of variance (ANOVA), and Bonferroni post hoc test was used to evaluate differences between groups. Those p values <.05 were considered statistically significant. The statistical 0package SPSS version 17.0 was used for the analysis (SPSS Inc., Chicago, IL, UEA). All patients signed an informed consent for their inclusion before participating in the study. The protocol was approved by the Clinical Research Ethics Committee of the Hospital Clínico Universitario de Valladolid (Spain)—PI 19-1390—and the study was conducted in accordance with the Declaration of Helsinki.
Results
The study included 202 patients with DM1, of which 65 (32.2%) were children and adolescents (≤19 years) and 137 were adults (>19 years), with 47.0% females. Overall, 25.2% were treated with CSII and 73.8% with MDI. In the whole cohort, the mean age was 28.6 ± 15.7 years, mean duration of diabetes was 12.5 ± 10.9 years, and the mean HbA1c was 7.2 ± 1.0%. Patients showed an average of 10.4 ± 5.7 scans per day and 90.9 ± 10.3% device usage time. The glucometric measures obtained were as follows: mean glucose: 163.2 ± 33.3 mg/dL, mean SD: 64.1 ± 19.0 mg/dL, mean CV: 39.8 ± 8.0%, mean TIR: 59.0 ± 17.0%, mean TBR<54: 2.0 ± 2.7%; mean TBR54-70: 4.6 ± 3.4%, mean TAR180-250: 22.0 ± 8.8%; mean TAR>250: 12.4 ± 11.8%, and GMI: 7.3 ± 1.1%.
The mean GRI was 54.0 ± 23.3 with a CHypo and CHyper of 5.7 ± 4.8 and 23.4 ± 14.3, respectively. The percentage of patients according to the GRI zone was as follows: zone A: 9.9%; zone B: 19.8%; zone C: 31.2%; zone D: 24.7%; and zone E: 14.4% (Figure 1).
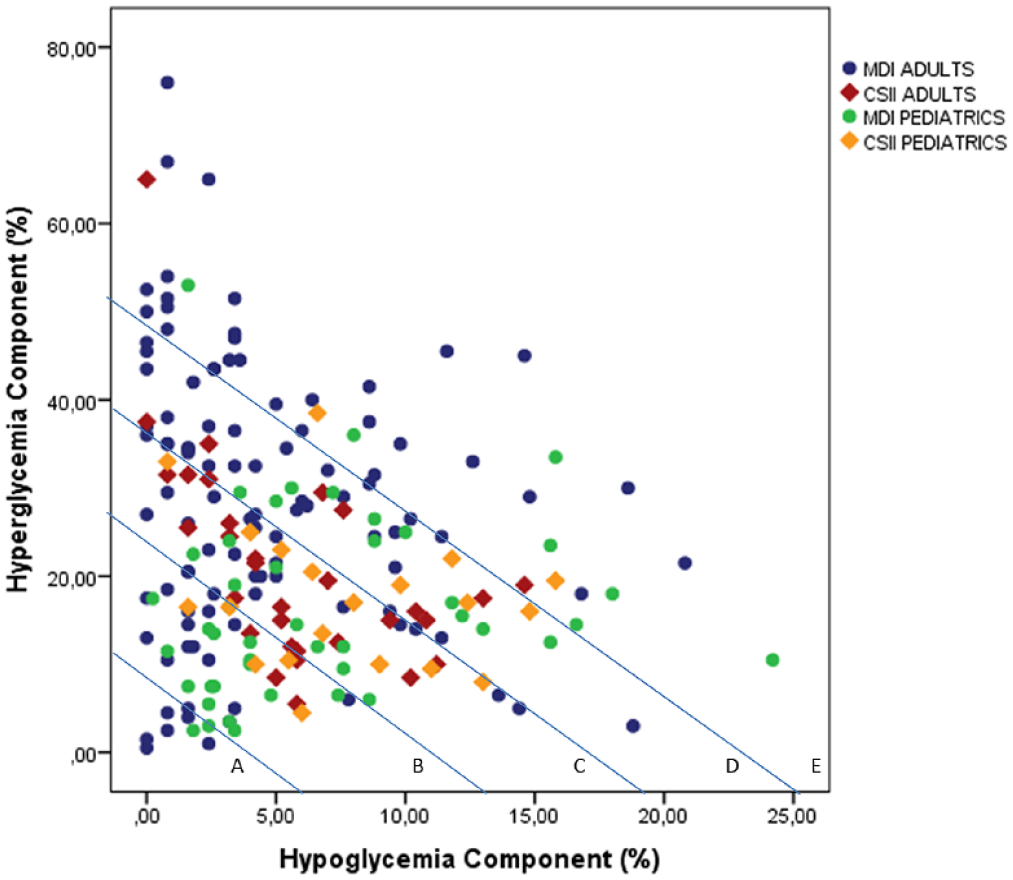
Glycemia risk index with hyperglycemia and hypoglycemia components and GRI zones in pediatrics and adult cohorts.
When comparing the results obtained between pediatric and adult patients, those older than 19 years presented higher HbA1c values (7.4 ± 1.1 versus 6.7 ± 0.6%; P < .01) and lower TIR (55.4 ± 17.5 vs 66.5 ± 13.1%; P < .01) and CV (38.6 ± 7.2 vs 42.4 ± 8.9%; P < .01) than the pediatric population. The GRI was also significantly lower in pediatric patients (48.0 ± 22.2 vs 56.8 ± 23.4; P = .011) because of a lower CHyper (16.8 ± 9.8 vs 26.5 ± 15.1; P < .01) and despite a higher CHypo (7.1 ± 5.1 vs 5.0 ± 4.5; P < .01) than in adults (Table 1). Regarding GRI zone distribution, the percentage of patients in zones A and B was significantly higher in the pediatric population (43.0% vs 23.3%; P < .05) (Figure 2).
Clinical, Metabolic Features and Glycemic Metric in Adult and Pediatric Patients With DM1.
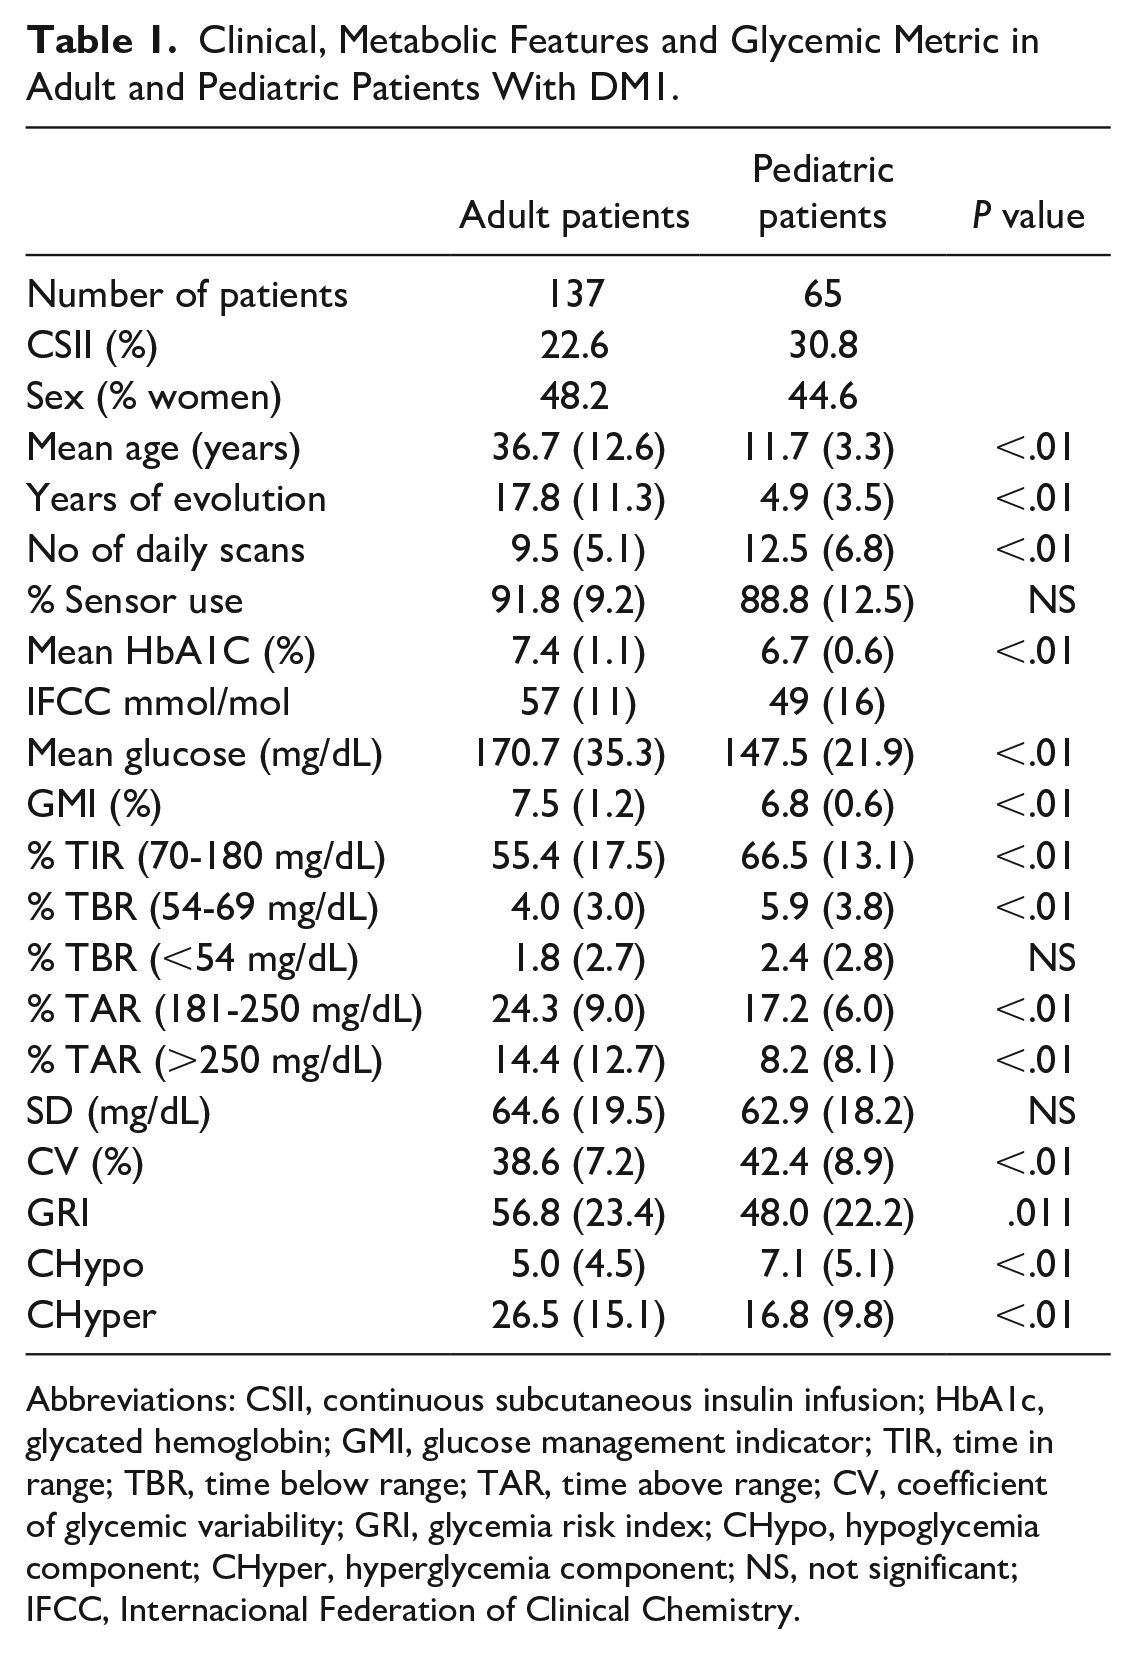
Abbreviations: CSII, continuous subcutaneous insulin infusion; HbA1c, glycated hemoglobin; GMI, glucose management indicator; TIR, time in range; TBR, time below range; TAR, time above range; CV, coefficient of glycemic variability; GRI, glycemia risk index; CHypo, hypoglycemia component; CHyper, hyperglycemia component; NS, not significant; IFCC, Internacional Federation of Clinical Chemistry.
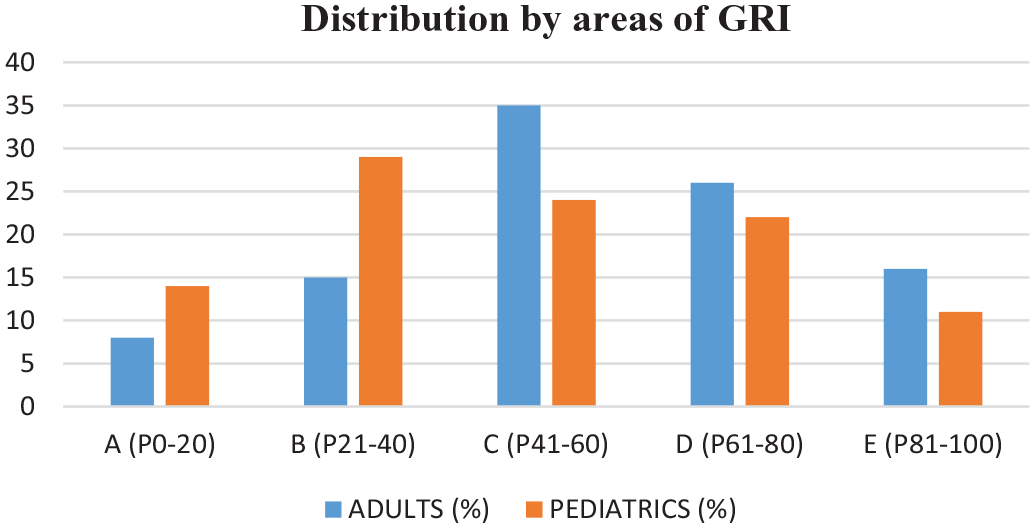
Distribution by areas of GRI in adult and pediatric patients with DM1.
When comparing treatment with CSII to MDI, there was a nonsignificant trend toward a lower GRI in CSII (51.0 ± 15.3 vs 55.0 ± 25.4; P = .162), with higher levels of CHypo (6.5 ± 4.1 vs 5.4 ± 5.0; P < .01) and lower levels of CHyper (19.6 ± 10.6 vs 24.6 ± 15.2; P = .042) than in MDI (Table 2).
Clinical, Metabolic Features and Glycemic Metric in T1D Patients Under Treatment With CSII or MDI.
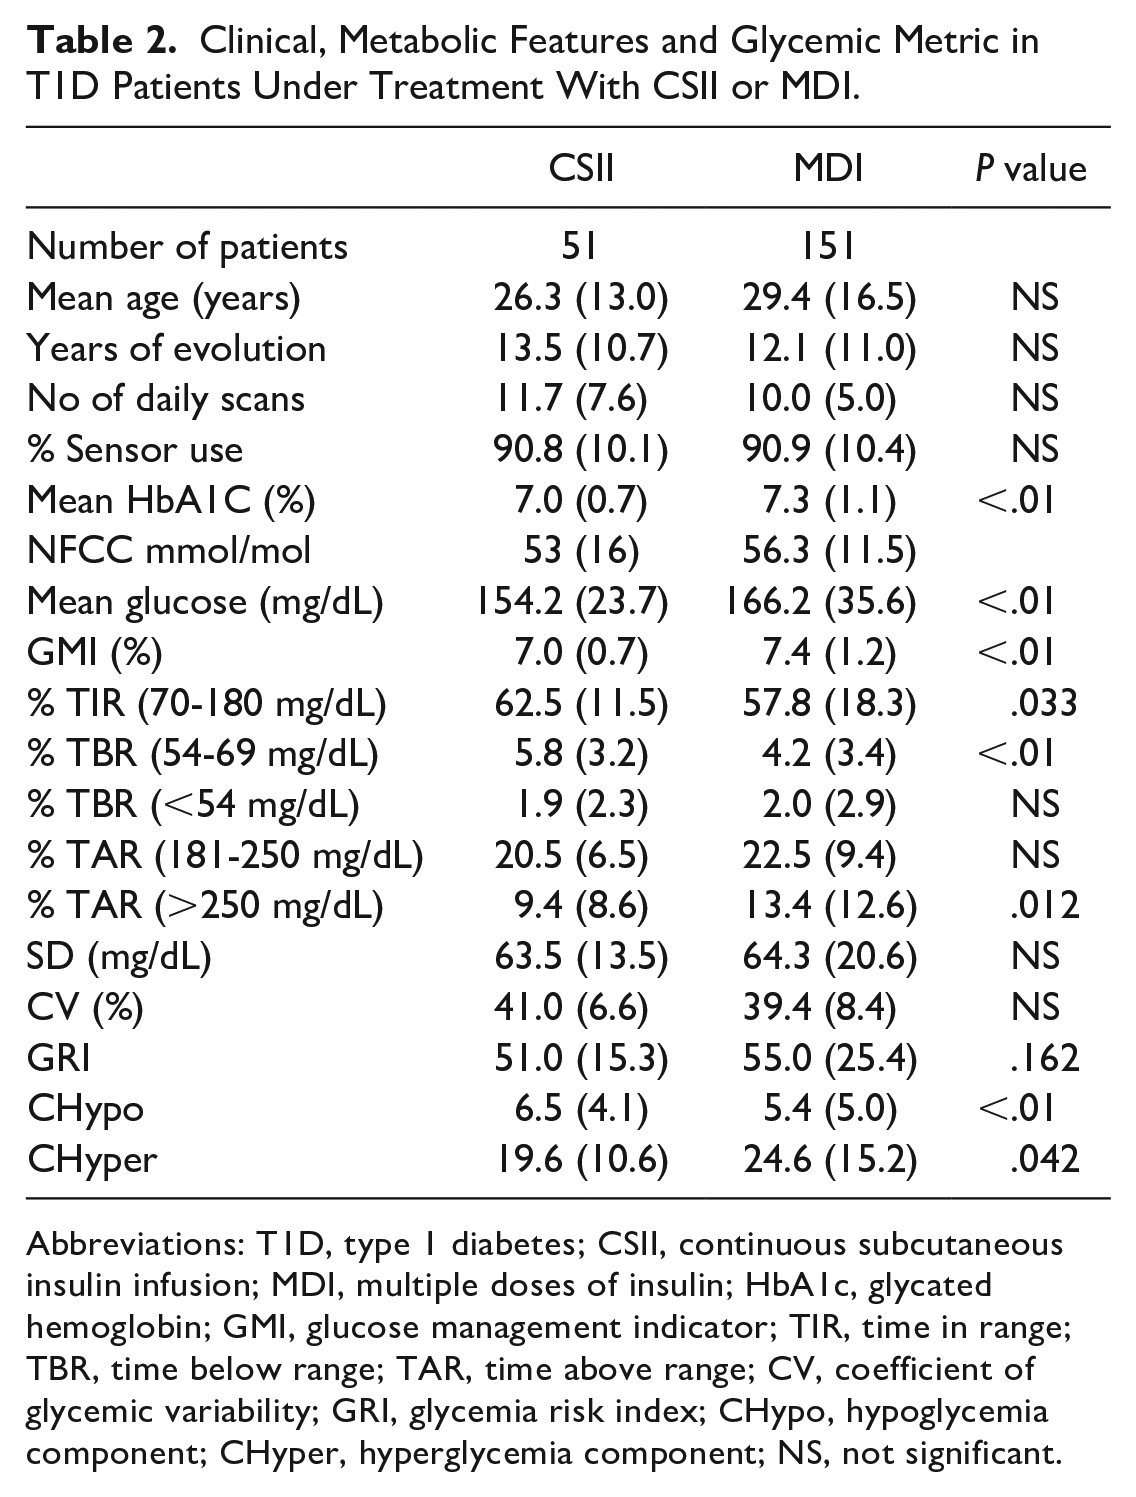
Abbreviations: T1D, type 1 diabetes; CSII, continuous subcutaneous insulin infusion; MDI, multiple doses of insulin; HbA1c, glycated hemoglobin; GMI, glucose management indicator; TIR, time in range; TBR, time below range; TAR, time above range; CV, coefficient of glycemic variability; GRI, glycemia risk index; CHypo, hypoglycemia component; CHyper, hyperglycemia component; NS, not significant.
When evaluating the results according to the type of treatment (CSII or MDI) in adult and pediatric patients separately, a higher HbA1c was observed in adult patients with MDI (7.6 ± 1.1%), as well as a higher GMI (7.6 ± 1.3%), TAR180-250 (24.9 ± 9.5%), TAR>250 (15.7 ± 13.3%) and a lower TIR (53.8 ± 18.4%) and TBR54-70 (3.6 ± 2.9%) (Table 3). Regarding GRI assessment, adults with MDI had a higher GRI (58.6 ± 25.1%) than the other subgroups (adults CSII: 50.7 ± 15.0%, pediatric CSII: 51.3 ± 16.2%, and pediatric MDI: 46.6 ± 24.5%; P = .023) with a significantly lower CHypo (4.8 ± 4.7%) and a higher CHyper (28.1 ± 15.6%) (Table 3). The percentage of patients with worse GRI zones (D and E) was significantly higher in the adult MDI treatment group (Table 3).
Clinical, Metabolic Features and Glycemic Metric in Adult and Pediatric T1D Patients Under Treatment With CSII or MDI.
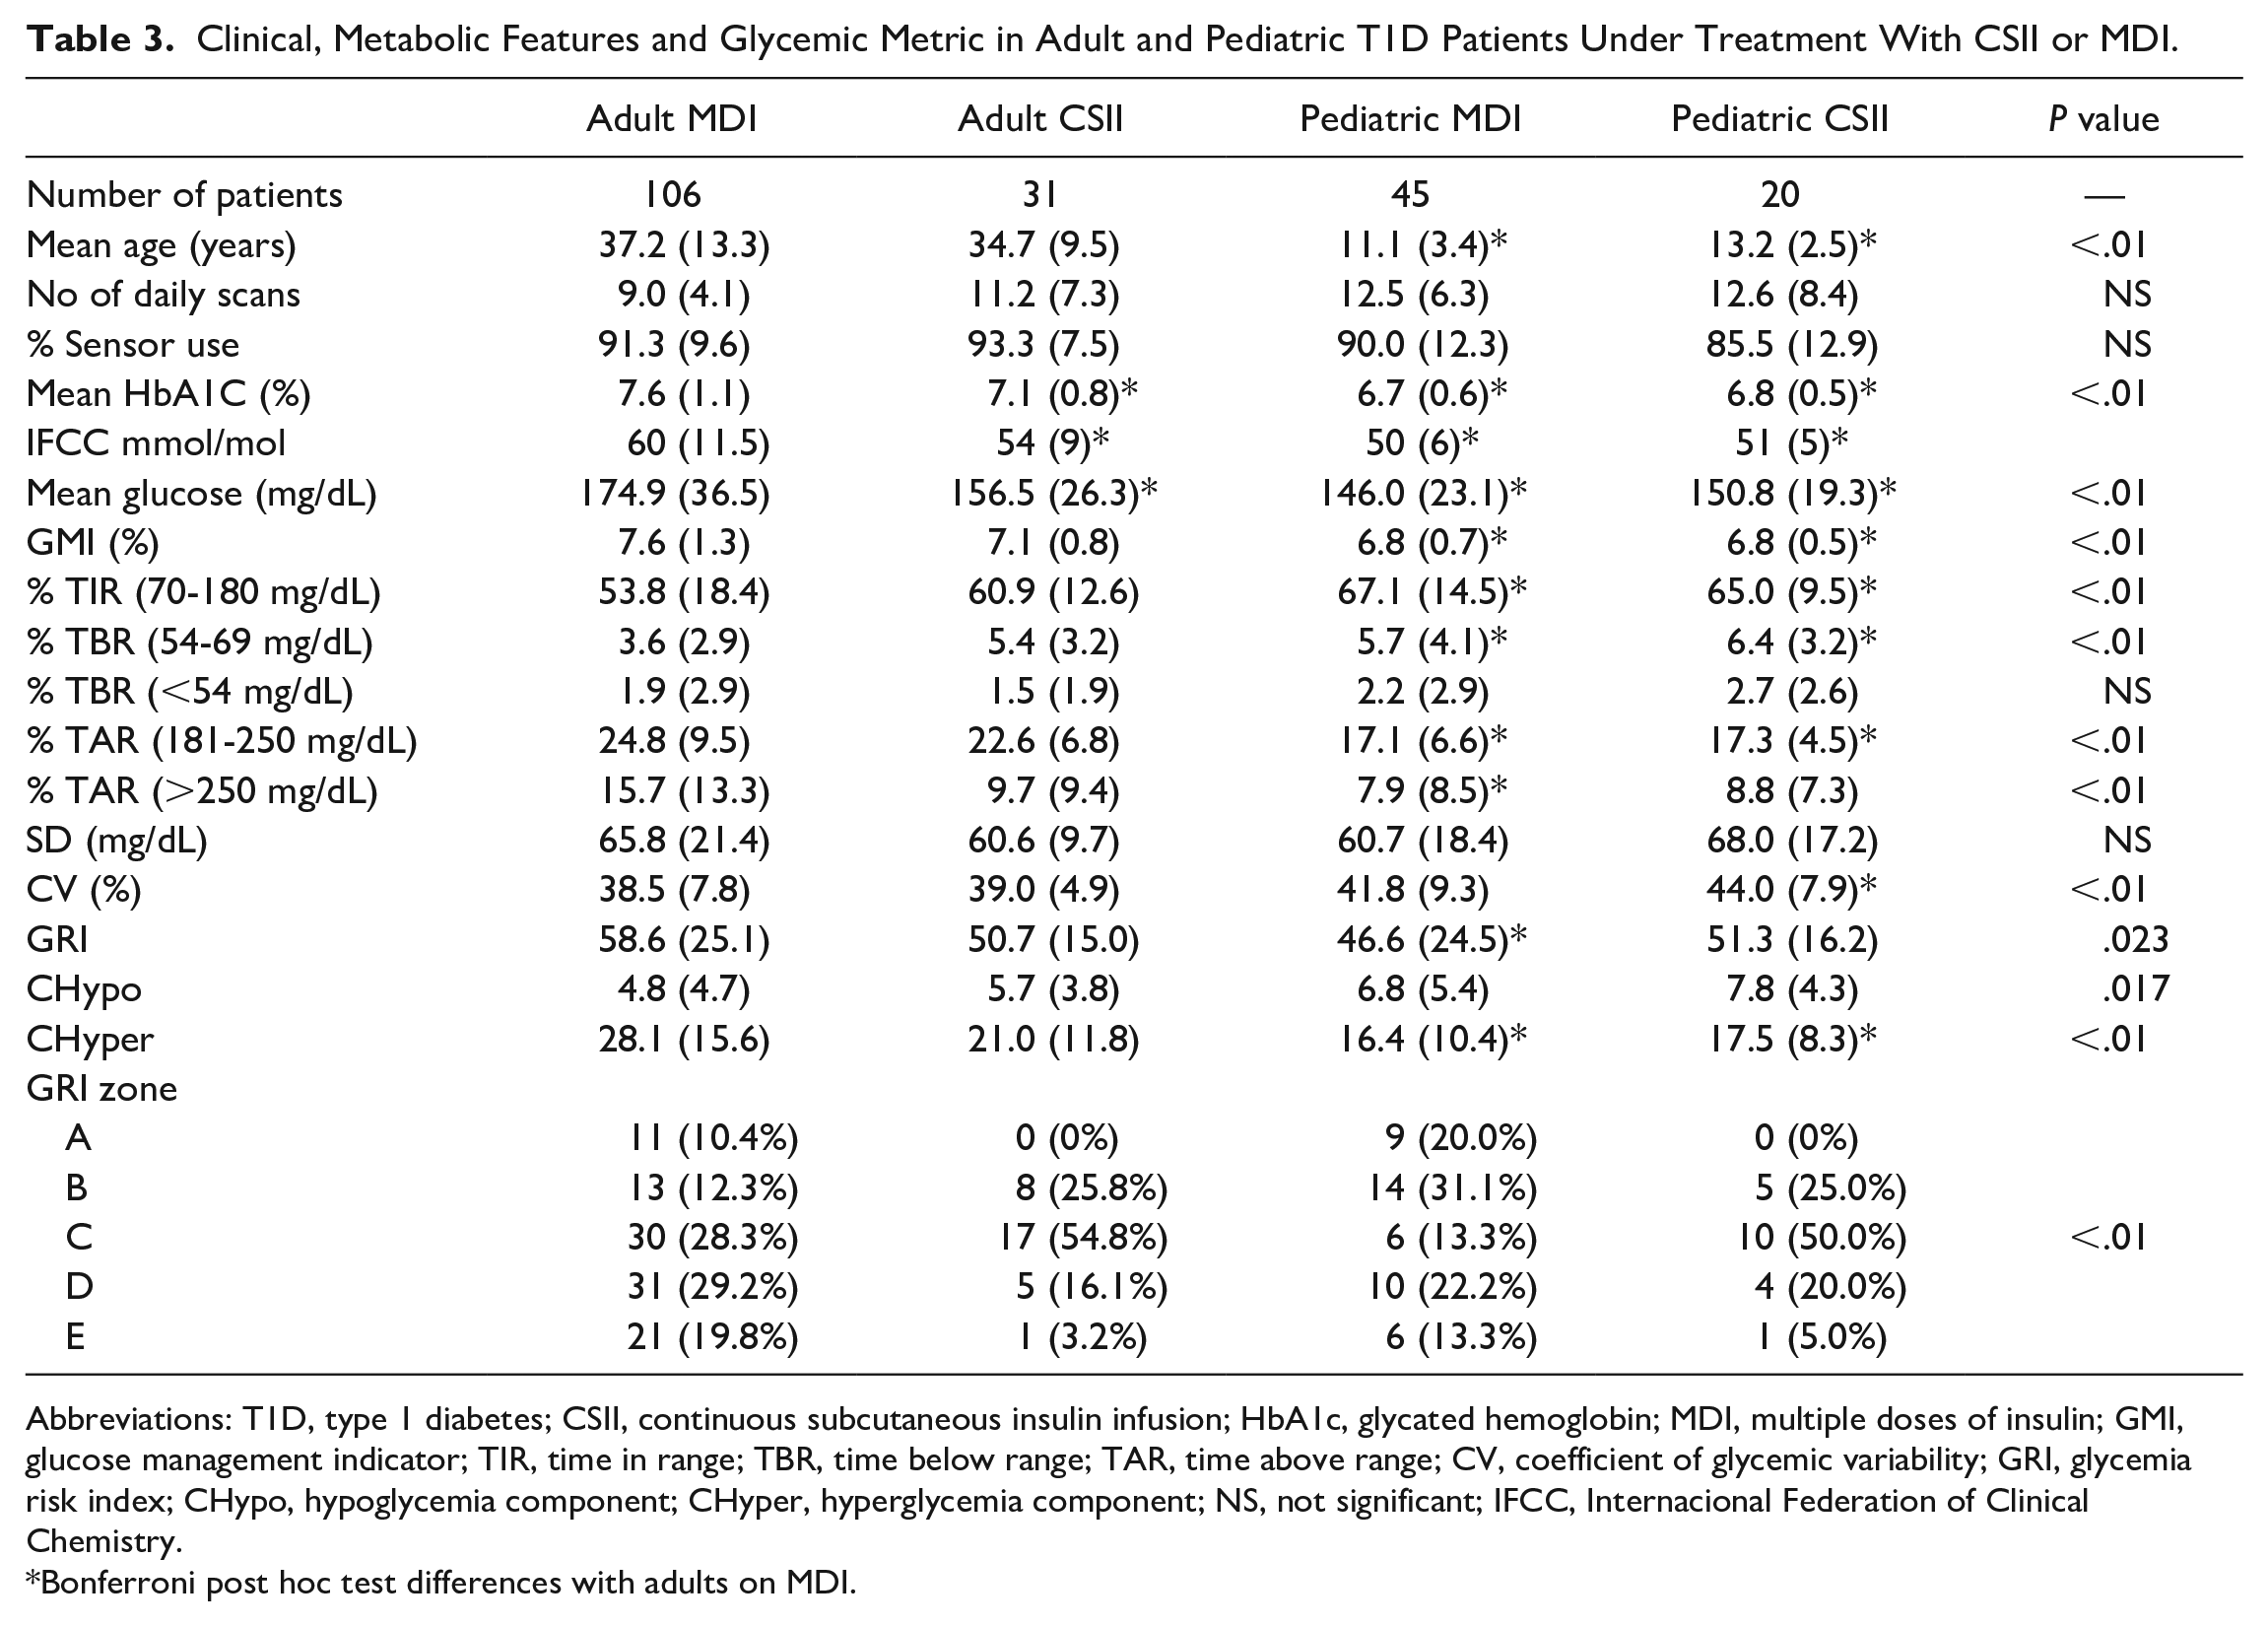
Abbreviations: T1D, type 1 diabetes; CSII, continuous subcutaneous insulin infusion; HbA1c, glycated hemoglobin; MDI, multiple doses of insulin; GMI, glucose management indicator; TIR, time in range; TBR, time below range; TAR, time above range; CV, coefficient of glycemic variability; GRI, glycemia risk index; CHypo, hypoglycemia component; CHyper, hyperglycemia component; NS, not significant; IFCC, Internacional Federation of Clinical Chemistry.
Bonferroni post hoc test differences with adults on MDI.
Discussion
Widespread adoption of CGM has been an advance in the assessment and quantification of glycemic control in T1D patients. In fact, the evaluation of CGM data based on AGP has been clearly supported by international guidelines.8,9 However, its interpretation is not free of difficulties when it comes to assessing those changes to improve metabolic control in clinical practice. Although the International TIR Consensus 9 simplified the number of variables necessary for the interpretation of the AGP to seven (VLow, Low, TIR, High, VHigh, Mean glucose, and CV) compared with previous guidelines, 7 all of these variables are highly interdependent 10 and their interpretation is time consuming and should be performed simultaneously with the analysis of daily glycemic patterns. This interdependence complicates the global analysis of metabolic control because of the challenge in simultaneously improving different glucometric variables. 5 From a practical point of view, an increase in TIR requires a reduction in TBR and/or TAR without increasing TAR or TBR, respectively; it cannot be virtually addressed without a reduction in glycemic variability (CV, SD). 11 Although TIR has been recently claimed to be an essential variable in metabolic control and has been related to the development of long-term complications, 12 its uses do not have enough sensitivity in the hypoglycemic range or in extreme glucose values and it only enables the evaluation of glycemic centrality independent of glycemic variability.6,10
In this context, GRI arises as a global interpretation variable of the metabolic control of a given patient. Glycemia risk index allows the simultaneous and weighted assessment of two essential components of metabolic control such as TBR and TAR (and, therefore, indirectly in relation to TIR), giving greater weight to TBR and specifically to the extreme glycemic values. Although there have been attempts to use other composite scores, these do not adequately reflect both hypoglycemia and hyperglycemia nor provide greater weighting for extreme glycemia values simultaneously. What is more, GRI provides clinicians a single number accounting for the principal dimensions of glycemic control and also a graphical representation.13,14
The present study is, to our knowledge, the first to evaluate GRI in real clinical practice in both pediatric and adult populations treated with MDI or CSII with isCGM. To date, the published results correspond exclusively to the original article that described GRI as an alternative glucometric using data collected from some clinical trials in adults with Dexcom G4 and G6 CGM systems (Dexcom Inc San Diego, CA, USA). Therefore, there is no evidence on the consistency of the results in clinical practice setting, neither in isCGM nor in pediatric populations.
The results of the present study are consistent with those published previously, 15 both in the pediatric population and in those treated with CSII. 16 From a general point of view, pediatric patients show better metabolic control in terms of HbA1c, mean glycemia, TIR, and TAR but worse TBR54-70 and greater glycemic variability. This greater CHypo and its greater weight in the GRI calculation could lead to the prediction of a worse overall glycemic control. However, the results in our cohort demonstrate a better GRI in this subgroup (Table 1). Likewise, treatment with CSII was related to a better degree of metabolic control by HbA1c, mean glycemia, and TAR, but associated with a worse TBR54-70. Besides, the GRI assessment showed a tendency to present better values in patients with CSII due to a lower CHyper and despite a higher CHypo (Table 2).
In both cases, the better GRI score in pediatric patients and in those with CSII compared with adults or MDI treatment show that the greater CHypo has a lower final relative weight than the CHyper despite being more weighted in the GRI calculation. However, the difference between adult and pediatric patients was greater when evaluating TIR (11.1%) than GRI (8.8%). This lower difference between groups in terms of GRI can be explained by the low sensitivity of TIR to TBR (thus, CHypo) and the higher weight of TBR in GRI calculation.5,11
The analysis of pediatric and adult patients according to the type of treatment supports the latter statement. Adult patients on MDI treatment showed the worst TIR and GRI, the lowest TBR54-70 and the higher TAR180-250 and TAR>250 with the lowest CV. However, the pediatric subgroup with CSII treatment showed a TIR and GRI of 65.0(9.5)% and 51.3(16.2)%, respectively, with the highest TBR57-70 and TBR<54, and a low TAR180-250 and TAR>250 with the highest glycemic variability evaluated by CV. Thus, the pediatric group with CSII showed the highest CHypo and one of the lowest CHyper, and the adult group on MDI treatment showed opposite results (lowest CHypo and highest CHyper). Despite the higher individual weight of CHypo in the GRI calculation, the worst GRI level was observed in the adult MDI patients subgroup because of the higher value of TAR180-250 and TAR>250 (thus, CHyper). Moreover, those subgroups with the higher glycemic variability observed in the present study were directly associated with the higher TBR, despite better values of TIR. This relationship between TBR and CV has been previously described, as well as the low sensitivity of TIR to TBR.11,17 In addition, the indication of CSII in those patients with higher level of hypoglycemia and/or glycemic variability could explain the higher CHypo in the pediatric CSII subgroup.
Our results are congruent both when the distribution is assessed individually (Figure 1) or in pediatric and adult population on CSII or MDI treatment in the different GRI Pc (Figure 2 and Table 3). In both cases, a consistent distribution is observed in pediatric patients and those with CSII. These subpopulations show a greater CHypo but a better degree of overall control by GRI. This point is particularly important as the same GRI value can be related to a different component of hypo- and hyperglycemia depending on the patient (Figure 1 and Table 3).
Finally, our results are similar to those evaluated by Klonoff et al in the initial publication that show a GRI = 43% in the CSII subgroup, with CHyper and CHypo of 21% and 3%, respectively, compared with a slightly higher GRI (51.3% vs 50.7%) and lower CHyper (17.5% and 21.0%) but higher CHypo (7.8% and 5.7%) in our pediatric and adults CSII population, respectively. 5 However, their results in patients with T1D and MDI were poorer (GRI = 78; CHyper = 36.8%; CHypo = 5.5%) than those found in our real clinical practice cohort which show better GRI (46.6% and 58.6%), lower CHyper (16.4% and 28.1%), and similar CHypo (6.8% and 4.8%) in the pediatric and adult MDI population, respectively. Furthermore, the CV was lower in T1D CSII patients for Klonoff et al (CV = 34%) compared with our results in pediatric (CV = 44%) and adult CSII patients (39%). This higher glycemic variability could partially explain higher rates of TBR and CHypo in our CSII cohort.11,17 However, the CV was similar in T1D MDI patients published by Klonoff et al (CV = 41%) compared with our results in pediatric and adult MDI patients (41.8% and 38.5%), respectively.
There are certain limitations to be taken into account for this type of study: The relatively small sample size compared with large data studies (although with complete knowledge of clinical variables and under a single isCGM system) and its observational design, among others. However, it is important to highlight that the present results are in line with those published in the pediatric population with T1D and isCGM in both MDI and CSII treatments. 15 These results have not been described to date, and they support the use of GRI also in this subgroup of patients. More studies are needed to evaluate other subpopulations (type 2 diabetes in treatment with isCGM among others), as well as the relationship of GRI with the development of long-term complications or quality of life. Finally, some studies have shown higher TBR in FreeStyle Libre isCGM users; 18 this could increase CHypo in our investigation. However, the use of the same isCGM model and version throughout the study in all patients ensures the representativeness of our results.
In conclusion, the present results support the usefulness of the GRI as a new glycemic meter to evaluate the global risk of hypoglycemia-hyperglycemia in pediatric and adult population in both CSII and MDI treatments. Glycemia risk index enabled numerically and graphically integration of the global metabolic control. In pediatric patients and in those with CSII treatment, despite a better control by classical and GRI parameters, higher overall CHypo was observed.
Footnotes
Abbreviations
GRI, glycemia risk index; T1D, type 1 diabetes; CSII, continuous subcutaneous insulin infusion; isCGM, intermittent scanning (flash) glucose monitoring; CHypo, component of hypoglycemia; CHyper, component of hyperglycemia; HbA1c, glycated hemoglobin; TIR, Time in range (70-180 mg/dL); CV, coefficient of variation; MDI, multiple doses of insulin; CGM, real-time glucose monitoring; ADA, American Diabetes Association; AGP, Ambulatory Glucose Profile; TBR, time below range (<70 mg/dL); TAR, time above range (>180 mg/dL); Pc, percentiles; NGSP, National Glycohemoglobin Standardization Program; GMI, Glucose Management Indicator; SD, standard deviation; TBR<54, time below range lower than <54 mg/dL; TBR54-70, time bellow range between 54 and 70 mg/dL; TAR180-250, time above range between 181 and 250 mg/dL; TAR>250, time above range more than 250 mg/dL; ANOVA, analysis of variance.
Declaration of Conflicting Interests
The author(s) declared no potential conflicts of interest with respect to the research, authorship, and/or publication of this article.
Funding
The author(s) received no financial support for the research, authorship, and/or publication of this article.