
Abstract
Background:
Glycemia risk index (GRI) is a novel composite metric assessing overall glycemic risk, accounting for both hypoglycemia and hyperglycemia and weighted toward extremes. Data assessing GRI as an outcome measure in closed-loop studies and its relation with conventional key continuous glucose monitoring (CGM) metrics are limited.
Methods:
A post hoc analysis was performed to evaluate the sensitivity of GRI in assessing glycemic quality in adults with type 1 diabetes randomized to 26 weeks hybrid closed-loop (HCL) or manual insulin delivery (control). The primary outcome was GRI comparing HCL with control. Comparisons were made with changes in other CGM metrics including time in range (TIR), time above range (TAR), time below range (TBR), and glycemic variability (standard deviation [SD] and coefficient of variation [CV]).
Results:
GRI with HCL (N = 61) compared with control (N = 59) was significantly lower (mean [SD] 33.5 [11.7] vs 56.1 [14.4], respectively; mean difference −22.8 [−27.2, −18.3], P = .001). The mean increase in TIR was +14.8 (11.0, 18.5)%. GRI negatively correlated with TIR for combined arms (r = −.954; P = .001), and positively with TAR >250 mg/dL (r = .901; P = .001), TBR < 54 mg/dL (r = .416; P = .001), and glycemic variability (SD [r = .916] and CV [r = .732]; P = .001 for both).
Conclusions:
Twenty-six weeks of HCL improved GRI, in addition to other CGM metrics, compared with standard insulin therapy. The improvement in GRI was proportionally greater than the change in TIR, and GRI correlated with all CGM metrics. We suggest that GRI may be an appropriate primary outcome for closed-loop trials.
Keywords
Introduction
Glycemia risk index (GRI) is a novel composite continuous glucose monitoring (CGM) metric providing a holistic assessment of glycemic risk. It is reported as a single number, a percentile, from 0 (lowest risk) to 100 (highest risk), weighted for time spent in hypoglycemia and hyperglycemia, more so the extreme ranges. It also correlates better with clinician rankings of risk compared with other CGM metrics. 1
International consensus guidelines for the standardized reporting of CGM metrics focus on key metrics, encompassing time in range (TIR), time in hypoglycemia and hyperglycemia, mean glucose and glycemic variability.2,3 Closed-loop (CL) studies have typically focused on TIR as their main outcome measure to assess the effectiveness of the intervention. However, while TIR correlates well with hyperglycemia, it does so poorly with hypoglycemia and does not weight extremes of low and high glucose levels.4,5 Therefore, use of TIR alone as a metric may underestimate risk exposure in people with type 1 diabetes.
There is little published literature with GRI as an outcome measure and correlating GRI with other CGM metrics. Kim et al 6 showed that GRI is strongly correlated with TIR and better reflected hypoglycemia than use of TIR alone. Time below range (TBR), expressed as an integer percentage, also has shortcomings as an outcome measure. It does not account for hypoglycemia frequency or duration, and does not differentiate severity of hypoglycemia. 7 As GRI adds weight to glucose values <54 mg/dL compared with <70 mg/dL, it may therefore be a more sensitive indicator for improvement in hypoglycemia than TBR. Furthermore, it is well-known that the measurement of glycated hemoglobin (HbA1c) does not provide a measure of hypoglycemia or glycemic variability. 8
We previously published outcomes from a randomized controlled parallel-arm study comparing 61 adults with type 1 diabetes on multiple daily injections (MDI) and 59 adults on insulin pump therapy (IPT) without CGM use. 9 They were randomized to a first-generation hybrid closed-loop (HCL) system, the Medtronic MiniMed 670G (Medtronic, Northridge, CA), or continuation of usual care. Our results demonstrated that all CGM metrics were significantly improved following HCL use. The primary endpoint of the study focused on benefits in glucose control, ie, TIR, which showed a significant increment in TIR of 15% using HCL compared with control. There were no differences observed in benefits for those on MDI and IPT at baseline. While TBR and time above range (TAR) were significantly lower with use of HCL, the absolute differences in time in the very low (<54 mg/dL) and very high (>250 mg/dL) glycemic range were more modest (−0.6% and −2.9%, respectively) which may lead to clinicians underestimating the importance of these clinically relevant outcomes.
Studies evaluating GRI as an outcome measure and its correlation with CGM metrics in CL studies are limited. The aim of this post hoc analysis was to assess GRI as an outcome measure, relative to other key CGM metrics, such as TIR, TBR and TAR, in adults with type 1 diabetes randomized to a HCL system or manual insulin delivery over a 26-week period. We hypothesized that HCL use would result in substantial risk reduction as assessed by GRI and that this CGM metric will provide a more holistic assessment of risk reduction than does TIR. In addition, the magnitude of benefits offered by HCL insulin delivery as assessed by GRI will be greater than that of TIR or TBR alone.
Methods
This post hoc analysis was based on an open-label, randomized, controlled, parallel-group clinical trial involving 120 participants across seven Australian tertiary hospitals, comparing 26 weeks of HCL therapy with standard diabetes therapy (MDI or IPT without CGM) with the main outcomes previously published. 9 The trial protocol was approved by a central Human Research Ethics Committee (St Vincent’s Hospital Melbourne) and registered with the Australian New Zealand Clinical Trials Registry (ACTRN12617000520336).
Study Protocol
The protocol of the main study has been previously published. 10 In brief, adults (25-70 years of age) with an established diagnosis of type 1 diabetes managed with MDI or IPT in conjunction with self-monitoring of blood glucose (SMBG) were eligible for participation. Full eligibility criteria are provided in the protocol paper. All participants received standardized diabetes education during run-in. They were then randomized 1:1 to intervention (HCL group) or continuation of standard therapy (control group) for a 26-week period. The HCL group used the MiniMed™ 670G HCL system (Medtronic, Northridge, CA), utilizing a glucose target of 120 mg/dL. The control group continued using their own insulin delivery system (MDI or IPT without CGM), in conjunction with a bolus dose calculator (Accu-Chek Aviva Expert, Roche Diagnostics, Mannheim, Germany). The trial involved 16 study visits, including run-in and intervention periods. All participants wore masked CGM (Guardian Sensor 3, Medtronic) to collect study outcome measurements at three time points: baseline pre-randomization (for 3 weeks), mid-study (for 2 weeks), and study-end (for 3 weeks).
Outcome Measures
The main outcome of this post hoc analysis was to evaluate GRI after 26-weeks of HCL use compared with manual insulin delivery, with adjustment for baseline GRI. Glycemia risk index was calculated according to the formula: (3.0 × VLow) + (2.4 × Low) + (1.6 × VHigh) + (0.8 × High), whereby VLow = <54 mg/dL, Low = 54-70 mg/dL, VHigh = >250 mg/dL, High = 180-250 mg/dL. 1 GRI values are assigned to five grid zones: Zone A (0-20), Zone B (21-40), Zone C (41-60), Zone D (61-80), and Zone E (81-100). Secondary outcomes included correlation of GRI with other CGM metrics including TIR, TBR1 (54-70 mg/dL), and TBR2 (<54 mg/dL), TAR1 (180-250 mg/dL), and TAR2 (>250 mg/dL), mean glucose, standard deviation (SD), and coefficient of variation (CV); subgroup analyses by baseline insulin delivery modality; and by presence or absence of impaired awareness of hypoglycemia (IAH).
Statistical Analysis
Data from all randomized participants were analyzed on an intention-to-treat basis. The main study outcome was analyzed using analysis of covariance (ANCOVA) with adjustment for baseline GRI. Results are expressed as mean difference between intervention and control (minus sign denotes that intervention has lower values compared with control) with 95% confidence intervals and P values. Pearson’s correlation coefficient was used to quantify the correlation between GRI and each of the other key CGM metrics. Subgroup analyses were undertaken according to baseline insulin delivery modality (MDI vs IPT) and presence or absence of IAH using an interaction term between the study arm and subgroup. All analyses were performed using Stata 17.
Results
Baseline Characteristics of Study Participants
A total of 120 participants were randomized to the HCL group (n = 61) or the control group (n = 59). Baseline characteristics of the HCL and control groups were balanced (refer to Table 1 in the main study paper 9 ). 53% of the participants were women; ages ranged from 25 to 70 years; and duration of diabetes from 1 to 59 years. Insulin pump therapy was used at baseline by 59 participants (49%).
Comparison of CGM Metrics at Baseline and Study-End for HCL Group versus Control Group.
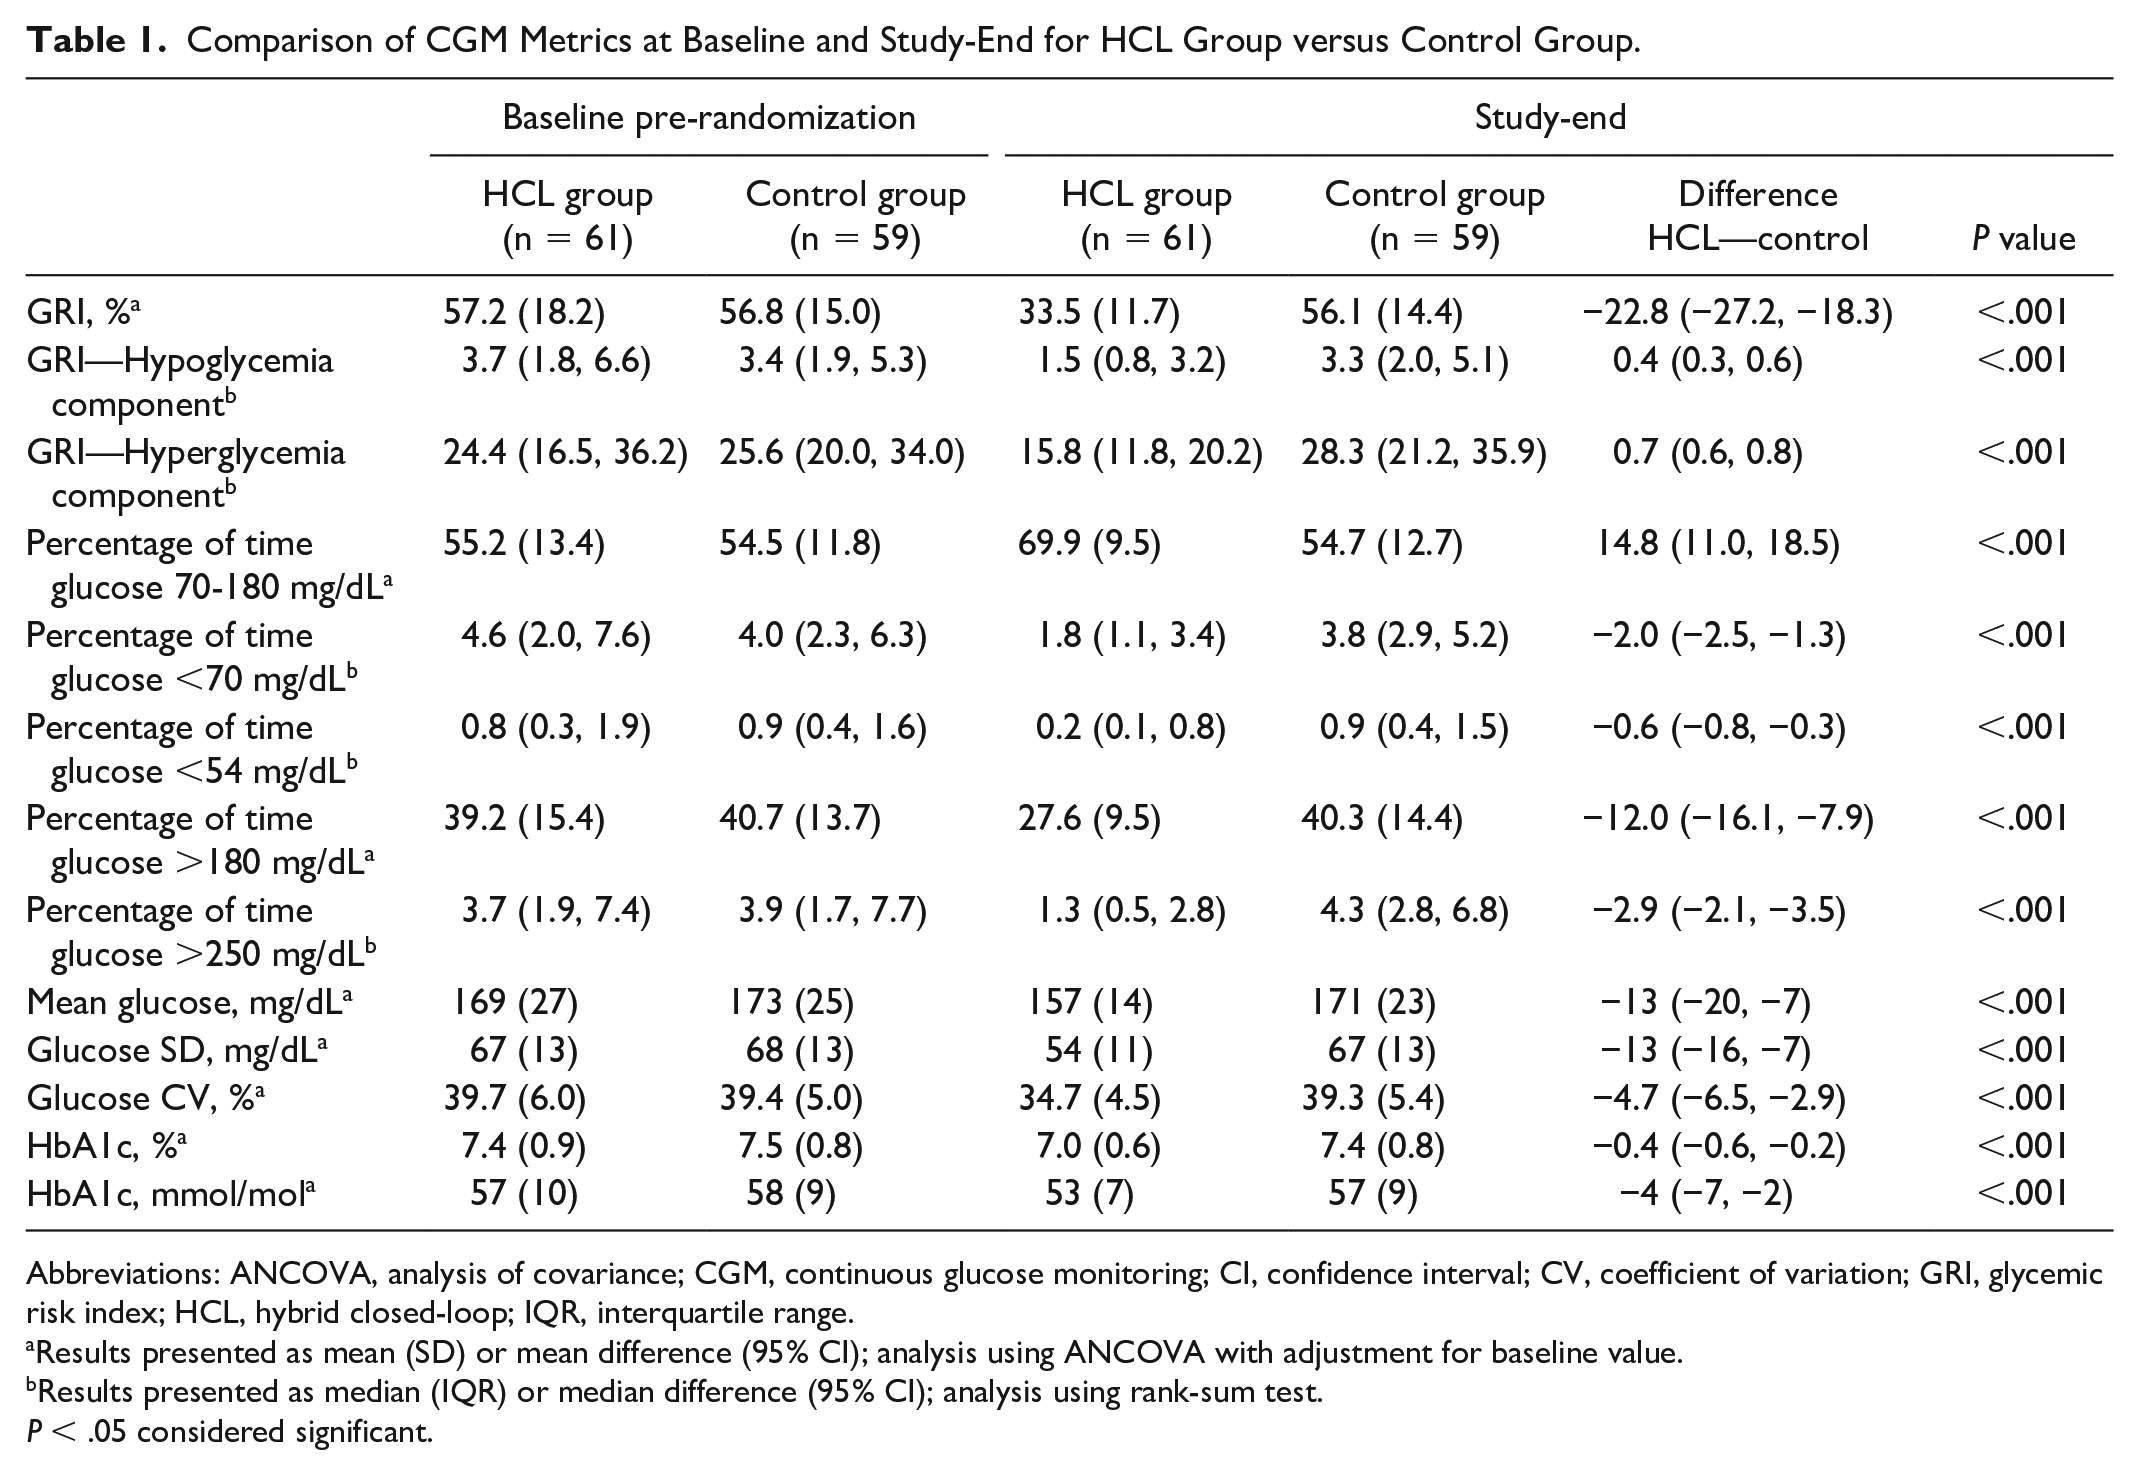
Abbreviations: ANCOVA, analysis of covariance; CGM, continuous glucose monitoring; CI, confidence interval; CV, coefficient of variation; GRI, glycemic risk index; HCL, hybrid closed-loop; IQR, interquartile range.
Results presented as mean (SD) or mean difference (95% CI); analysis using ANCOVA with adjustment for baseline value.
Results presented as median (IQR) or median difference (95% CI); analysis using rank-sum test.
P < .05 considered significant.
GRI
Baseline GRI between HCL and control groups were comparable (mean [SD] 57.2 [18.2] vs 56.8 [15.0], respectively) (Table 1). Zone C (GRI 41-60) was the most common for both groups at baseline (Figure 1). At study-end, mean GRI for the HCL group was significantly lower compared with that of the control group (33.5 [SD 11.7] vs 56.1 [SD 14.4] respectively; mean difference −22.8 [95% CI −27.2, −18.3], P = .001) (Table 1). The reduction in GRI was contributed by significant improvements in both hyperglycemic and hypoglycemic components (both P = .001). A greater improvement in the hypoglycemic component within the HCL group was observed with a between-arm relative difference of 58% in hypoglycemia component compared with a 35% relative difference in hyperglycemia component. At study end, participants randomized to the HCL group were predominantly in Zone B (GRI 21-40), compared with those randomized to the control group who were largely located in Zone C and D of the grid (GRI 41-80) at study-end (Figure 1).
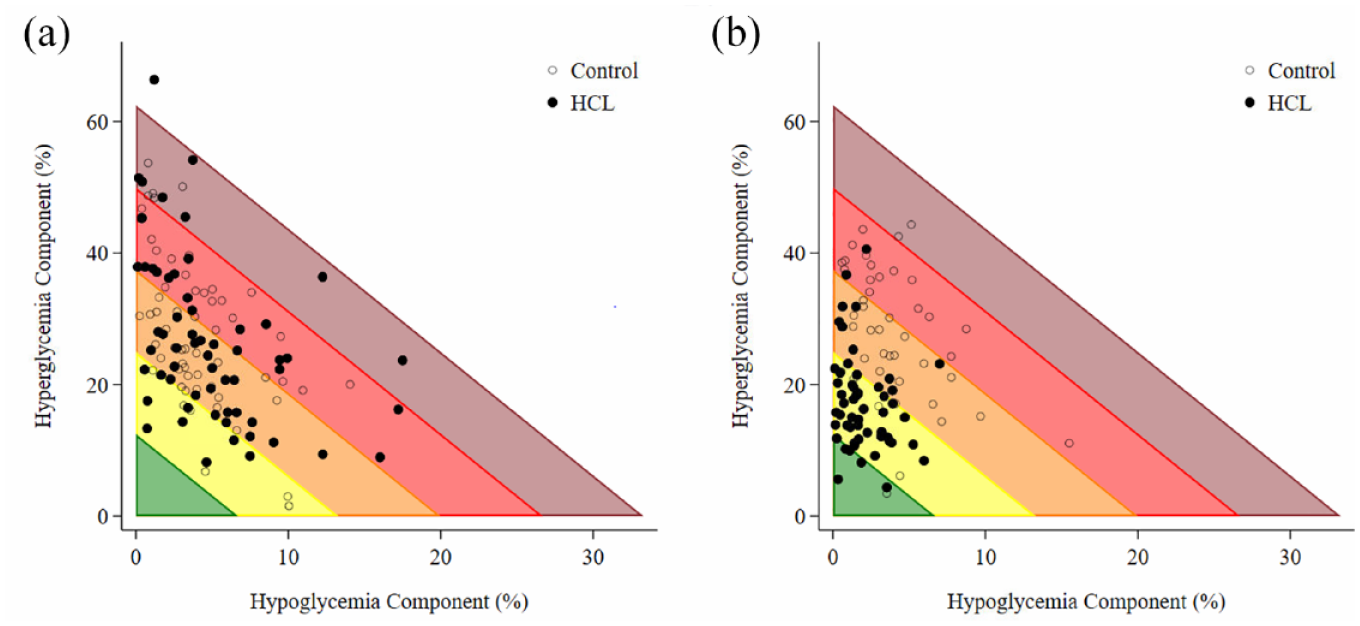
A glycemic risk index grid showing the hyperglycemia component vs the hypoglycemia component according to treatment group at (a) baseline and (b) study-end.
The intervention effect was apparent at 3 months (mid-study) with a significant difference in GRI in favor of HCL therapy (mean difference −20.3 [95% CI −25.3, −15.2], P = .001) compared with standard therapy.
This parallels the improvement observed with HCL use with all other key CGM metrics including increased TIR; reduced TBR, TAR, mean glucose, SD and CV; and lower HbA1c compared with standard therapy at both 3 and 6 months (Table 1).
Correlation Between GRI and Other CGM Metrics
The GRI was strongly negatively correlated with TIR (r = −.954; P = .001) for the overall combined group. A positive correlation was found between GRI and TAR, stronger for TAR2 (r = .901; P = .001) compared with TAR1 (r = .646; P = .001). A weak correlation was found between GRI and TBR1 (r = .288; P = .004) and moderate correlation with TBR2 (r = .416; P = .001). A positive correlation was found between GRI and HbA1c (r = .600; P = .001); mean glucose (r = .812; P = .001); SD (r = .916; P = .001); and CV% (r = .732; P ≤ .001). Separate correlations between GRI and key CGM metrics, by study arm, are shown in Figure 2.
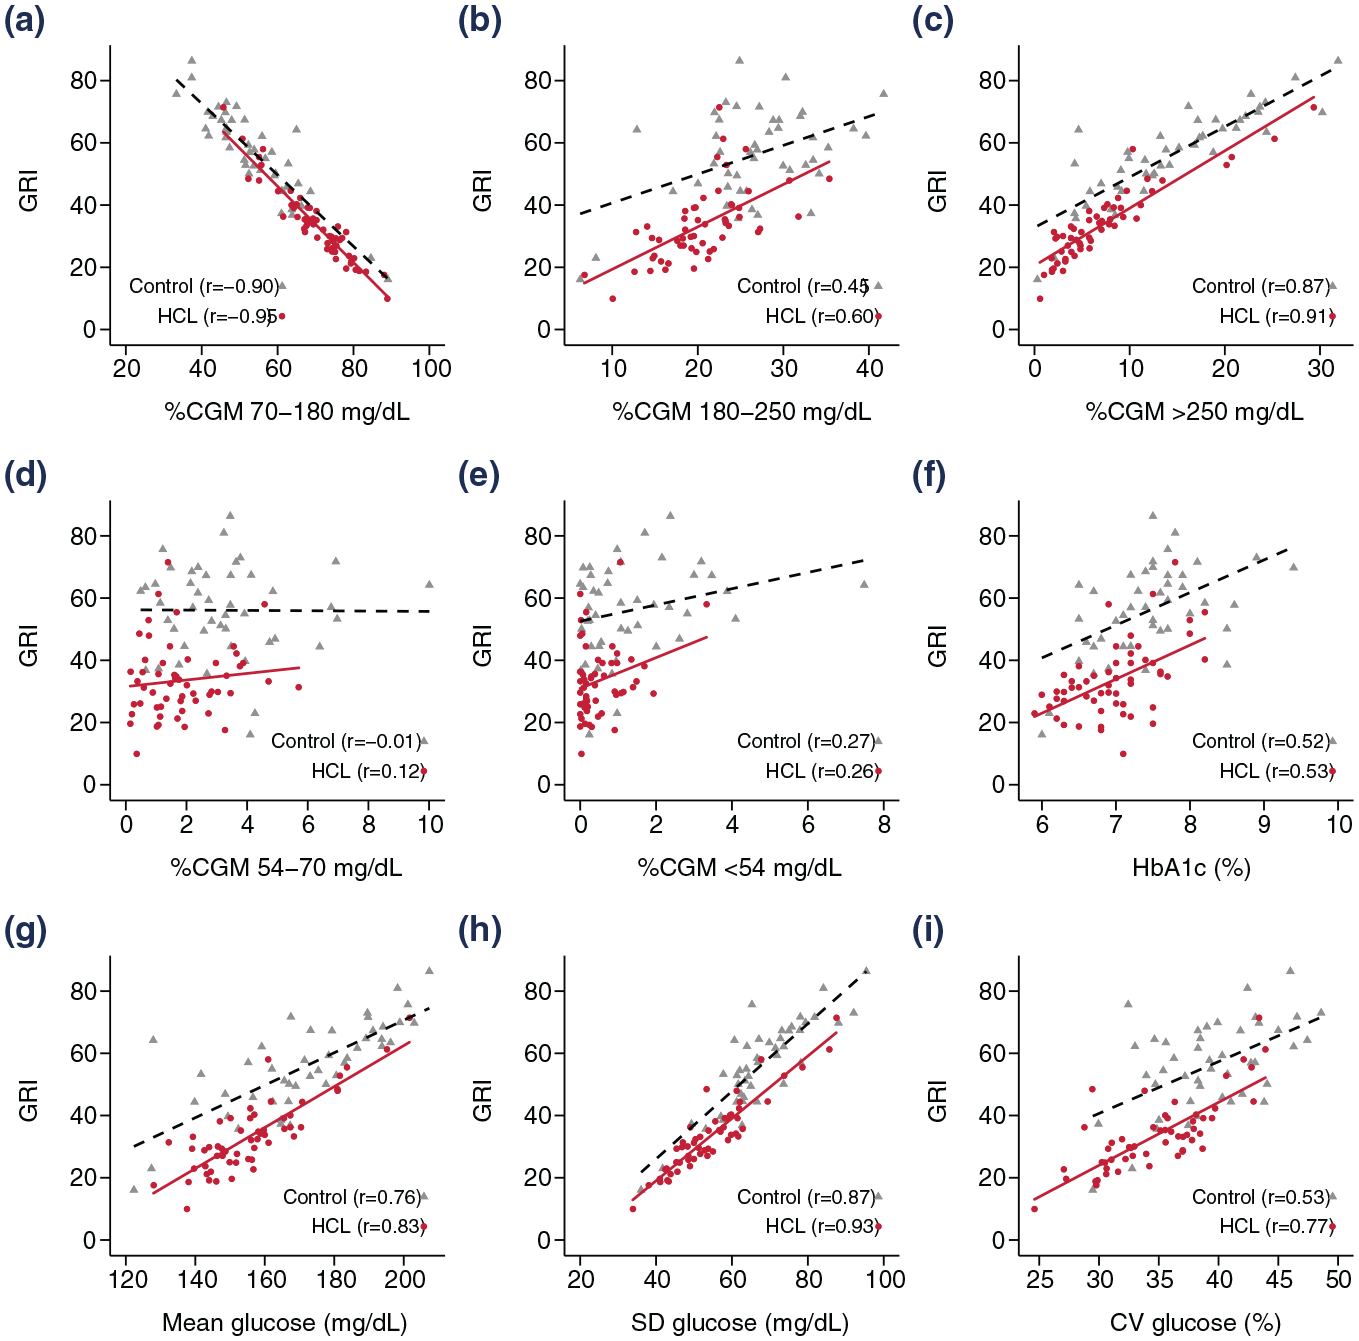
Correlation between GRI and key CGM metrics, by treatment group, using Pearson’s correlation coefficient. (a) CGM 70-180mg/dL. (b) CGM 180-250mg/dL. (c) CGM >250mg/dL. (d) CGM 54-70mg/dL. (e) CGM <54mg/dL. (f) HbA1c (%). (g) Mean glucose (mg/dL). (h) SD glucose (mg/dL). (i) CV glucose (%). Solid red line represents HCL group; dashed black line represents control group.
Subgroup Analyses
Baseline insulin delivery modality did not impact the effect of the HCL intervention (P = .53). The GRI improved significantly, similar in both baseline MDI and IPT users, following HCL use compared with the control group (baseline MDI: 34.6 [12.8] vs 57.2 [15.6]; IPT: 32.4 [10.7] vs 55.1 [13.5] respectively).
Similarly, the presence (Gold score ≥4 [n = 39]) or absence of IAH (Gold score <4 [n = 81]) at baseline did not impact the effect of HCL intervention (mean difference −27.1 [−35.0, −10.2] vs −20.6 [−26.2, −15.1] respectively, P = .20). GRI also improved significantly following HCL use compared with the control group (baseline IAH: 30.2 [8.3] vs 61.9 [10.8]; non-IAH: 35.4 [13.0] vs 53.4 [15.3], respectively).
Discussion
This post hoc analysis demonstrated in adults with type 1 diabetes that use of HCL insulin delivery compared with manually determined insulin dosing significantly improved GRI, in addition to all other key CGM metrics. Our study results add to the limited available literature supporting the usefulness of GRI as an additional CGM metric which assesses changes in glycemic risk with HCL use in adults with type 1 diabetes.
Our findings demonstrated that GRI was strongly inversely correlated with TIR, similar to that shown in other studies.6,11,12 In contrast to TIR, GRI is able to account for both time spent in hypoglycemia and hyperglycemia, with greater weighting to hypoglycemia and the more extreme spectrums of glycemia. It therefore provides a more comprehensive assessment of glycemic risk compared with TIR, which while strongly associated with hyperglycemia, underestimates hypoglycemia and the extremes in glucose excursions where clinical risk is greatest. The proportional magnitude of improvement in GRI at study-end following HCL use compared with manual insulin delivery was greater than the change in TIR (41% vs 22%), in keeping with the observations by Benhamou et al. 13
Similarly, GRI correlated with other important CGM metrics including TAR, TBR, glycemic variability using both CV and SD, mean glucose and HbA1c. Therefore, our results validate GRI as a comprehensive assessment of glycemic risk given its correlation with both essential metric clusters identified by Montaser et al, 4 quantifying exposure to hyperglycemia (treatment efficacy) which encompasses TAR and mean glucose; and risk for hypoglycemia (treatment safety) incorporating TBR and CV.
Whilst GRI correlated strongly with TAR, it did not correlate as well with TBR. This may be explained by the low percentage of time spent in hypoglycemia with most of the TBR glucose observations falling between 54 and 70 mg/dL while GRI adds weight to measurements <54 mg/dL. In our study, it is interesting that the greater reduction in GRI following 6 months of HCL use compared with the control group was contributed predominantly by the larger improvement in the hypoglycemic component than the hyperglycemic component, suggesting that the main benefit was in reducing the risk of hypoglycemia.
A limitation of GRI as a composite metric is that it does not include a direct measure of glycemic variability in its calculation unlike other composite metrics such as the Comprehensive Glucose Pentagon (CGP) 14 and Q-score. 15 However, we do not think that this is a major drawback to use of GRI given the strong correlation between CV, a measure of glycemic variability, and TBR.5,16 Advantages of the GRI calculation is that it is simple to calculate, is derived from consensus opinions of highly experienced clinicians, and weights extremes of both hypo- and hyperglycemia which may make it more relevant for use in the clinical setting.
Whether baseline insulin delivery modality was MDI or IPT, there was no difference in GRI outcomes. Baseline GRI in both MDI and IPT users were similar, and the improvement in GRI following 6-months of HCL use was no different between groups. These findings parallel the findings from our original study demonstrating equivalent outcomes supporting benefits of HCL regardless of prior exposure to IPT. 9
The presence of IAH (Gold score ≥4) resulted in larger differences in GRI favoring HCL use at study-end compared with the differences seen in those without IAH, albeit did not reach statistical significance. To our knowledge, there are no studies evaluating GRI in those with IAH however it may prove to be an important CGM metric to consider assessing in this subgroup given the greater weighting toward hypoglycemia. While Benhamou et al 13 showed that GRI improved by 13.2% from open-loop to closed-loop control in a group of patients with excessive time in hypoglycemia (≥5% time spent <70 mg/dL), patients with IAH based on Gold score ≥4 were excluded from their study.
The applicability of GRI in the clinical setting has not been established given that it is a relatively new concept. A recent update on the international consensus statement for CGM metrics for clinical trials suggested the addition of GRI to endpoint measures in clinical trials. 3 Our study findings would support this and our recommendation for the consensus clinical target would be to aim for GRI ≤40 in the general population with type 1 diabetes. We anticipate that GRI will become a commonly used glucometric parameter to express glycemic risk in future studies, and further evaluation of the association between GRI and diabetes-related complications will be important.
Limitations of this analysis include the moderate sample size, and that it was performed in a single country. Nevertheless, given the substantial body of literature available in support of glucose outcomes with HCL therapy, one would expect that the observations described would be applicable across national boundaries as the relationships between GRI and other CGM metrics described in this analysis build upon an established body of literature. Also, the association between GRI and risk of developing long-term diabetes-related complications remains to be fully explored in people with type 1 diabetes though early studies have demonstrated that GRI correlated with the risk of microvascular complications of albuminuria and diabetic retinopathy in patients with type 2 diabetes.17,18
Conclusions
In conclusion, use of HCL therapy over a 6-month period demonstrated significant improvements in GRI, in addition to other CGM metrics, compared with standard insulin therapy. Improvement in GRI was greater than the improvement observed in TIR. GRI provided a comprehensive assessment of overall glycemic risk profile, correlating well with all CGM metrics. Our findings support the inclusion of GRI in addition to the current panel of CGM metrics for international consensus recommendations as outcome measures for clinical trials, aiming for GRI ≤40 in people with type 1 diabetes.
Footnotes
Abbreviations
CGM, continuous glucose monitoring; CL, closed-loop; CV, coefficient of variation; GRI, glycemia risk index; HCL, hybrid closed-loop; IAH, impaired awareness of hypoglycemia; IPT, insulin pump therapy; MDI, multiple daily injections; SD, standard deviation; SMBG, self-monitoring of blood glucose; TAR, time above range; TBR, time below range; TIR, time in range.
Declaration of Conflicting Interests
The author(s) declared the following potential conflicts of interest with respect to the research, authorship, and/or publication of this article: MHL has received speaker honoraria from Medtronic. DNO. has served on advisory boards for Abbott Laboratories, Medtronic, Merck Sharp & Dohme, Novo Nordisk, Roche, and Sanofi; received research support from Medtronic, Novo Nordisk, Roche, Eli Lilly and Company, and Sanofi; and received travel support from Novo Nordisk and Merck Sharp & Dohme. SV and TWJ have nothing to disclose.
Funding
The author(s) disclosed receipt of the following financial support for the research, authorship, and/or publication of this article: The original trial was funded by JDRF Australian Type 1 Diabetes Clinical Research Network (3-SRA-2016-351-M-B), a special initiative of the Australian Research Council, and the National Health and Medical Research Council of Australia (APP1099379). In-kind support was provided by Medtronic for devices and Roche Diabetes Care for blood glucose meters.