
Abstract
Introduction:
Finding a goal of time in range (%TIR) that defines good glycemic control is necessary. Previous retrospective studies suggest good concordance between HbA1c ≤7% with a TIR >70%; however, the studies that included the largest number of patients used blood glucose measurement data with a follow-up time of less than 90 days. This study defined the TIR value that best discriminates HbA1c ≤7%.
Methods:
We performed a prospective study of diagnostic tests based on a cohort of patients with type 1 diabetes (T1D) treated with a hybrid closed loop (HCL) followed for three months. The ability of %TIR to distinguish patients with HbA1c ≤7% was evaluated through receiver operating characteristic curve analysis. We determined the %TIR cutoff point with the best operating characteristics.
Results:
A total of 118 patients were included (58.1% women, 47% overweight or obese, and 33% with high glycemic variability). A moderate negative correlation (R = −.54, P < .001) was found between %TIR and HbA1c. The discrimination ability was moderate, with an area under the curve of 0.7485 (95% confidence interval = 0.6608-0.8363). The cutoff point that best predicted HbA1c ≤7% was %TIR ≥75.5 (sensitivity 70%, specificity 67%). The findings were similar among those with a coefficient of variation (CV%) ≥36%.
Conclusions:
Our data suggest that the %TIR adequately identifies patients with HbA1c ≤7%. A target of TIR ≥75%, rather than the currently recommended TIR ≥70%, may be a more suitable value for optimal glycemic control.
Introduction
Achieving glycemic control goals in patients with diabetes is associated with a reduction in cardiovascular events and microvascular complications, as has been demonstrated in both patients with type 1 diabetes (T1D), in studies such as DCCT (Diabetes Control and Complications Trial) and EDIC (Epidemiology of Diabetes Interventions and Complications),1-3 and in patients with type 2 diabetes (T2D), in studies such as the UKPDS, ADVANCE, Veterans Affairs Diabetes Trial, and ACCORD; systematic reviews, such as that of Hemmingsen et al of Cochrane in 2013, support this statement.4-10 In addition, glycemic control reduces healthcare costs.11,12
Glycosylated hemoglobin (HbA1c) is a metric that has been used in clinical studies to demonstrate the benefits of good glycemic control. 13 However, it has several limitations, as it does not reflect rapid daily changes, the frequency of hypoglycemic events, or glycemic variability.14,15 In addition, its precision change across different physiological and pathological conditions such as anemia, hemoglobinopathies, iron deficiency, uremia, and pregnancy; therefore, it is necessary to consider alternatives for measuring glycemic control.16-19
With the advancement of diabetes management technology, we now have continuous glucose monitoring (CGM), which allows the measurement of variables that are associated with adequate metabolic control, such as time in range (TIR), which is the percentage of time that glucose measurements are within a preset range.20-22 The TIR has been described as a glycemic control metric that provides more actionable information than HbA1c alone, 23 as it allows us to understand glycemic behavior over the short and long terms, and does not depend on values or alterations in hemoglobin. There is evidence of an association between TIR and microvascular outcomes,24,25 as well as major adverse cardiovascular events (MACE) and all-cause mortality.26,27 A recent study proposed that two metrics of times in various ranges of glycemia, which they called “hypo profile” and “hyper profile,” had higher odds of prevalent diabetic disease, and also the “hypo profile” had higher odds of peripheral diabetic retinopathy compared with TIR. 28 A post hoc analysis that evaluated the association between TIR and time to the first major cardiovascular event described the inverse association between TIR and cardiovascular mortality in patients with T2D. 26 These findings support TIR as a long-term surrogate marker of adverse outcomes with possible utility in clinical management.
Previous studies have suggested good concordance between an HbA1c value of ≤7% and a TIR >70%. However, these are retrospective studies in which there was no exclusion of pathologies which may have interfered with the precision of HbA1c. The follow-up time was also less than two to three months, which is the time period in which changes in glycemic control are reflected in HbA1c.24,25,29-31 The present study prospectively evaluated the TIR value that reflects good metabolic control and compared it with HbA1c in a cohort of patients with diabetes who use CGM in real time during a three-month follow-up period.
Materials and Methods
A prospective study of diagnostic tests was carried out based on a cohort of patients with T1D older than 18 years treated with a hybrid closed loop (HCL; MiniMed 670G insulin pump; Medtronic, Northridge, California) at Hospital Universitario San Ignacio in Bogotá, Colombia. Recruitment was performed between October 2019 and October 2021, inclusive. Patients with hemoglobin <10 mg/dL, self-reported hemoglobinopathies, initial glomerular filtration rate ≤30 mL/min/1.73 m2, 32 kidney transplants, pregnancy, active cancer, steroid use, or hospitalization during the time of the study were excluded. This study was approved by the Ethics Committee of the Hospital Universitario San Ignacio and Pontificia Universidad Javeriana.
At the first visit, clinical, demographic, and baseline laboratory data were obtained, and an initial download of CGM data was performed using a virtual platform (CareLink Pro version 4.0 C; Medtronic MiniMed, Inc., Northridge, California). During the second visit, carried out three months after the first, 90-day CGM data glucose management index (GMI), TIR, time between 180 and 250 mg/dL and time above range 250 mg/dL, time below range (TBR) < 54 mg/dL, time between 54 and 70 mg/dL, and CV% information were all downloaded and a sample for HbA1c was taken. All samples were processed in a single laboratory using the same measurement method (high-performance liquid chromatography). All patients used the Guardian Sensor 3 (Medtronic). Subjects who did not meet the requirements for the optimal use of the sensor (sensor use <70% and <3 calibrations/day) were excluded from the analysis to guarantee the accuracy of the CGM data. High variability was defined as a CV greater than or equal to 36% and a hypoglycemic episode rate as the number of episodes of <54 mg/dL per day of follow-up.
The Spearman correlation coefficient was used to determine the correlation between HbA1c and TIR as the data did not have a normal distribution. For the purposes of the study, HbA1c ≤7% was used as the reference standard and the TIR percentage was used as the test to be evaluated. Using receiver operating characteristic (ROC) curves, the discrimination ability of the test was determined using the area under the curve (AUC). Using the Liu 33 method, the cutoff point of the TIR with the best sensitivity and specificity was established to identify adequate glycemic control (defined by us as HbA1c ≤7%). In addition, an exploratory exercise was performed to evaluate which HbA1c value corresponded to a TIR of 70%. Finally, a sensitivity analysis was performed to evaluate whether the conclusions were maintained according to glycemic variability, TBR <54 mg/dL, or in high-risk patients defined as any of the following (older than 65 years, with established heart disease or nephropathy). All analyses were performed using the statistical program STATA (Stata Statistical Software: Release 16, College Station, Texas; StataCorp LLC).
Results
The baseline characteristics of the 118 patients are shown in Table 1. Of these, 58.1% were women, and 47% were overweight or obese. Diabetic retinopathy was present in 26.5%, diabetic nephropathy in 16%, and diabetic nephropathy in 16% as well. Patients at baseline constituted 33.6% of the total; those with HbA1c ≤7% were 33.6% of the whole as well. Of all patients, 33% met the criteria for high glycemic variability (CV% ≥36%) and 31% had clinically significant hypoglycemic episodes.
Demographic and Clinical Characteristics.
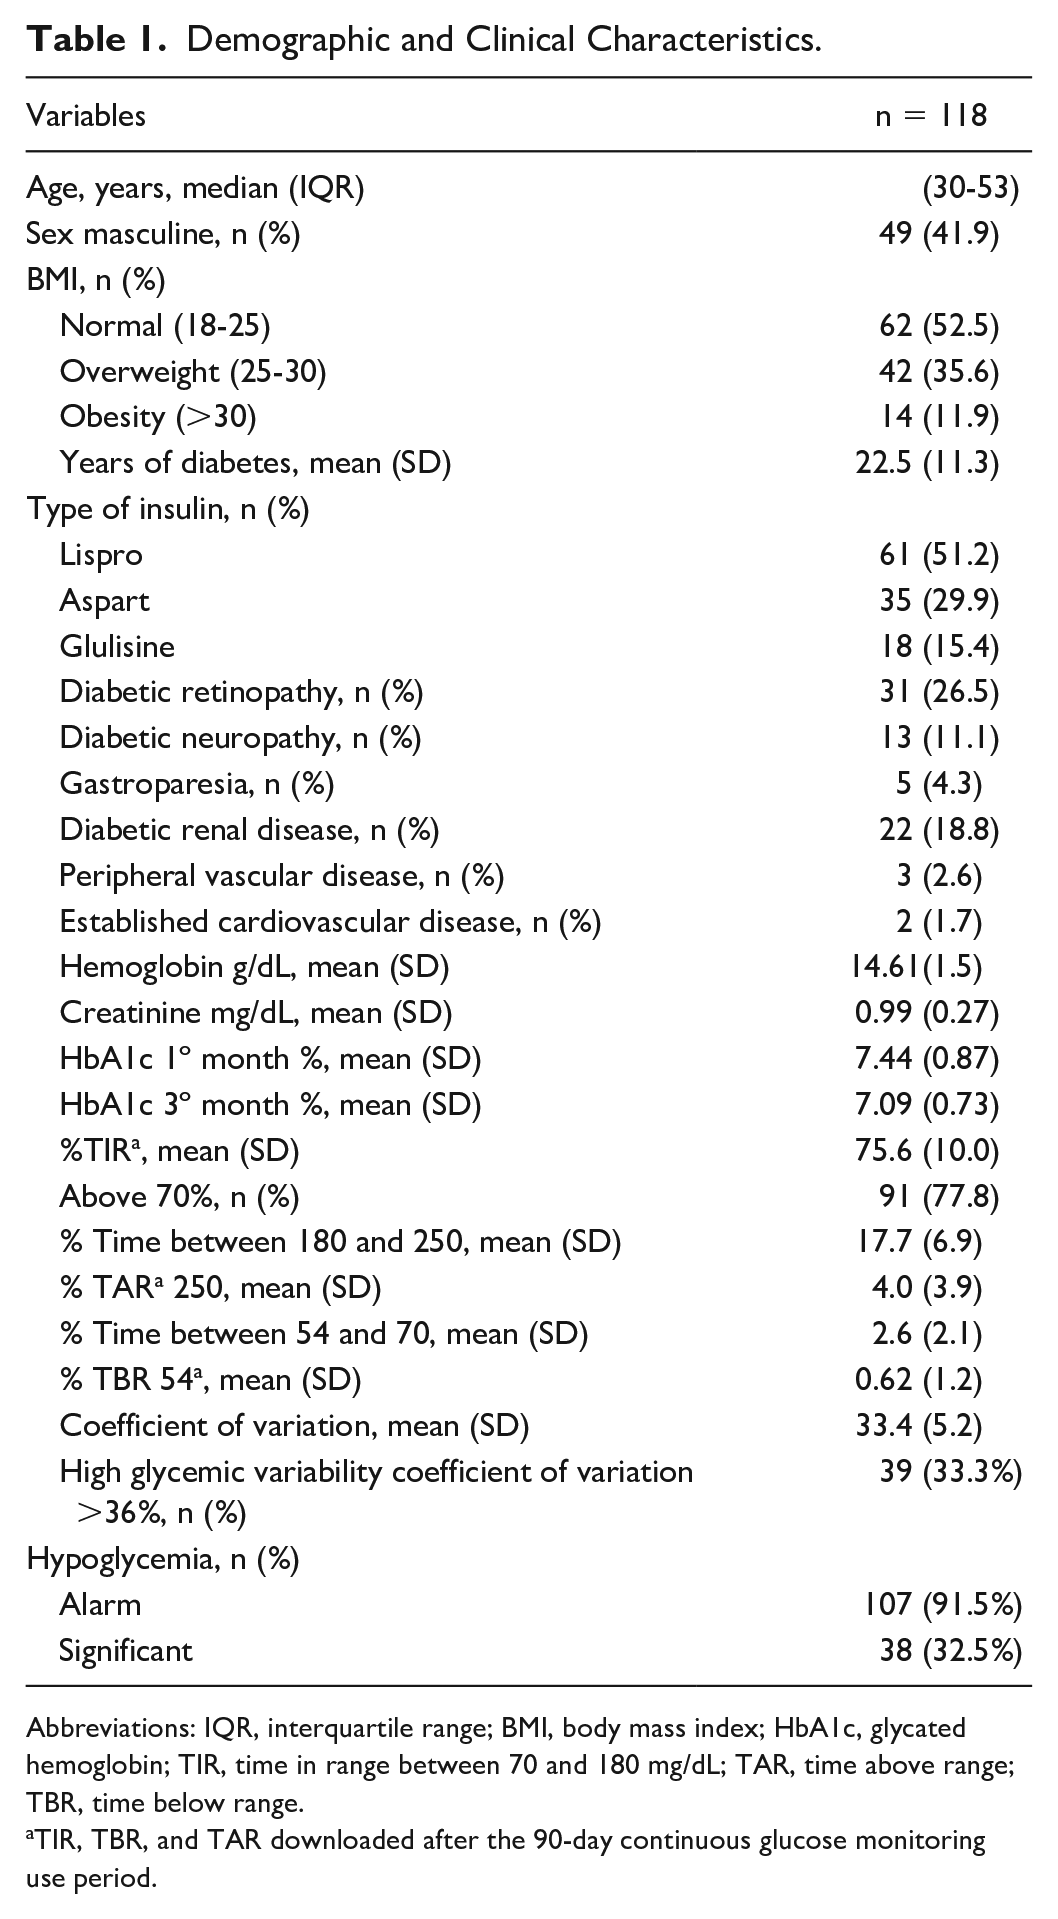
Abbreviations: IQR, interquartile range; BMI, body mass index; HbA1c, glycated hemoglobin; TIR, time in range between 70 and 180 mg/dL; TAR, time above range; TBR, time below range.
TIR, TBR, and TAR downloaded after the 90-day continuous glucose monitoring use period.
The number of patients with adequate glycemic control increased significantly from the baseline measurement (33.6%) to the three-month follow-up (48.7%) (P = .02). HbA1c improved from 7.44 ± 0.87% to 7.09 ± 0.73% in the same period (difference of means 0.32, P = .001). Ninety-one patients (77.8%) had a TIR ≥70% during follow-up. A moderate negative correlation (R = −.54, P < .001) was found between %TIR and HbA1c (Figure 1). Figure 2 shows the discriminative capacity of %TIR as a predictor of HbA1c ≤7%. An AUC of 0.7485 was found (95% confidence interval [CI] = 0.6608-0.8363). The cutoff point of the %TIR with better operative characteristics to discriminate adequate glycemic control was 75.5%, with a sensitivity of 70% and specificity of 67%. This cutoff point allowed the classification of 67.5% of the patients correctly. If the usual TIR value ≥70% was taken as a cutoff point, a good sensitivity (87%) would be obtained at the expense of poor specificity (31%).
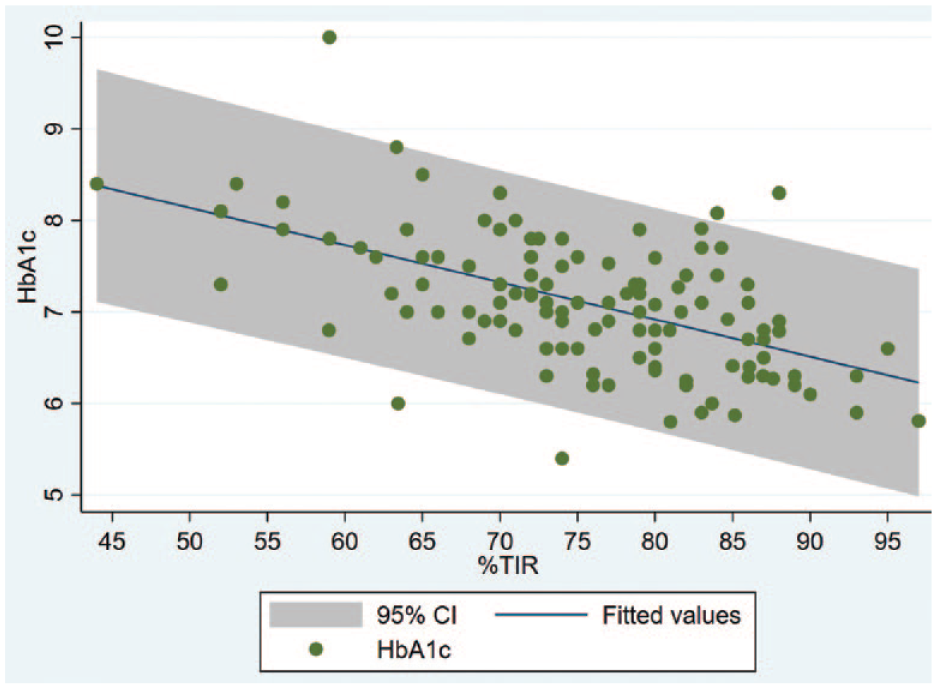
Correlation between %TIR and HbA1c. A moderate negative correlation (R = −.54, P < .001) was found between %TIR and HBA1c. Abbreviations: TIR, time in range; HbA1c, glycosylated hemoglobin.
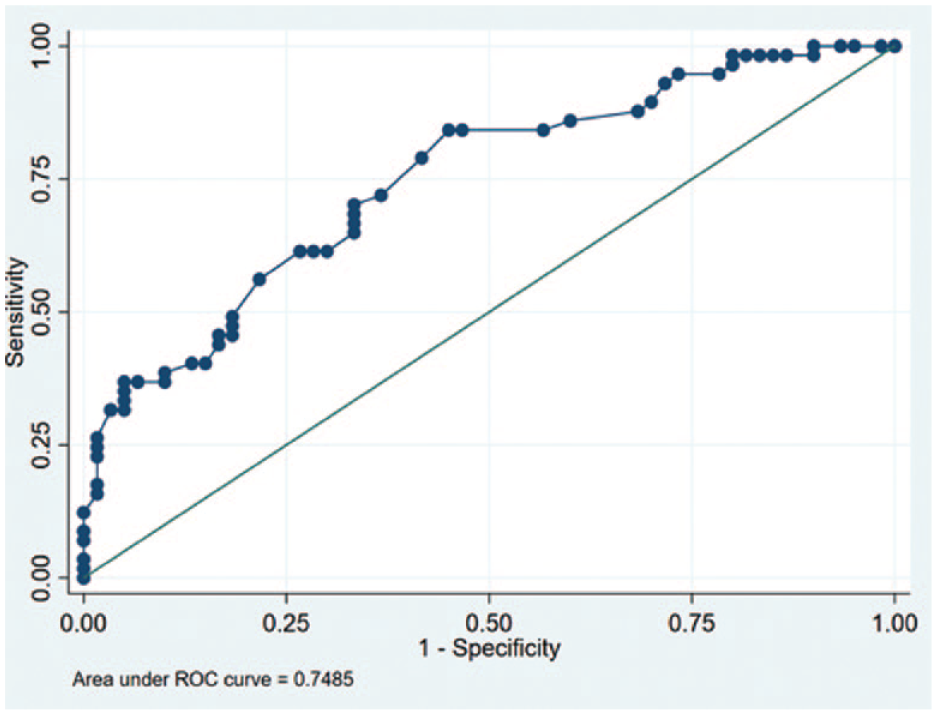
Discrimination capacity of the % time in range as a predictor of good metabolic control defined as glycosylated hemoglobin ≤7. Discriminative capacity defined as the area under the curve. Area under the curve 0.7485 (95% confidence interval = 0.6608-0.8363). Abbreviation: ROC, receiver operating characteristic curve.
Figure 3 shows the exploratory analysis that was carried out to evaluate the discrimination capacity of HbA1c as a predictor of a TIR ≥70%, with an AUC of 0.7652 (95% CI = 0.6594-0.8710). The cutoff point for HbA1c with the best operative characteristics was 7.45%, with a sensitivity of 79% and specificity of 62%%, which would correctly classify 63.8% of the patients. If an HbA1c level of 7% was taken as a cutoff point, there would be a specificity of 73% and a sensitivity of 55%, which would correctly classify 59.8% of the patients.
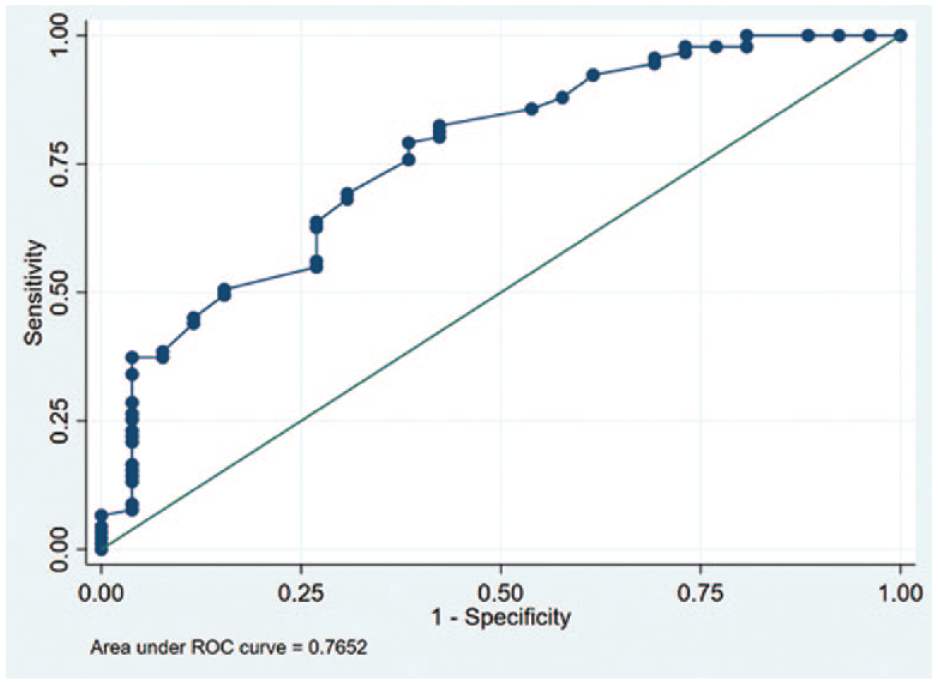
Discrimination capacity of glycosylated hemoglobin as a predictor of a time in range ≥70%. Discriminative capacity defined as the area under the curve. Area under the curve 0.7652 (95% confidence interval = 0.6594-0.8710). Abbreviation: ROC, receiver operating characteristic curve.
Sensitivity analysis was performed according to glycemic variability, TBR < 54 mg/dL, and high-risk status (which we defined as older than 65 years, with established cardiovascular disease or nephropathy). We found a similar discriminatory ability for patients with CV ≥36% (AUC: 0.7229; 95% CI = 0.5434-0.9023) and for those with CV less than 36% (AUC 0.7449, 95% CI = 0.6370-0.8527). Patients with TBR ≥1% (<54 mg/dL) had a better discriminatory ability (AUC: 0.8889; 95% CI = 0.7106-1.0000) than those with TBR <54 mg/dL less than 1% (AUC: 0.7625; 95% CI = 0.6506-0.8691). In high-risk patients, the optimal cutoff point for HbA1c to predict a TIR ≥70% was 7.95%.
Discussion
With the growing number of people with diabetes using CGM, finding a target of %TIR that defines good glycemic control is not only necessary, but could be a more comprehensive alternative, as it considers short-term as well as long-term changes in glucose levels. In our study, we found that %TIR has a moderate negative correlation with HbA1c, with an adequate discriminative capacity (AUC >0.70) to determine good metabolic control (HbA1c ≤7). The cutoff point with the ROC was a TIR ≥75.5%.
Both the latest 2021 American Diabetes Association guidelines and the 2019 international consensus of clinical objectives for the interpretation of CGM recommend a TIR ≥70% as a therapeutic objective13,23 based on two previous publications.34,35 In a retrospective analysis of 18 studies with 1440 patients with T1D and T2D, Vigersky and McMahon found an excellent correlation between TIR and HbA1c (R = −.84; R2 = .71) using data that included TIR calculated from CGM or self-monitoring blood glucose (SMBG). In addition, they reported that a TIR ≥70% corresponding to an HbA1c level of 6.7%. 29 In another retrospective analysis of data from 545 patients included in four randomized clinical studies, Beck et al 31 found a moderate correlation between TIR and HbA1c, reporting that a TIR ≥70% corresponds to an HbA1c of 7%.
There are different possible explanations for the discrepancies between the findings of our study and those previously described in the literature. First, our data were collected prospectively to reduce potential information biases, different from studies that have evaluated retrospective data, as those reported from DCCT. 24 Second, we excluded patients with pathologies that could alter the precision of the HbA1c measurements. Of the four trials reported by Beck et al,31,36 only one excluded simultaneously patients with hemoglobinopathy, anemia, and renal failure. Third, in the previous studies, the average duration of CGM was less than one month, while our data included information obtained over 90 days, which is the time over which glycemic control begins to be reflected in HbA1c levels. Herrero et al suggest that even when changes in HbA1c are fairly slow, some metrics like TIR can be robustly assessed from CGM data just after a four-week period, whereas some other metrics require much longer window lengths, especially those evaluating hypoglycemia. 37 Finally, fourth, the distinctions may be due to differences in the metabolic behavior of HbA1c in the Latin American population, because HbA1c levels are usually higher in Hispanic people as compared with those of white individuals with similar glycemic averages.18,19,38
In fact, the possible impact of increased glycation could have impact in the interpretation of TIR. Clinicians do not usually consider whether a patient is a high glycater when they inform TIR goals, but perhaps it is time to factor in the amount of glycation occurring for members of specific populations. Our data suggest that different populations could need different TIR targets just as we already know that they need different A1C targets.
Our findings suggest that the goal of TIR to determine good glycemic control defined by HbA1c could be slightly higher than the currently recommended levels based on both the ROC curve analysis that evaluates TIR values to predict HbA1c ≤7% and also in the analysis of the optimal cutoff threshold for HbA1c that would predict a TIR ≥70%. Both findings suggest that to achieve good glycemic control in CGM users, a TIR value of 70% may not be sufficient. Similar results were reported in a cohort of 4120 advanced HCL users who achieved a TIR of 76.2 ± 9.1%, corresponding to a mean GMI of 6.8 ± 0.3%. 39 Higher goals, closer to 75%, may be more optimal.
On the contrary, we found that the discrimination capacity of the TIR did not vary significantly in patients with high glycemic variability, data that are compatible with the findings of Rodbard 40 who described that exist a linear relationship between %TIR and median glucose for any specified %CV. Similarly, the discrimination capacity of the TIR did not vary significantly in patients older than 65 years, with established cardiovascular disease or diabetic renal disease. For those patients, the recommendations of the international consensus are to seek lower values (50%) than those of the usual risk population (70%). Our study suggests that the goal of %TIR in this high-risk population would be closer to 70% rather than 50%.
To our knowledge, our study is the first to prospectively evaluate the relationship between TIR and HbA1c based exclusively on CGM measurements with a sufficient follow-up time. Some limitations of our study need to be recognized. First, patients with T2D were not included, limiting the applicability of the conclusions to this population. Nevertheless, there are no studies suggesting that the behavior in patients with this type of diabetes is different. Second, our study looked at a population known to be high glycaters (Latin American people), which might make it difficult to make a comparison of TIR and A1C cutoffs between this population compared with lower glycating populations, such as those who are mostly European in origin. Future studies are needed to compare high and low glycater populations and determine the importance of this factor in the interpretation of TIR. Third, we decided to define A1C of 7% as good metabolic control which could be arbitrary considering that other groups have used values of 6.5% (including AACE [American Association of Clinical Endocrinology] guidelines for some years) and that in some patients a value of 7.5% or 8.0% could be considered as adequate. Finally, the exclusion of patients with anemia, hemoglobinopathies, advanced chronic kidney disease, and pregnant women, among others, also limits the applicability of our results in these specific populations. Additional studies that exclusively include patients with these conditions are required to overcome these limitations.
Our study confirms the existence of a moderate correlation between TIR and HbA1c (r = .54). This shows that the TIR has a good discriminatory capacity to identify patients with good metabolic control, one that is not affected in populations with high glycemic variability. Finally, our results suggest that the target TIR of 70% currently recommended in international guidelines might not be sufficient to achieve optimal glycemic control, and that a TIR value ≥75% might be more appropriate. Further study is needed both in Latin American populations to see whether these findings can be replicated, as well as in populations that are not known as high glycaters to see whether the observations from this study will also apply to those populations.
Footnotes
Abbreviations
AUC, area under the curve; CGM, continuous glucose monitoring; CV, coefficient of variation; HbA1c, glycosylated hemoglobin; MACE, major adverse cardiovascular events; T1D, type 1 diabetes; T2D, type 2 diabetes; TAR, time above range; TBR, time below range; TIR, time in range.
Declaration of Conflicting Interests
The author(s) declared the following potential conflicts of interest with respect to the research, authorship, and/or publication of this article: AMG reports speaker fees from Novo Nordisk, Sanofi, Elli Lilly, Boehringer Ingelheim, Abbott, and Medtronic. DCH reports speaker fees from Novo Nordisk, Sanofi, Medtronic, and Abbott.
Funding
The author(s) received no financial support for the research, authorship, and/or publication of this article.