
Abstract

HbA1c, or glycated hemoglobin, has long served as an essential biomarker for assessing long-term glycemic control in individuals with diabetes. Its widespread adoption in clinical practice stems from its convenience, reliability, and ability to reflect average blood glucose levels over the preceding two to three months. However, as we delve into the intricacies of prediabetes and diabetes diagnostics, emerging evidence suggests that the performance of HbA1c may be influenced by factors beyond the conventional understanding.1-4
Red blood cell (RBC) indices, including parameters such as mean corpuscular volume (MCV), mean corpuscular hemoglobin (MCH), and red cell distribution width (RDW), play a crucial role in hematological assessments. These indices provide insights into the morphology, size, and variability of RBCs, reflecting the dynamic nature of erythropoiesis and turnover within the bloodstream. Although these parameters have traditionally been associated with hematological disorders, recent investigations point to their potential impact on HbA1c measurements, thereby raising pertinent questions about the reliability of HbA1c as a stand-alone marker for dysglycemia diagnostics. 5
Our present research analysis aims to explore the potential effect of RBC indices on the performance of HbA1c in detecting dysglycemia. Leveraging explainable machine learning techniques (XGBoost and SHapley Additive exPlanations [SHAP]), we seek to unravel the intricate interplay between HbA1c measurements and RBC parameters using a data set for multiple years of the National Health and Nutrition Examination Survey (NHANES), where both fasting blood glucose (FBG) and HbA1c were measured. A total of 12 628 individuals were included in the analysis, where dysglycemia (defined by FBG >100 mg/dL) identification was assessed and compared by HbA1c or the model including HbA1c, RBC count, RDW, hemoglobin, MCV, MCH, and age. The assessment included area under the receiver operating characteristic curve (ROC-AUC) and individual feature importance derived from the prediction model. 95% confidence intervals (CIs) were estimated using bootstrapping (n = 1000).
Our initial observations, depicted in Figure 1, suggest that the incorporation of RBC indices may have the potential to augment the efficacy of HbA1c dysglycemia diagnostics. The ROC-AUC values for HbA1c were determined to be 0.718 (95% CI = 0.704-0.732), whereas for the model, the corresponding values were 0.763 (95% CI = 0.750-0.776). Significantly, the disparity between HbA1c and the model reached statistical significance (P < .001). Notably, both hemoglobin and RBC count exhibited predictive capabilities within the proposed model.
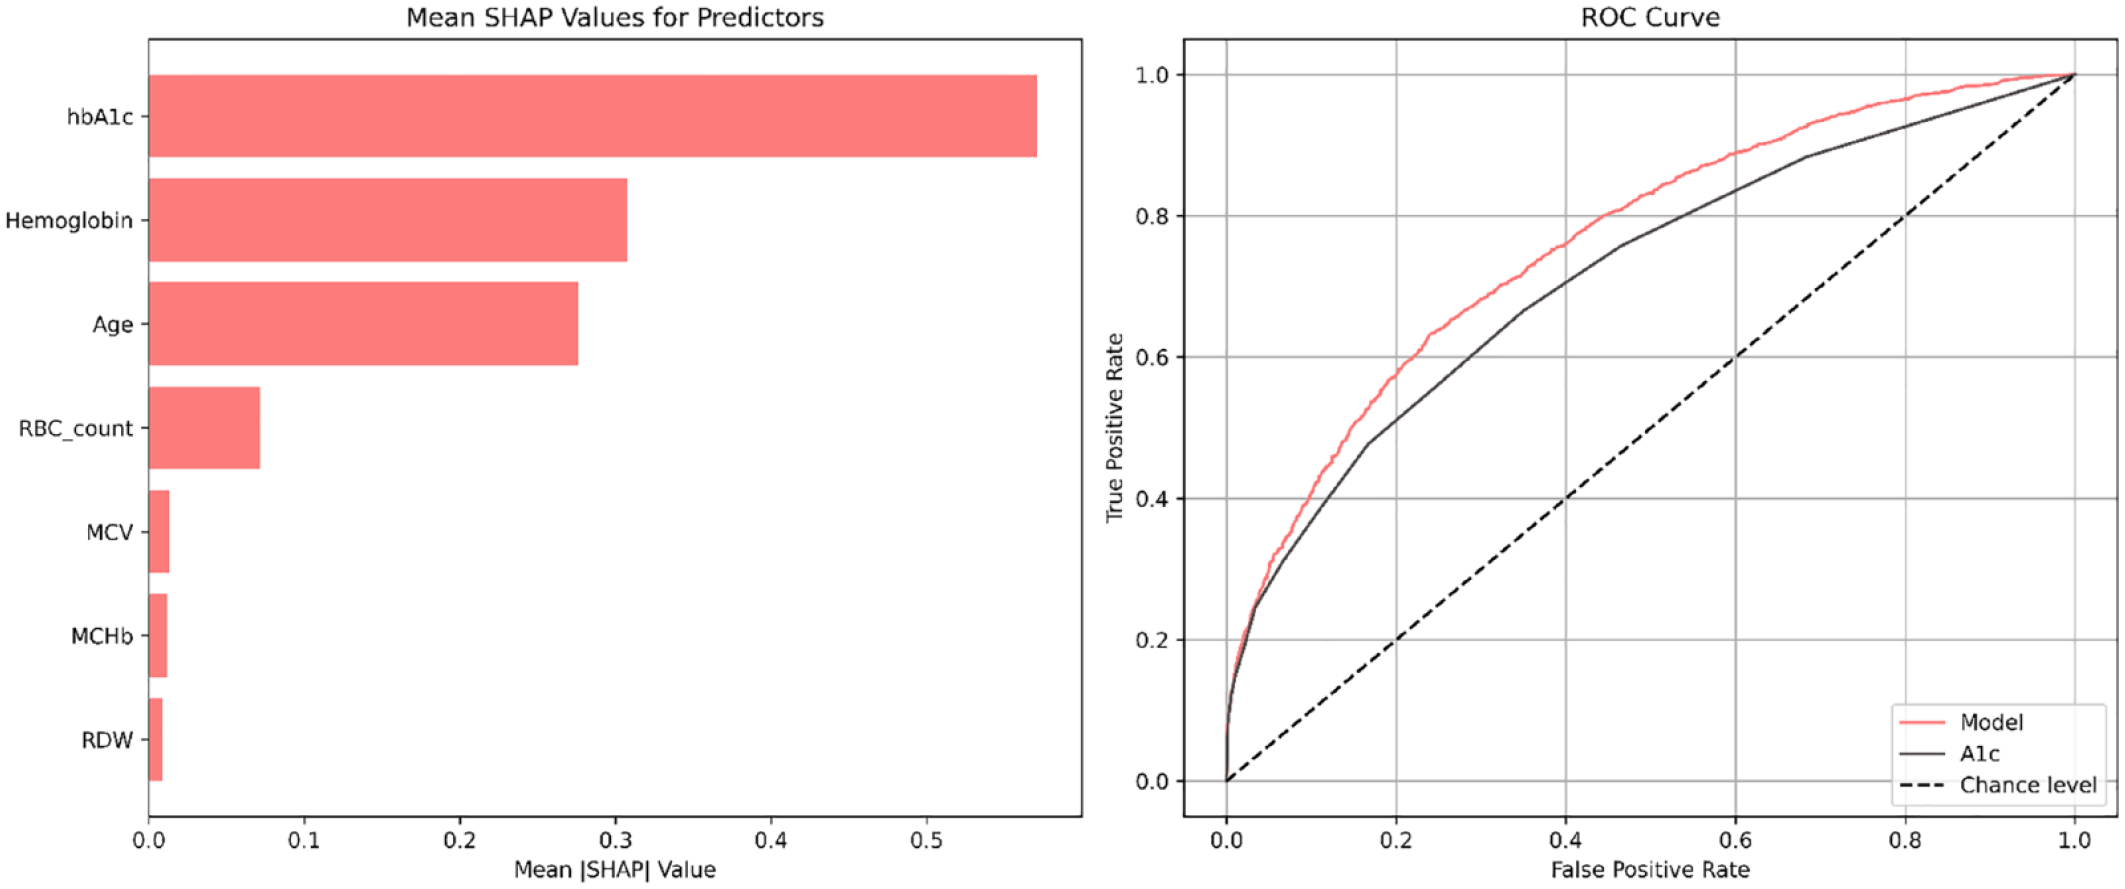
Left plot illustrates the mean SHAP value as a measure of individual features importance. Right plot illustrates the ROC curve for the model and HbA1c (A1c) in identifying dysglycemia (FBG >100 mg/dL).
These current findings diverge from previously reported results, as elucidated by Loy et al, 6 where an insignificant difference in the performance of HbA1c for detecting dysglycemia was observed among reproductive-aged women planning to conceive. It is crucial to note that our investigation encompassed a more extensive sample from the general population. Nevertheless, these observations warrant further in-depth exploration and validation.
Footnotes
Abbreviations
FBG, fasting blood glucose, HbA1c, glycated hemoglobin; MCH, mean corpuscular hemoglobin; MCV, mean corpuscular volume; NHANES, National Health and Nutrition Examination Survey; RDW, red cell distribution width; ROC-AUC, area under the receiver operating characteristic curve.
Declaration of Conflicting Interests
The author(s) declared no potential conflicts of interest with respect to the research, authorship, and/or publication of this article.
Funding
The author(s) received no financial support for the research, authorship, and/or publication of this article.