
Abstract
Background:
Regular assessment of glycated hemoglobin (HbA1c) is central to the management of patients with diabetes. Estimated HbA1c (eHbA1c) from continuous glucose monitoring (CGM) has been proposed as a measure that reflects laboratory HbA1c. However, discrepancies between the two markers are common, limiting the clinical use of eHbA1c. Therefore, developing a glycemic maker that better reflects laboratory HbA1c will be highly relevant in diabetes management.
Methods:
Using CGM data from two previous clinical studies in 120 individuals with diabetes, we derived a novel kinetic model that takes into account red blood cell (RBC) turnover, cross-membrane glucose transport, and hemoglobin glycation processes to individualize the relationship between glucose levels and HbA1c.
Results:
Using CGM data and two laboratory HbA1c measurements, kinetic rate constants for RBC glycation and turnover were calculated. These rate constants were used to project future HbA1c, creating a new individualized glycemic marker, termed calculated HbA1c (cHbA1c). In contrast to eHbA1c, the new glycemic marker cHbA1c gave an accurate estimation of laboratory HbA1c across individuals. The model and data demonstrated a non-linear relationship between laboratory HbA1c and steady-state glucose and also showed that glycation status is modulated by age.
Conclusion:
Our kinetic model offers mechanistic insights into the relationship between glucose levels and glycated hemoglobin. Therefore, the new glycemic marker does not only accurately reflect laboratory HbA1c but also provides novel concepts to explain the mechanisms for the mismatch between HbA1c and average glucose in some individuals, which has implications for future clinical management.
Introduction
Improving glucose levels is key to prevent microvascular complications in diabetes and long-term macrovascular disease.1-4 Glycated hemoglobin A1c (HbA1c), a critical marker for clinical decision-making in diabetes, is a weighted average of blood glucose levels during the life of the red blood cells (RBCs). However, it has been observed that there is a substantial diversity across individuals in the relationship between glucose exposure and HbA1c. 5 This relationship is referred to as the “hemoglobin glycation index” (HGI) and represents the difference between observed HbA1c and estimated HbA1c (eHbA1c) derived from average glucose readings. HGI was shown to be associated with microvascular complications in patients with type 1 diabetes6,7 and coronary artery pathology regardless of diabetes status.8,9 Moreover, in the ACCORD trial, intensively treated patients with high HGI were found to have higher total mortality and a greater risk for hypoglycemia. 10 Analysis of continuous glucose monitoring (CGM) data indicated that HGI differs between individuals and is stable over 6-12 months of observation. 11 In addition, hemoglobinopathy-related HbA1c variations 12 and ethnic differences in glycation index 13 further demonstrate the wide individual variation in glycation status. These findings are supportive of data showing discordance between mean glucose and HbA1c in some patients with diabetes. 14
A well-known modulator of HbA1c is RBC lifespan, which can vary individually. 15 In the quest of developing a marker that reflects laboratory HbA1c, Malka et al 16 proposed addressing this effect by adjusting glucose levels according to mean RBC lifespan. While this method improved the relationship between weighted average glucose and HbA1c, it has the limitation of assuming a fixed glycation rate16,17 and failing to acknowledge variation in RBC cross-membrane glucose transport.18,19 The use of kinetic modeling has been demonstrated by an empirical model, 20 which shows the association of recent glucose levels and HbA1c change; however, this model does not provide insight into the underlying mechanism affecting the glucose–HbA1c relationship. Understanding this mechanism is critical given the important role of HbA1c in diabetes management. Therefore, our aim was to establish a clinically meaningful relationship between the time-course of glucose concentration and HbA1c with considerations of two processes: RBC turnover and overall hemoglobin glycation, which includes cross-membrane glucose transport.
Methods
HbA1c Kinetic Model
Glycated hemoglobin in RBCs is generated by exposing these cells to ambient plasma glucose concentration. The hemoglobin glycation reaction happens within RBCs and therefore depends on intracellular glucose. RBCs with glycated and unglycated hemoglobin are constantly eliminated from the circulation, balanced by the generation of fresh RBCs at variable rates.15,21 Our kinetic model takes all of these into account as depicted in Figure 1.
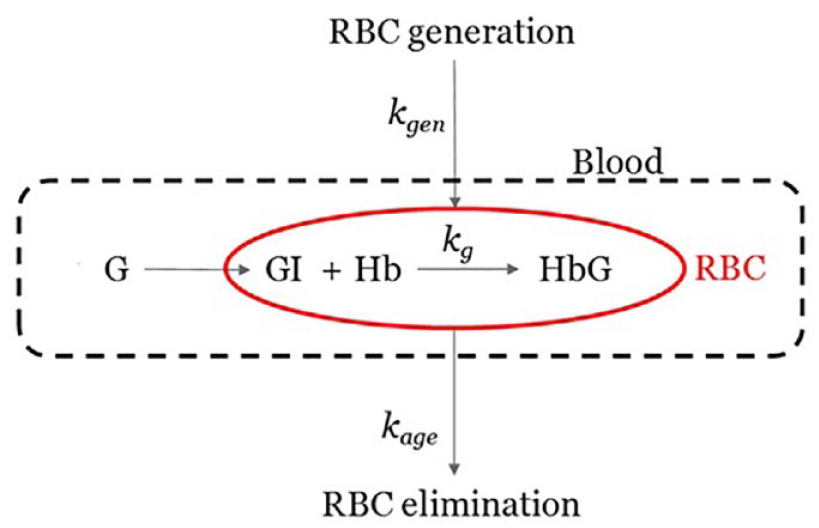
Kinetic model with multiple kinetic processes. G and GI are blood glucose and intracellular glucose in RBCs, respectively. Hb and HbG are non-glycated and glycated hemoglobin in RBCs. The rate constants kg, kage, and kgen are assigned to hemoglobin glycation, elimination, and generation processes, respectively.
A set of assumptions were made during the model construction:
There is an absence of any abnormal RBCs that would affect HbA1c measurement. 22
The glycation process has first-order dependencies on concentrations of both hemoglobin in RBCs and intracellular glucose, an assumption that is widely adopted. 16
Newly generated RBCs have a negligible amount of glycated hemoglobin.15,16
RBCs are eliminated from circulation when they reach a subject-specific age. The individual RBC elimination rate is approximated with a constant. Therefore, the glycated hemoglobin removal rate is proportional to the product of overall RBC elimination rate and HbA1c at the time.
With these, the rate of change in glycated and non-glycated hemoglobin in RBCs can be modeled by differential equations:


[HbG] and [Hb] are the concentrations of glycated and unglycated hemoglobin, respectively, [GI] is the intracellular glucose concentration. The kg is the rate constant of hemoglobin glycation reaction in unit of (concentration*time)−1. C is the total hemoglobin concentration
The glucose transporter on RBC membranes (GLUT1) follows Michaelis–Menten kinetic with KM = 26.2 mM.
23
Therefore, the intracellular glucose can be modeled with
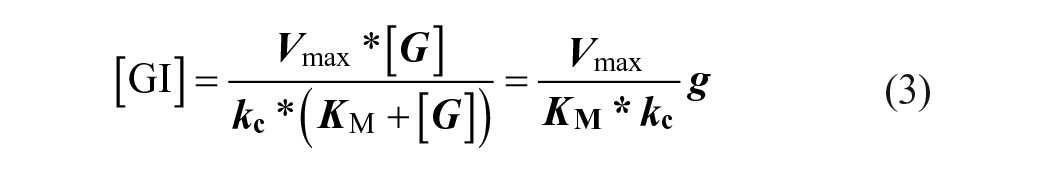
where
By definition, HbA1c is the fraction of the glycated hemoglobin found in RBCs:
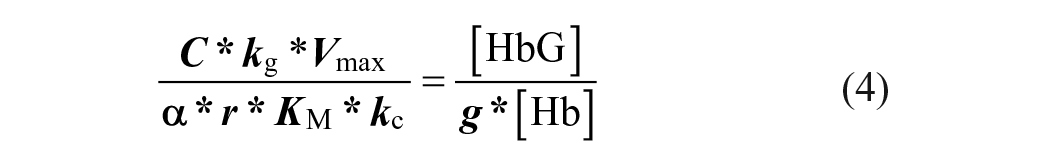
By combining all parameters associated with cross-membrane glucose transport and glycation from the right-hand side of equation (4), we define the composite glycation rate constant

Under a hypothetical steady-state of constant glucose level, HbA1c should reach an equilibrium level, which is the “equilibrium HbA1c” (EA). Since C = [HbG] + [Hb], equation (5) can be rewritten as

This relationship approximates the average glucose and HbA1c for an individual with stable day-to-day glucose profile.
Equation (1) can be transformed to d (Alc) / dt = kgly * g
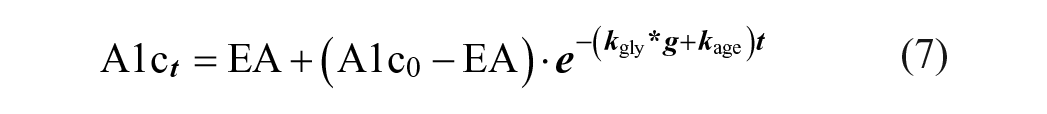
To accommodate changing glucose levels over time, we approximate each subject’s glucose history as a series of time intervals ti with corresponding glucose levels [Gi]. Applying equation (7) recursively, HbA1c value A1c z (at the end of time interval tz) can be expressed by equation (8) for numerical calculations.
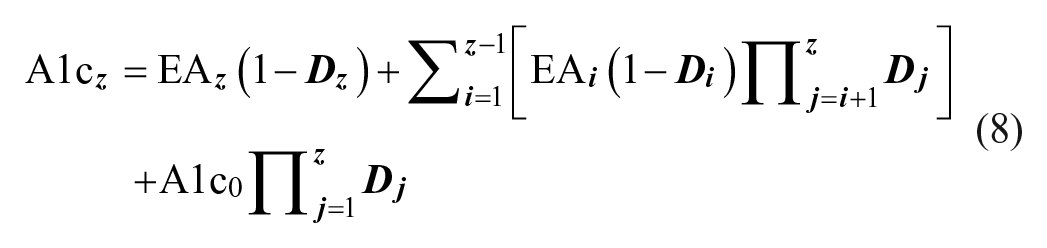
where
Equations (7) and (8) describe how HbA1c change depends on glucose level and individual kinetic constants kgly, and kage, which can be estimated with one or more data sections. A data section contains two HbA1c measurements, one at the start of the time period and one at the end, with frequent glucose levels in between. Also, cHbA1c can be calculated at any time given kgly and kage are available together with an earlier HbA1c and frequent glucose measurements. The purpose of the frequent glucose measurements is to calculate average glucose (
Study Design
Our goal was to develop and verify the kinetic model for better understanding the connection between glucose level and HbA1c. The study was partitioned into three steps.
We collected qualified clinical data from previous clinical studies, with two independent data sections per subject. To ensure general applicability of the results, we collected data from both type 1 and type 2 diabetes individuals (n = 54 and 66, respectively).
Individual kinetic constants kgly and kage were estimated using the first data section.
The subject-specific kinetic constants kgly and kage (from previous step) were used to prospectively generate cHbA1c throughout the second data section. To assess the performance of the model, we evaluated the agreements of cHbA1c and eHbA1c 24 with laboratory HbA1c values at the end of the second data section.
Estimation of Individual RBC Kinetic Constants
The numerical approach that optimizes the kinetic constants has initial values of
cHbA1c, eHbA1c and Weighted Average Glucose
The eHbA1c was derived based on both plain and weighted average glucose converted by the accepted regression model from the A1c-Derived Average Glucose (ADAG) study.
24
A 14-day window was used for average glucose eHbA1c calculation, while weighted average glucose16,26 was assessed using
Selection of Time Interval ti and Data Sufficiency Criteria
The time interval ti in equation (8) defines the level of approximation on glucose fluctuation. Shorter intervals should result in a higher accuracy of calculated rate constants kgly and kage but may not be practical and necessary. In order to establish the most suitable time interval, we numerically estimated kgly and kage values using the first data section for different time intervals of 3, 6, 12, 24, and 36 hours. This evaluation indicated adequate accuracy for the 24-hour interval. It also suggested that, within a data section, at least 80% of the 15-minute glucose data should be present, with no gaps greater than half the duration of the time interval. For example, for a study period of 200 days and 24-hour time interval, there should be at least 15 360 out of 19 200 15-minute glucose data points present, with glucose data sections having a continuous gap no longer than 12 hours.
Data Source
We analyzed data from 148 patients with type 2 diabetes and 139 patients with type 1 diabetes enrolled in two previous European clinical studies, having 6 months of continuous glucose monitoring.27,28 Both studies were conducted after appropriate ethical approval and participants gave written informed consent.
In both studies, CGM data were collected using the sensor-based flash glucose monitoring system (FreeStyle Libre; Abbott Diabetes Care, Witney, UK). HbA1c was measured by a central laboratory (ICON Laboratories, Dublin, Ireland). Data sections from 120 subjects (Table 1) met the inclusion requirements described above for a 24-hour interval (ti). Study participants had three HbA1c measurements, on days 1, 100 (±5 days), and 200 (±5 days) and this, together with continuous glucose monitoring data, allowed the analysis of two independent data sections (days 1-100 and days 100-200) per participant (Figure 2).
Description of Study Participants Evaluated by the Method.
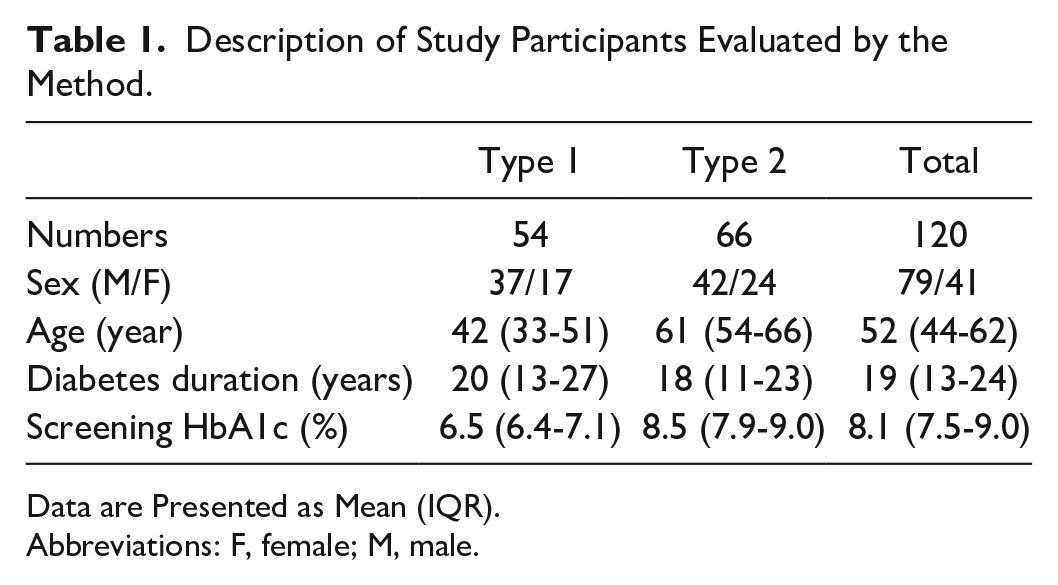
Data are Presented as Mean (IQR).
Abbreviations: F, female; M, male.
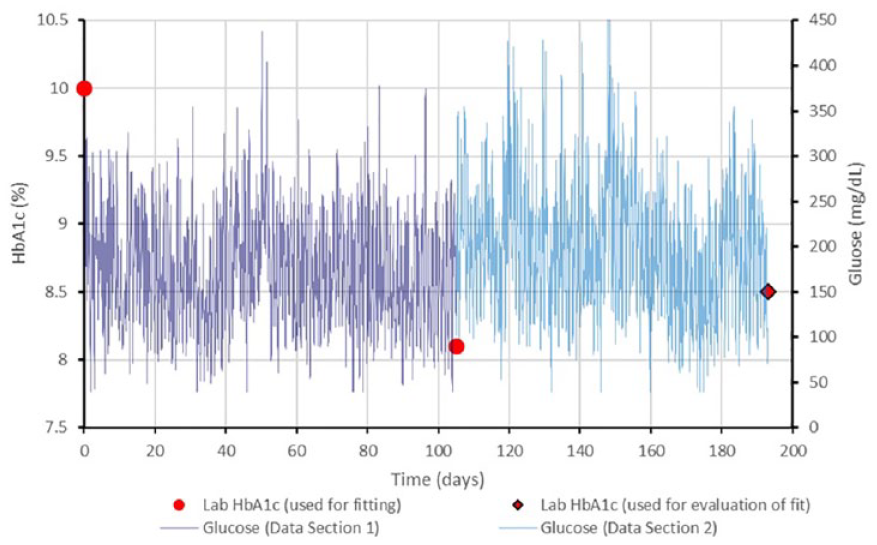
Example of data used in the method. Laboratory HbA1c values at the beginning and end of the first data section were evaluated together with daily average glucose values throughout the first data setion to determine individual kinetic constants. The second data section daily average glucose values were used to prospectively calculate a value to compare to the laboratory HbA1c at the end of the second data section.
Statistical Analysis
The confidence intervals were calculated from the sample mean and standard deviation with the critical value of 95% confidence level. Distributions were characterized by mean and standard deviation for normally distributed data and by median and interquartile range (IQR) for non-normally distributed data. The glucose trace gaps less than 45 minutes had missing values imputed with the nearest observation or average of nearest observations if both were available (the observations immediate before or after the gap). For a longer gap, up to half of the time interval ti, each missing value was imputed with the average of the observations at the same time in prior and next days. Data sections with more than 20% missing values or a gap longer than half of the time interval ti were excluded from this study. We used Python/SciPy, 29 KNIME, 30 and R 31 software packages for all analyses.
The prospective agreement between laboratory HbA1c and the three HbA1c estimating methods, cHbA1c, eHbA1c, and weighted eHbA1c, were assessed using the P-value from the one-way analysis of covariance (one-way ANOVA) with a significance level of 0.05 in R. One-way ANOVA was also used to compare across age tertile groups of K, kgly, and kage.
Results
Prospective Calculation of HbA1c and Validation of the Method
Prospective use of the model with individual kinetic constants resulted in an absolute difference between cHbA1c and laboratory HbA1c of median (IQR) of 0.27% (0.11%, 0.47%). For comparison, the absolute deviation for the average glucose eHbA1c and the weighted average glucose eHbA1c were 0.57% (0.22%-0.89%) and 0.50% (0.22%-0.87%), respectively, both approximately twice larger than and statistically different from the kinetic model result (P values < .001).
Figure 3 shows the improved agreement between sensor-derived cHbA1c and laboratory HbA1c (R2 = 0.88), compared to the 14-day eHbA1c (R2 = 0.63) or weighted average glucose (R2 = 0.68) methods. Laboratory HbA1c ranged from 5.7% to 10.6%, with a mean (median, SD) value of 7.7% (7.7%, 0.96%). At this mean value, cHbA1c had no overall bias, and the 95% prediction confidence interval ranged from 6.9% to 8.4%, which is a 40% reduction of this interval compared with the average glucose eHbA1c that has a clinically significant bias of −0.5% and a 95% prediction confidence interval ranged from 6.0% to 8.4%. Furthermore, the agreement was not affected by diabetes type (P > .05) or age (P > .05) for cHbA1c. In contrast, eHbA1c based on average glucose and weighted average glucose do not appear to be broadly applicable, as the average relative errors were significantly related to diabetes type (P = .05 and P = .03, respectively) and age (P = .025 and P = .02, respectively) indicating the performance of these methods may be susceptible to bias related to the type of patient population. Compared with laboratory HbA1c, eHbA1c showed inferior median absolute deviation to cHbA1c in both subjects with type 1 (0.47% vs. 0.29%, P < .001) and type 2 (0.78% vs. 0.33%, P < .001) diabetes.
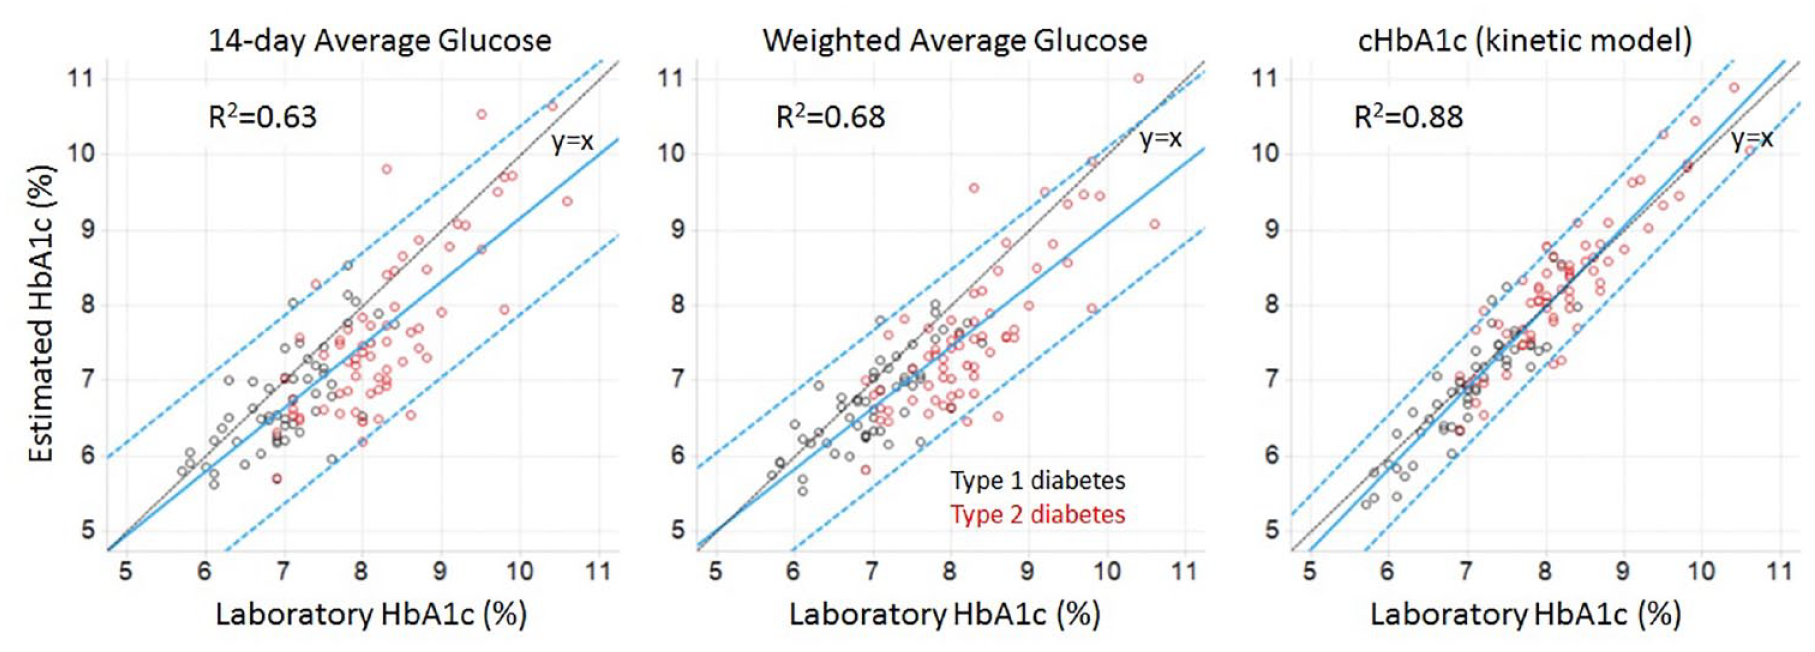
Evaluation of three methods for agreement between estimated HbA1c and laboratory HbA1c. Data are shown for study participants with both type 1 (black) and type 2 (red) diabetes. For each method, the blue lines are linear regression with 95% confidence intervals, and the black line is unity.
Individual cHbA1c and eHbA1c Trace
An example study subject is shown in Figure 4 with the glucose trace, laboratory HbA1c readings, and model cHbA1c values (both cHbA1c and average glucose eHbA1c models).
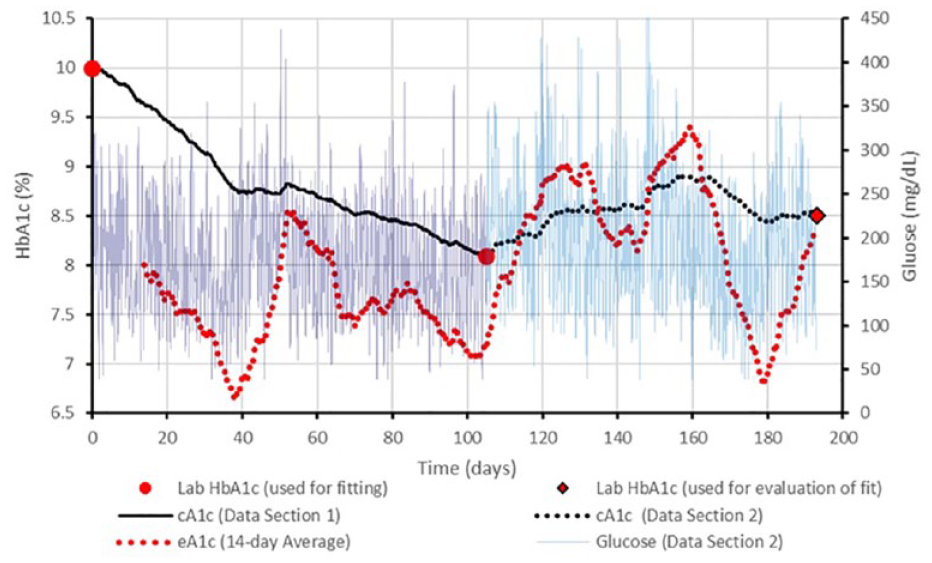
cHbA1c trace example. Glucose trace (thin solid line), laboratory HbA1c values (blue dots), cHbA1c trace (black line), and eHbA1c traces based on 14-day average glucose (redline) from a clinical study subject. The first data section was used to calculate kinetic constants, kgly = 8.21E−6dL/mg/day and kage = 0.0165 day−1. The prospective cHbA1c value (8.5%) agrees with the day 193 HbA1c value (8.5%).
This example shows the dynamic nature of glucose-to-cHbA1c and glucose-to-eHbA1c relationships. Additional examples are shown for type 1 and type 2 diabetes study participants across a range of absolute prediction deviations: 25th, 50th, and 75th percentiles for the cHbA1c method (Figure 5). In these examples, the disagreement between the cHbA1c from the average glucose eHbA1c is illustrated, indicating the exaggerated amplitude of variation inherent in the average glucose method.

Examples of individual eHbA1c and cHbA1c relationship over time. Panels A, B, and C are type 1 diabetes study participants with absolute prediction errors at 25th, 50th, and 75th percentiles of all type 1 subjects. Similarly, panels D, E, and F are type 2 diabetes study participants with absolute prediction errors at 25th, 50th, and 75th percentiles of all type 2 subjects. Blue dots are laboratory HbA1c measurements. Black lines are cHbA1c traces. Red lines are 14-day average glucose traces.
Distribution of Kinetic Constants
To study the distribution of kage and kgly in study subjects, we calculated individual kinetic constants using both data sections. We analyzed the distributions of kage and kgly by tertiles of age (Figure 6). Comparing tertiles with the youngest (47 years or less) to the oldest (>60 years), the oldest group had significantly higher apparent glycation constant K (P = .02). The oldest group also showed lower kgly and kage values, but these failed to reach statistical significance (P > .1). The kgly range (4.0-7.7 × 10⁻⁶ dL/mg/day) that we obtained in this study is close to the reported range of 1.121-1.460 × 10⁻⁹ L/mmol/s or 5.38-7.01 × 10⁻⁶ dL/mg/day. 32
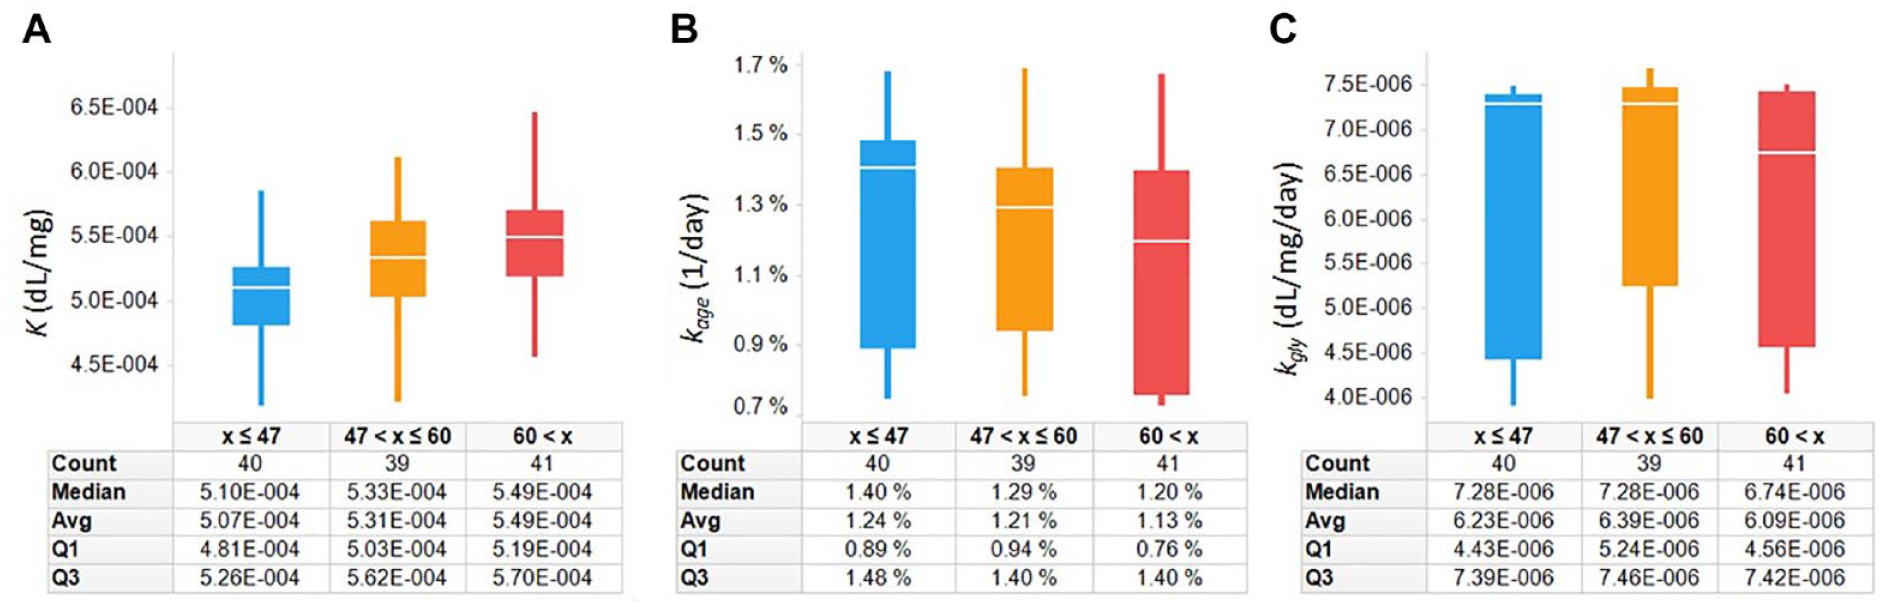
Distributions of K, kgly, and kage (A, B, and C, respectively) in 120 clinical study subjects. Subjects with age less than 48 years, 48-60 years, and more than 60 years are shown in blue, yellow, and red, respectively. K increases with longer diabetes duration, which appears to be related to larger reduction in kage than kgly.
Discussion
We report in this work a novel glycemic marker, cHbA1c, which accurately reflects laboratory HbA1c and may provide a tool for assessing glycemia over variable time periods. The new marker accounts for individual variation in the RBC turnover rate kage and cross-membrane glucose transport rate which is embedded in kgly. Both parameters control the relationship between laboratory HbA1c and glucose in our model. In the verification exercise, a 0.27% median absolute deviation was observed when comparing cHbA1c and laboratory HbA1c, which is superior to eHbA1c (0.57%) and weighted average eHbA1c (0.50%). Importantly, the 0.27% median absolute deviation is comparable to central laboratory HbA1c error ranges, 33 further emphasizing the accuracy of cHbA1c. An important observation in this work is that older age was associated with higher K value, defined as the ratio of the glycation and RBC turnover rate constants (equation (5)), which indicates older individuals will be more likely to have a higher laboratory HbA1c compared with a 14-day CGM eHbA1c. In addition to age, variability in the distributions of kinetic constants may explain ethnic differences in the relationship between HbA1c and glucose levels. 13 Given that cHbA1c adjusts for kinetic constants, this suggests that it may be suitable to use regardless of age or ethnic groups, although this would require further research to confirm.
According to equation (6), individuals with lower
It has been demonstrated that glycemic cell damage is most pronounced in cells that fail to control cross-membrane glucose movement in the presence of pathological hyperglycemia. 35 Since mature RBC lacks the ability to adjust GLUT1, HbA1c reflects the relevant intracellular glucose exposure that predicts hyperglycemic-induced damage in various tissues. However, this relationship may be individual and can change over the extended periods of time due to the variations in the RBC turnover rate and RBC glucose transport rate. Equation (6) provides a way to adjust for either individual RBC turnover rate or glucose transport rate variations against appropriate reference levels. Therefore, the currently observed mismatch between HbA1c and CGM-derived eHbA1c can be meaningful for patient care, as the source of the mismatch can be accommodated into the clinical decision process. The component of the mismatch due to deviations in RBC turnover can likely be ignored since these will not reflect the glycemic exposure in other tissues. However, the component of the mismatch due to deviations in glucose cross-membrane transport may be accounted for since the deviation may be present in other tissues. Confirming these mismatch components and strategies for incorporating this information into patient care is a key area of future research.
The strength of this work is the establishment of a novel glycemic marker, cHbA1c, which reflects laboratory HbA1c and can be used to assess response to therapy changes. Furthermore, this work proposes important kinetic parameters, kgly, kage, and K, which characterize the individual glycation status. However, there are several limitations that should be acknowledged. First, cHbA1c calculation requires at least two reliable laboratory HbA1c measurements and frequent glucose tests that are hard to achieve with capillary glucose testing. However, the emergence of a new generation of CGM devices that are both affordable and accurate will make obtaining frequent glucose data practical. 36 Second, only a single method was employed to analyze interstitial glucose, and findings will require confirmation using other CGM devices. Finally, more data from ethnically diverse groups are needed to further validate the model and confirm the variability in kinetic constants.
Conclusion
The kinetic model offers mechanistic insight into the relationship between glucose levels and glycated hemoglobin, as well as an individualized hemoglobin glycation index. The new glycemic marker, cHbA1c, described in this work shows the strongest correlation to date with laboratory HbA1c, compared with other markers of average glucose control. This new glycemic marker promises to become a potential future clinical tool that reduces the need for HbA1c blood testing in patients with diabetes.
Footnotes
Acknowledgements
YX thanks Erwin Budiman and Gary Hayter for useful discussions and helpful suggestions.
Contribution statement
YX designed and derived kinetic models and performed programming and calculations. YX and TCD acquired data and designed the study. YX, TCD, and RA worked collaboratively to write, discuss, and review this manuscript.
Declaration of Conflicting Interests
The author(s) declared the following potential conflicts of interest with respect to the research, authorship, and/or publication of this article: YX and TCD are employees of Abbott Diabetes Care. YX and TCD are listed as inventors on a patent application related to this work submitted by Abbott. RA reports other funding from Abbott Diabetes Care during the conduct of the study and personal fees from Abbott Diabetes Care outside the submitted work.
Funding
The author(s) disclosed receipt of the following financial support for the research, authorship, and/or publication of this article: This work is funded by Abbott Diabetes Care.
Data Availability
The source code and datasets analysed in this paper may be available from the corresponding author on reasonable request.