
Abstract
Background:
Strict adherence to multiple daily insulin (MDI) therapy is a cornerstone for the achievement of good glucose control in people with advanced type 2 diabetes (T2D). Here, we aim to in silico assess glucose control in T2D subjects with poor adherence to MDI therapy.
Methods:
We tuned the Padova T2D Simulator, originally describing early-stage T2D physiology, around advanced T2D people. One hundred in silico advanced T2D subjects were generated and equipped with optimal MDI therapy: specifically, basal and bolus insulin amounts and injection times were individualized for each subject by applying titration algorithms that iteratively update insulin dose based on glucose deviation from its target. Then, the effect of nonadhering to MDI therapy was assessed using standard glucose control metrics calculated in two 6-month 3-meal/day in silico scenarios: in Scenario 1, subjects received the optimal basal and prandial insulin bolus at each meal; in Scenario 2, subjects received optimal basal insulin and randomly delayed or skipped the prandial insulin bolus in 3 lunches during working days and 1 dinner during weekends.
Results:
A statistically significant degradation was found in all glucose control outcome metrics in Scenario 2 versus Scenario 1: e.g., percent time above 180 mg/dL increased by 22.2% and glucose management index by 0.2%.
Conclusions:
Impaired adherence to MDI therapy in T2D leads to glucose control deteriorations in both short and long terms. Interestingly, short-term hyperglycemia seems being contrasted by residual endogenous insulin secretion, which statistically increased by 3-fold after delayed/skipped insulin boluses compared with optimal ones.
Introduction
Type 2 diabetes (T2D) affects more than 400 million people worldwide, with a significant financial burden mainly related to hospitalizations and medications used to treat disease complications. 1 T2D is characterized by concomitant insulin resistance and impaired beta-cell function leading to chronic hyperglycemia, which requires different medications depending on the stage of disease progression. In particular, people with advanced T2D must follow a strict schedule of multiple daily injection (MDI) of insulin analogs, similar to patients with type 1 diabetes (T1D), to cover both basal and prandial insulin needs, necessary to guarantee the optimal blood glucose (BG) control. Nevertheless, skipping or delaying prandial insulin bolus is quite common among individuals with diabetes, either since they simply forget it or because they intentionally hide their disease to colleagues and friends due to fear of social stigma. This issue has been widely studied in T1D, especially in adolescents and young adults,2 -7 showing a 0.8% to 1.5% increased glycated hemoglobin (HbA1c) in subjects failing adherence to MDI therapy. In this regard, it has been shown that emerging technologies, like continuous glucose monitoring, connected insulin pens and artificial pancreas, may help to maximize therapy adherence and consequently improve BG control.7 -9 However, the impaired adherence to insulin therapy in T2D patients is still poorly investigated10 -12 and differences between T1D and T2D may exist. This calls for developing tailored solutions to properly predict and treat diabetes complications in target populations.
In order to contribute to this field, here we aim at in silico investigating the effects on glucose control of nonoptimal adherence to MDI therapy in virtual T2D people. Similarly to what was done in T1D, 13 this is realized by performing an in silico trial using the Padova T2D simulator, 14 ad hoc modified to represent an advanced T2D population under MDI therapy, and by evaluating BG control degradation in both short and long terms.
Methods
The Padova T2D Simulator
The University of Padova T2D Simulator (T2DS)
14
describes glucose, insulin, and C-peptide dynamics in response to specific perturbations, like meal carbohydrate (CHO) intakes and administered treatments. The T2DS consists of a model (Figure 1) describing glucose–insulin–C-peptide interactions and their metabolic fluxes (i.e., intestinal glucose absorption, endogenous glucose production, glucose utilization, and endogenous insulin secretion) and a cohort of 100 in silico early-stage T2D subjects, each one represented by a vector
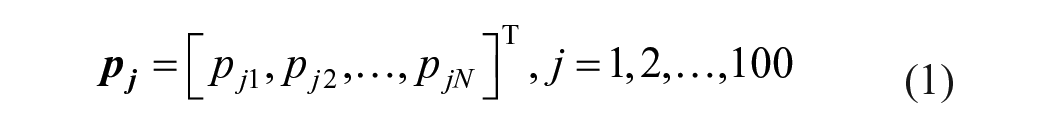
Each
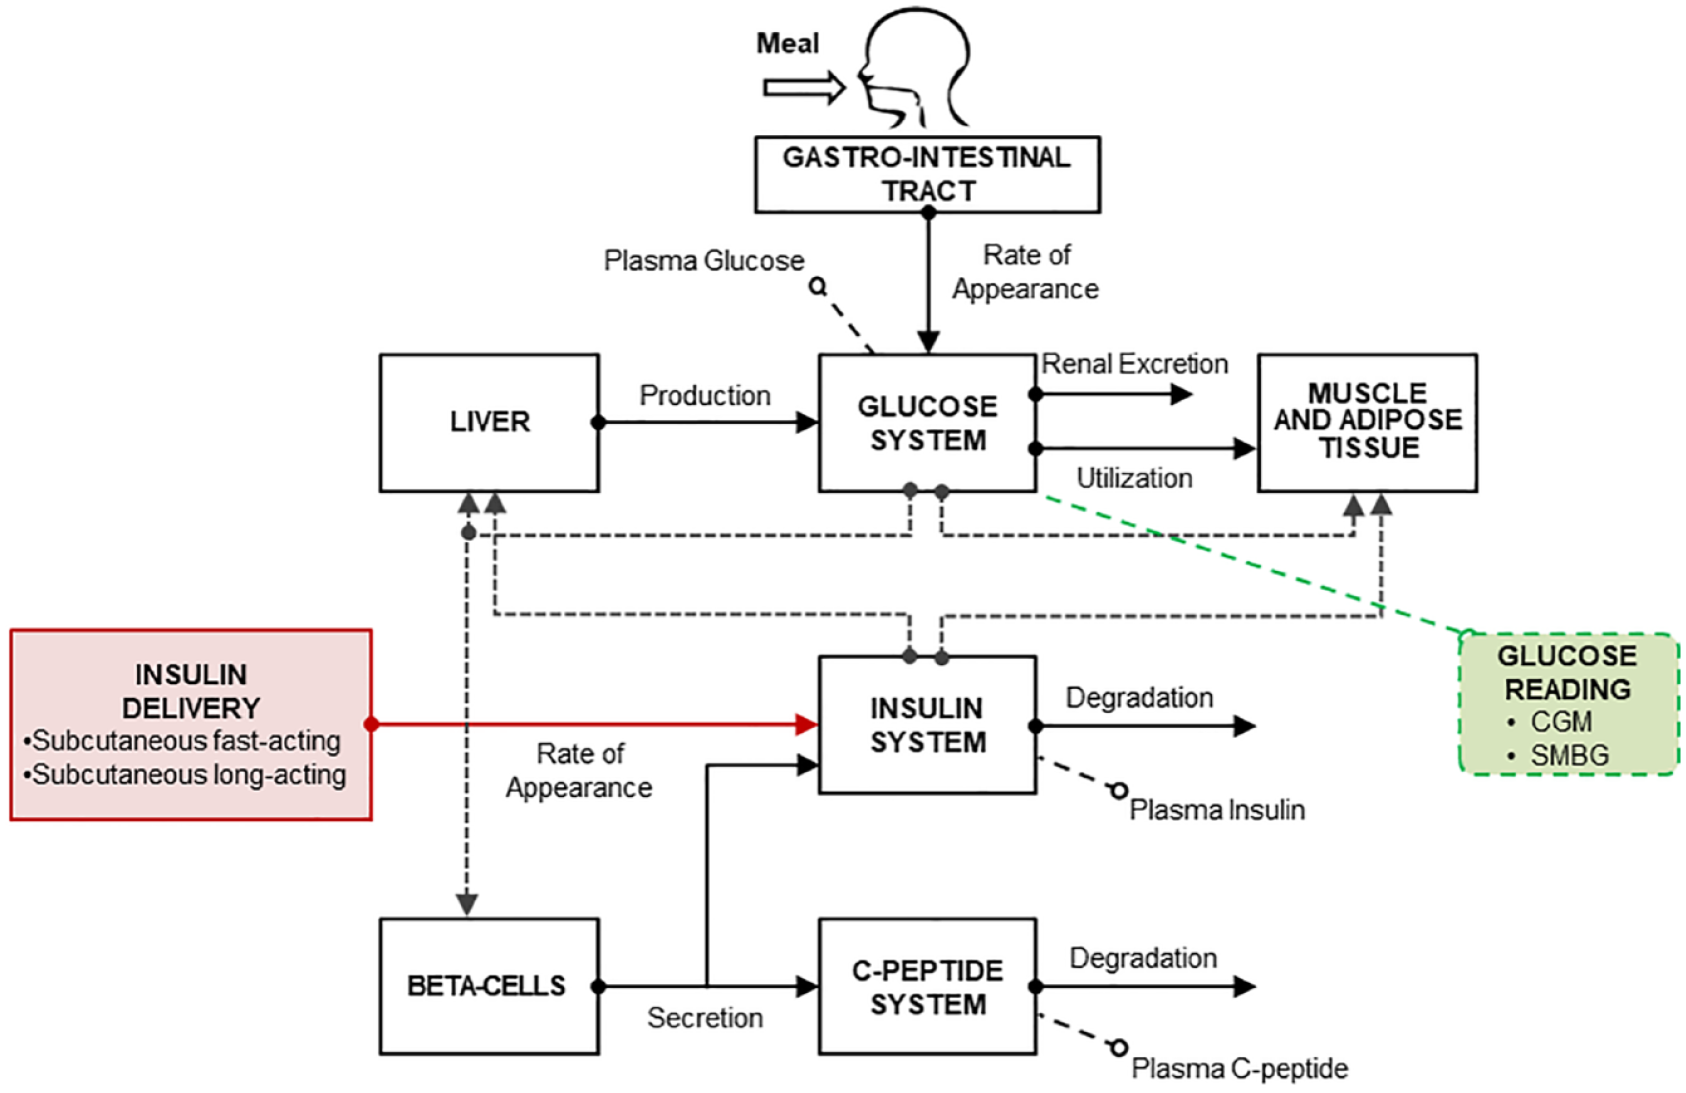
Scheme of the Padova T2D simulator 14 integrating models of subcutaneous fast-/long-acting insulin pharmacokinetics, CGM, and SMBG.
The in silico early-stage T2D population is not appropriate for the proposed aim, since these patients, due to their moderately impaired insulin function, are not treated with exogenous insulin for BG control. Therefore, the T2DS needs to be integrated with an in silico insulin-dependent advanced T2D population and models of exogenous insulin delivery to enable MDI therapy. Of note, the T2DS already incorporates models of both CGM 20 and self-monitoring of blood glucose (SMBG). 21
Insulin Therapy Incorporation
To simulate MDI therapy, two pharmacokinetic (PK) models describing subcutaneous administration of both basal long-acting insulin degludec (iDeg) and prandial fast-acting insulin lispro have been incorporated into the T2DS. These models have been developed and validated against clinical data in previous studies.22,23 The PK models are described by the following mass balance equations:
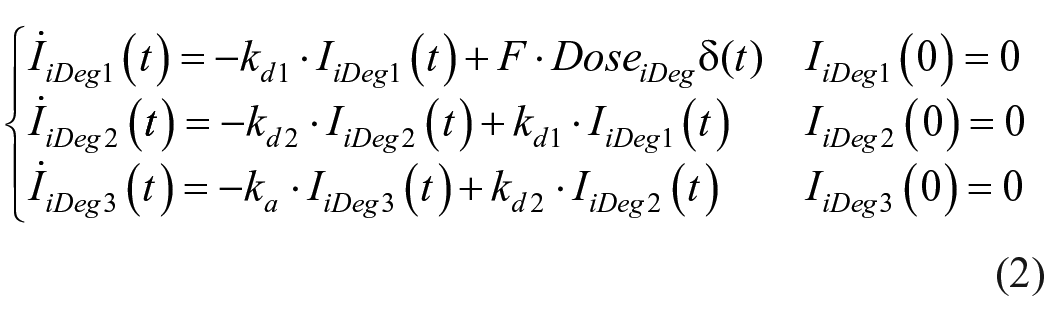
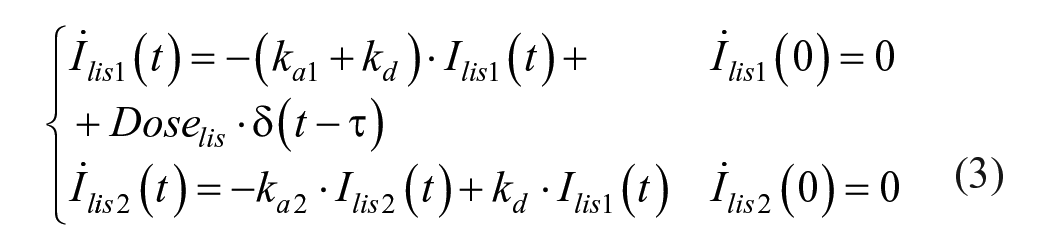

where DoseiDeg (pmol/kg) is the iDeg dose,
Insulin-Dependent Advanced T2D Population
The T2DS has been tailored to an insulin-dependent advanced T2D population, by adopting a recently proposed population cloning technique.
24
In particular, the T2DS model has been identified on average plasma glucose, insulin, and C-peptide time courses data of insulin-naïve T2D patients (ie, subjects who are initiated to insulin therapy) collected during a mixed meal tolerance test (MMTT),
25
and fasting concentrations of the same metabolites and hormones measured in insulin-treated T2D patients.
26
It is worth underlining that data available from Holst et al.
25
were related to insulin-naïve subjects, i.e., who just started insulin therapy, while the present work focuses on individuals with uncontrolled T2D who already are under insulin therapy and likely exhibit even more impaired insulin function. Thus, we considered fasting data coming from Uzunlulu et al.
26
to maximize the compatibility between the tailored T2DS and the target population object of study. Given the complexity of T2DS model, it was impossible to reliably estimate the entire set of model parameters from the sole average plasma glucose, insulin, and C-peptide data. Thus, only key metabolic parameters describing insulin sensitivity (Vmx, kp3), insulin secretion (
Φ
b
,
Φ
s
,
Φ
d
) and hepatic extraction (HEb) were estimated from MMTT data, while the remaining parameters were fixed to population values. To note, insulin sensitivity, secretion, and hepatic extraction are known to be the key parameters that mostly characterize T2D pathophysiology and differ among populations, as already found in previous analysis.
27
Model parameters were estimated using a Maximum a Posteriori estimator, using
The insulin PK parameters obtained from the literature,22,23 the parameter set obtained by identifying the model on the average data of Holst et al.
25
and the fasting concentrations reported in Uzunlulu et al.
26
were used to update the distribution mean vector (µˆ
Insulin Therapy Individualization
Both iDeg and lispro doses were individualized for each in silico subject, in terms of amount and time of administration. The procedure is described as follows.
Long-acting insulin individualization
Subject-specific basal iDeg dose amount and injection time were determined by a 2-step procedure. Each subject underwent two 6-month trials, with 3 meal/day (carbohydrate amounts: 58.2±22.5 g, 77.7±27.0 g, 83.9±32.3 g, at breakfast, lunch, and dinner, respectively) and iDeg injected at morning or evening, respectively. iDeg amount was individualized following the American Diabetes Association (ADA) standard guidelines, 29 starting from 10 U and optimally adjusting the dose toward a fasting plasma glucose (FPG) target of [80-130] mg/dL. In particular, daily basal iDeg dose (D) adjustment was done every 3 days based on the following titration rule:
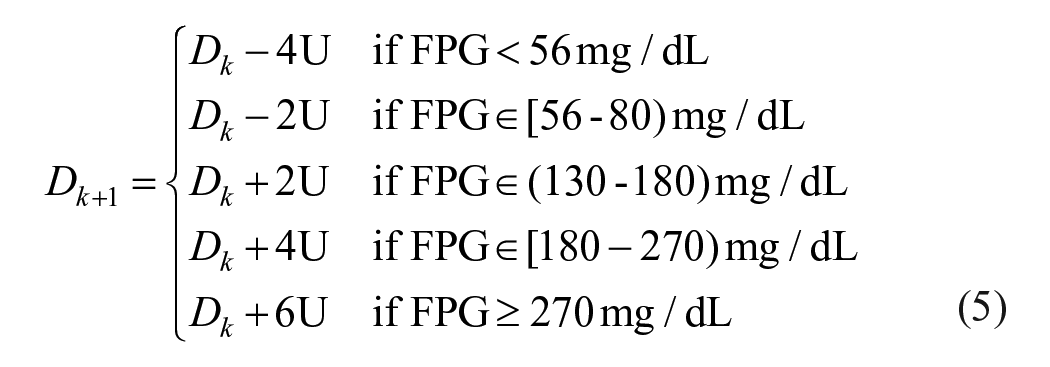
where FPG was calculated as mean of the last 3-day values.
Then, iDeg injection time was determined for each subject following the scheme illustrated in Figure 2, i.e., it was chosen between morning and evening as the one causing the minimum percent time in hypoglycemia (BG < 70 mg/dL) and the maximum percent time in euglycemia (BG in target [70-180] mg/dL).
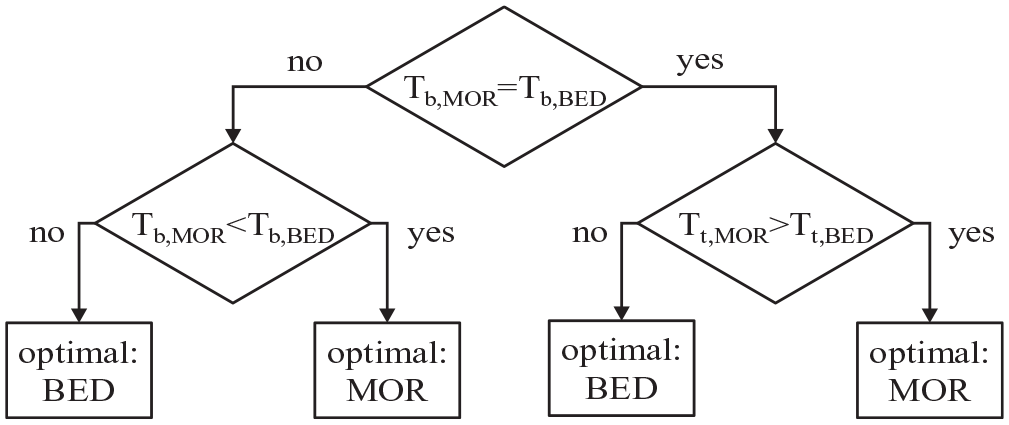
Decision tree describing the method for selecting the optimal iDeg injection time.
Fast-acting insulin individualization
Individual prandial fast-acting insulin lispro was determined based on clinical guidelines. 30 Specifically, each virtual subject underwent a 6-month 3-meal/day trial, receiving its individualized daily basal insulin (TDIbasal) determined in the previous step. Mealtime insulin lispro dose was initiated at the 20% of TDIbasal and adjusted every 3 days based on either 2-hr postmeal glucose (with target range of [120-160] mg/dL) or values before the following meal or at bedtime (with target range of [90-130] mg/dL). In particular, insulin adjustments at breakfast, lunch and dinner were done by varying the respective insulin-to-carb ratio (CR) as follows:
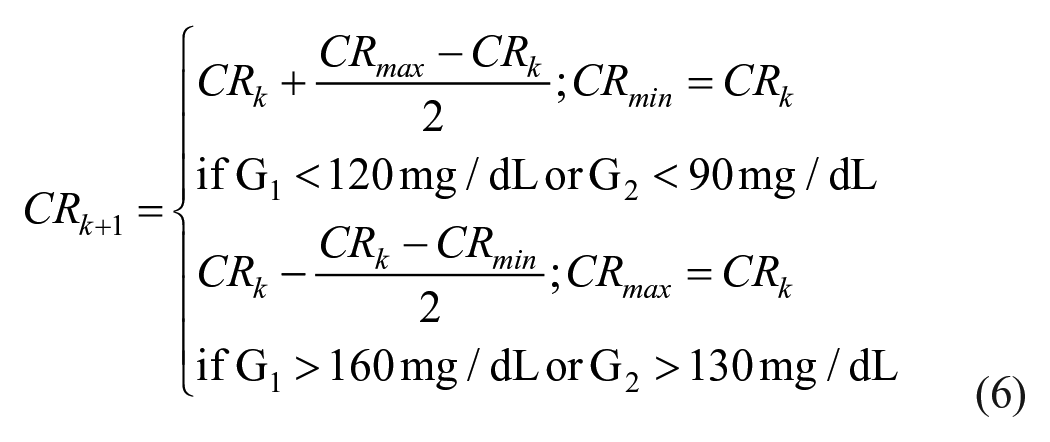
where CRmax and CRmin are initiated to 200 and 1 g/U, respectively; G1 is the 2-hr postmeal glucose; and G2 is the glucose value before the following meal or at bedtime. Finally, for each meal, the amount of insulin lispro (Bolus) was calculated from the estimated carbohydrate content (

In Silico Trial
An in silico trial has been performed using the T2DS incorporating the advanced T2D patients under MDI therapy, to evaluate the impact of nonadherence to insulin therapy on BG control. Specifically, the in silico advanced T2D patients underwent two 6-month scenarios, with realistic meal administrations 31 : three meals per day were randomly generated for each subject, assuming mealtime uniformly distributed in the intervals 06:30 am to 08:00 am (breakfast), 11:30 am to 01:00 pm (lunch), 06:30 pm to 08:00 pm (dinner); meal amounts were randomly sampled from a uniform distribution with mean and SD derived from data published in Brazeau et al. 31 (58.2 ± 22.5 g for breakfast, 77.7 ± 27.0 g for lunch, 83.9 ± 32.3 g for dinner).
For each scenario, each subject received the individual basal insulin (iDeg) injected at breakfast or bedtime, as described in Section 2.4, while meal insulin (lispro) bolus was determined from subject’s CR and meal
Glucose Control Metrics
Glucose control was assessed in terms of simulated CGM using standardized control outcome metrics for clinical care,29,32 i.e., average glucose (Mean, mg/dL), glucose standard deviation (SD, mg/dL), glucose coefficient of variation (CV, %), percent time CGM-glucose in ranges [70-180] (Tt,70-180, %), <70 (Tb,70, %), <54 (Tb,54, %), >180 (Ta,180, %), >250 mg/dL (Ta,250, %), and glucose management index (GMI, %). 33
Glucose control metrics were calculated based on the 6-hour CGM data following each meal affected by delayed or skipped insulin bolus. Values were reported as mean ± standard deviation (SD) for normally distributed variables, otherwise as median [25th-75th] percentiles. Statistical comparison was done by Student’s t-test for normally distributed variables, or Wilcoxon sign rank test, otherwise, with significant p-value set at 0.05.
Results
Insulin-Dependent Advanced T2D Population
The in silico population of insulin-dependent advanced T2D subjects was characterized by a mean ± standard deviation (SD) age of 55 ± 18 year, body weight of 87 ± 15 kg, body mass index of 31 ± 5 kg/m2, basal glucose of 241 ± 31 mg/dL, basal insulin of 33 ± 13 pmol/L, basal C-peptide of 435 ± 133 pmol/L. These baseline characteristics values are in agreement with the clinical study 26 and reflect those of T2D patients who start MDI therapy for BG control to compensate insufficient beta-cell function.29,34 It is important to point out that the resulting basal glucose is expected to be much higher than that reported in both studies.25,26 Indeed, subjects in Holst et al. 25 are insulin-naïve T2D; moreover, it is expected that their fasting glucose is decreased following basal insulin titration. Similarly, subjects studied in Uzunlulu et al. 26 are patients with T2D who had been treated with insulin as a monotherapy or as a component of combination therapy; hence, their lower blood glucose (~130 mg/dL) is the result of insulin treatment. Conversely, the fasting glucose reported here is that of individuals with advanced T2D in absence of exogenous insulin (i.e., before starting basal/bolus therapy). Simulated plasma glucose, insulin, and C-peptide curves obtained by replicating the MMTT described in Holst et al. 25 are shown in Figure 3. Concentration peaks occur at (mean ± SD) 116 ± 13 min, 124 ± 23 min, and 154 ± 23 min, for glucose, insulin, and C-peptide, respectively, similarly to clinical observations (about 120 min). 25
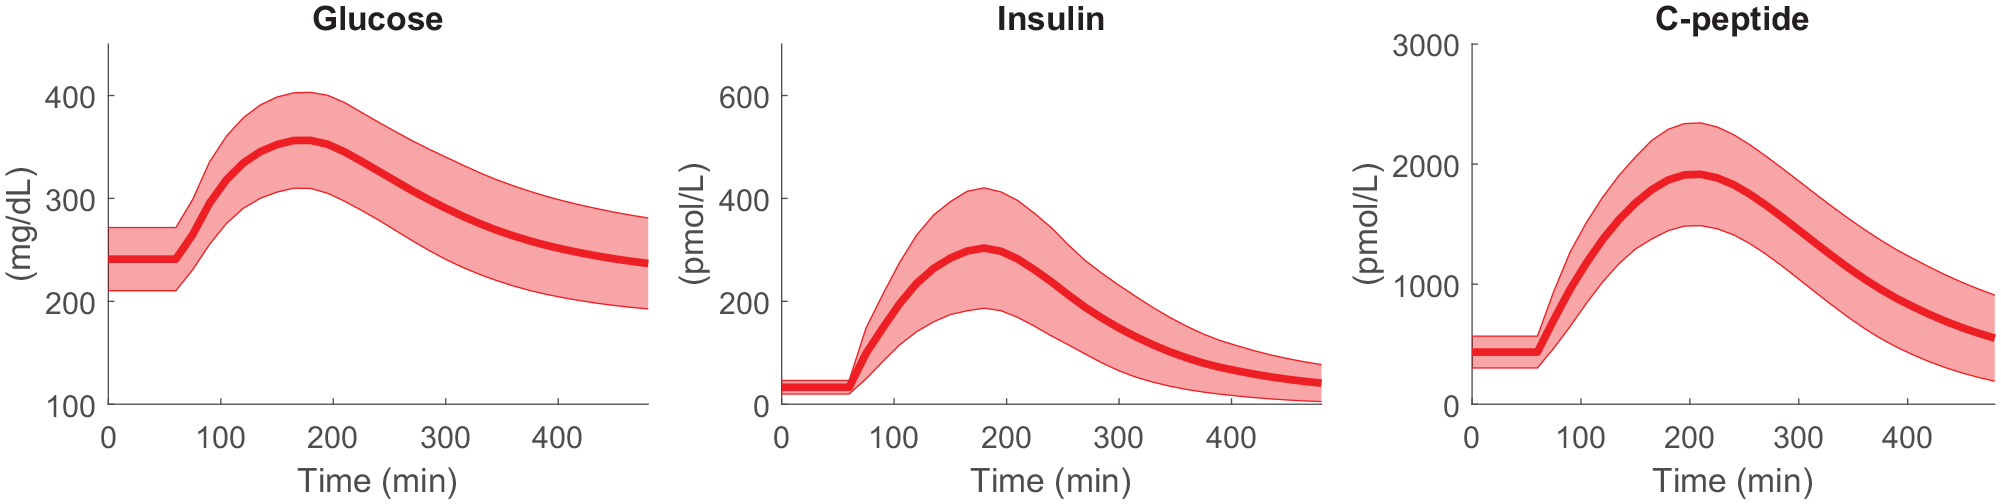
Simulated glucose (left), insulin (center), and C-peptide (right panel) concentrations in advanced T2D subjects in uncontrolled conditions (i.e., without exogenous insulin administration), obtained during a 480-min meal test with 96 g of carbohydrates given at t = 60 min, mimicking the clinical study. 25
Basal and Bolus Insulin Titration
The adaptation of basal (iDeg) and bolus (lispro) insulin dose following the titration periods are shown in Figure 4. After 6 months, mean ± SD FPG was 124 ± 10 mg/dL (baseline change of -110 ± 49 mg/dL), as a result of a total daily insulin (TDI) of 1.32 ± 0.70 U/kg/day distributed among TDIbasal of 0.82 ± 0.48 U/kg/day (62% ± 14% of TDI) and TDIbolus of 0.49 ± 0.31 U/kg/day (38% ± 14% of TDI). To note, FPG values are in agreement with ADA standards of care, 29 and the TDIbasal-to-TDIbolus ratio well matches that reported in the real study. 34
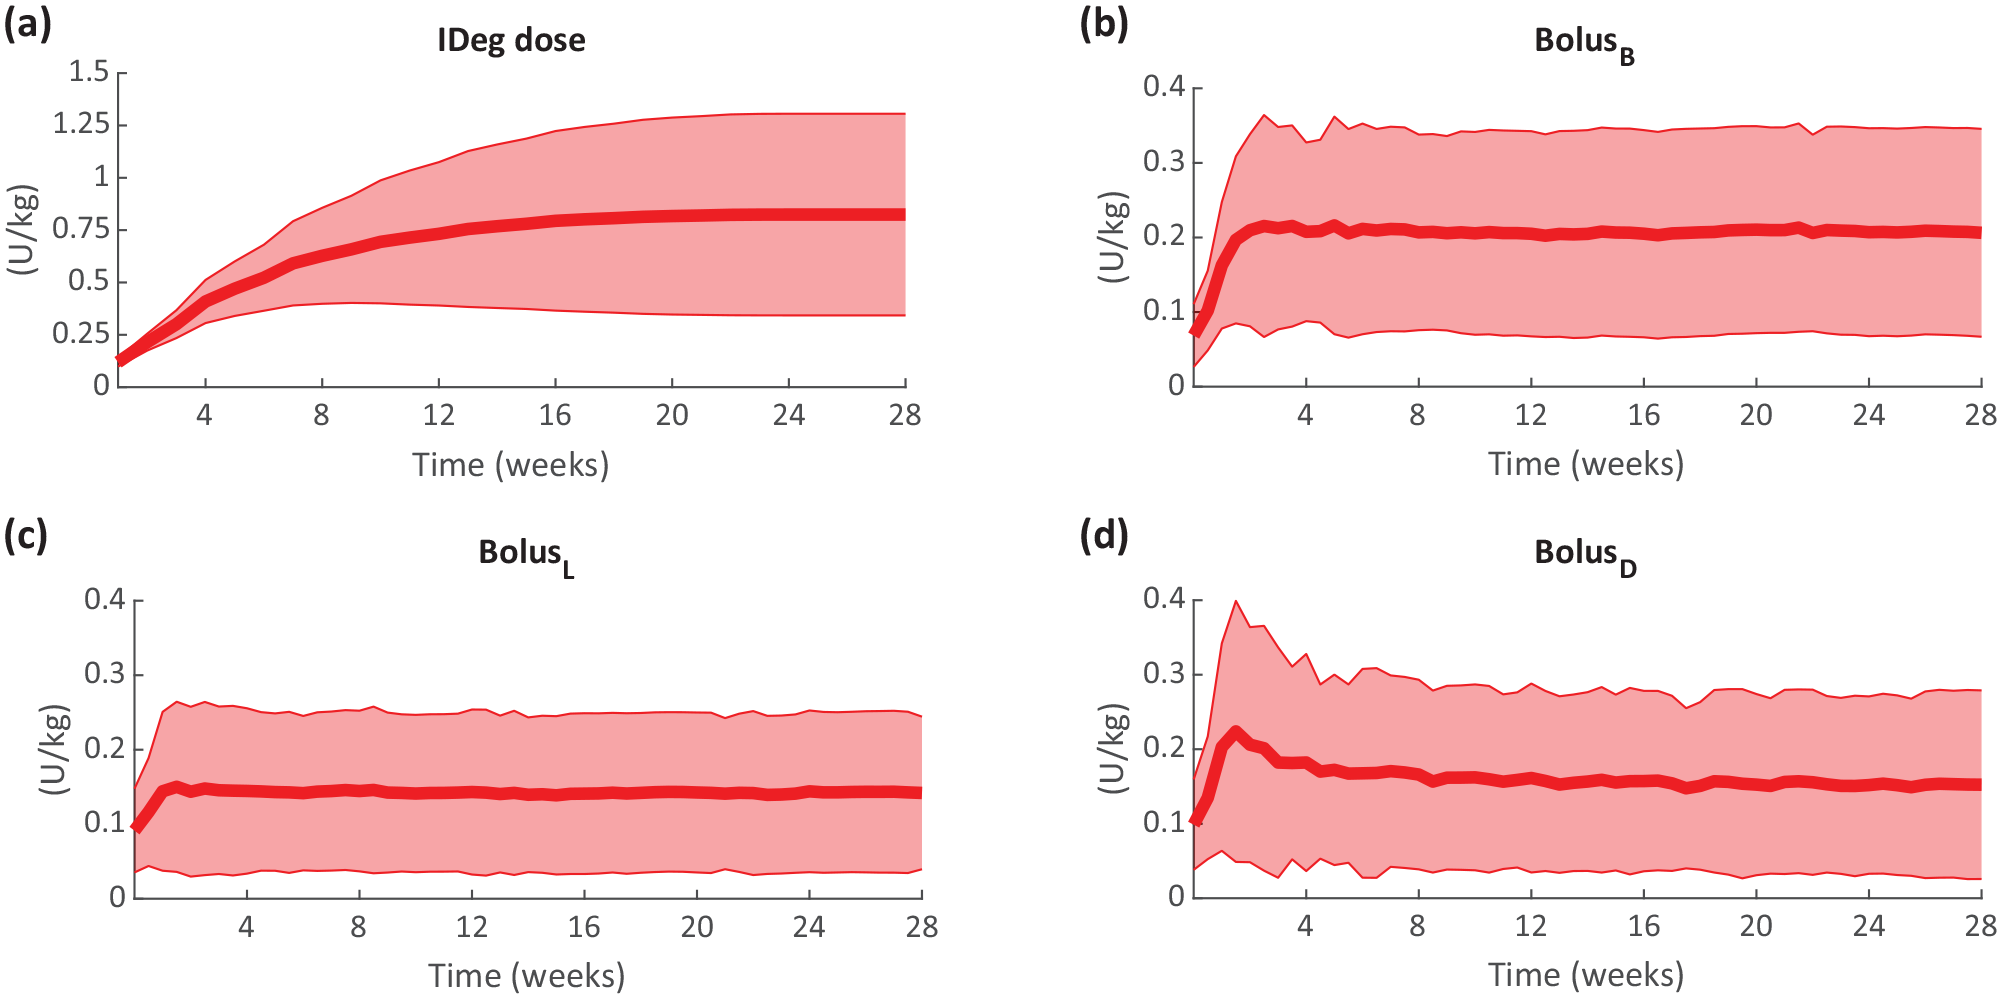
Progression of simulated basal insulin dose (iDeg, a) and bolus insulin at breakfast (BolusB, b), lunch (BolusL, c) and dinner (BolusD, d), obtained during the 6-month period. In silico data are reported as mean (thick line) ± standard deviation (shaded area).
Optimal Versus Impaired Adherence to MDI Therapy
In silico CGM time courses obtained with optimal (Scenario 1) versus impaired adherence to MDI therapy (Scenario 2) are shown in Figure 5. It can be noted that both CGM average and variability mostly differ among scenarios after lunch during working days and after dinner during weekends. In particular, Scenario 2 leads to more elevated glucose levels toward the hyperglycemic range.
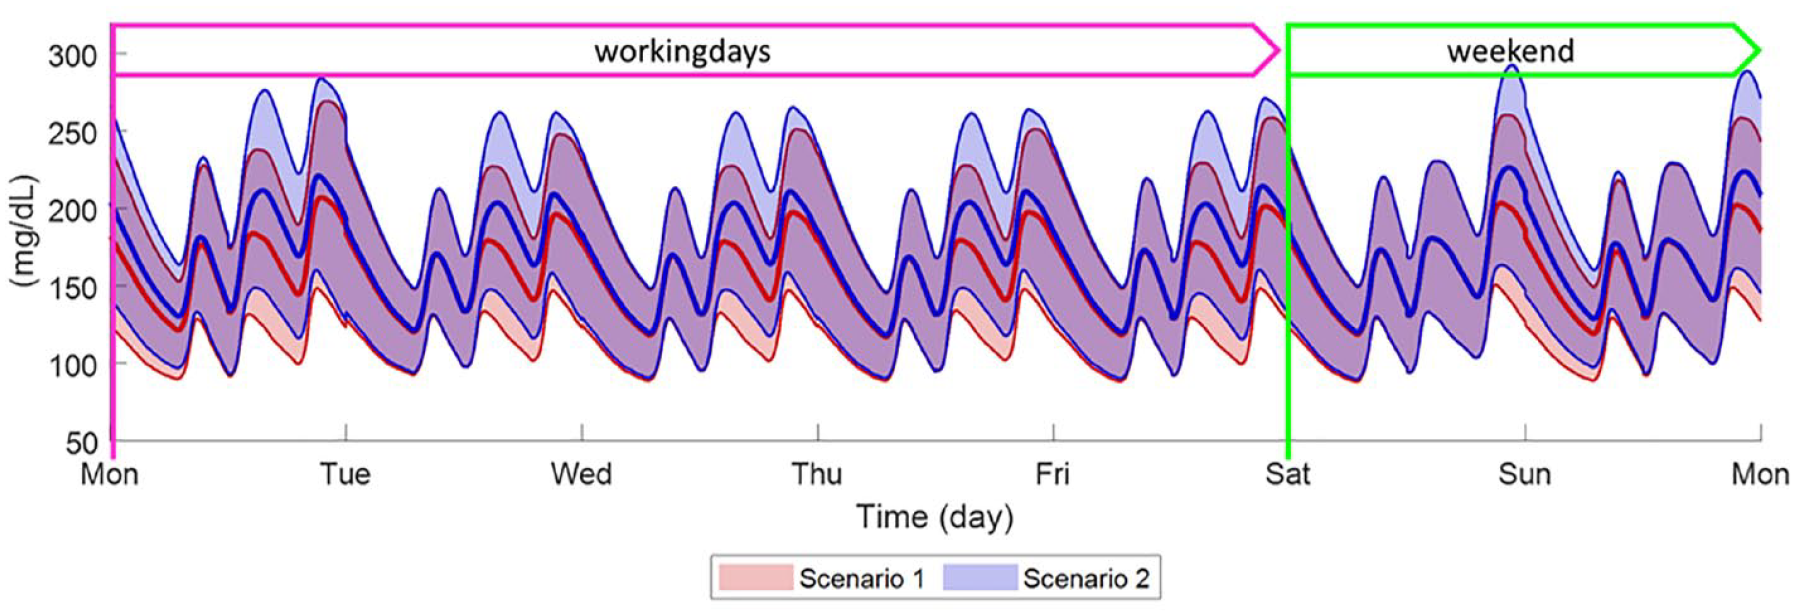
Comparison of weekly BG time courses obtained by simulating optimal therapy (Scenario 1, red line and shaded area) and delay/skip bolus in 65/35 ratio (Scenario 2, blue line and shaded area) in 100 in silico adults with T2D. Weekly BG are meant as average of 28 weeks. Data are reported as mean (continuous thick line) ± standard deviation (shaded area).
This result is confirmed by the distribution of CGM metrics (Table 1). Failing in adhering to MDI therapy resulted in a degradation of BG control, with statistically significant increase of glucose mean and variability (quantified by SD and CV), a reduction of Tt,70-180 by 38% (median percent relative change with respect to Scenario 1), and an increase of both Ta,180 and Ta,250 by 57% and 258%, respectively. However, the reduction of both Tb,70 and Tb,54 was statistically significant, but the associated risk of late postprandial hypoglycemia was not clinically relevant. The glucose control degradation also is noticeable in the long term, proven by the statistically significant (P < .001) increase of GMI.
Distribution of Glucose Control Outcome Metrics Obtained Under Optimal Therapy (Scenario 1) or Delay/Skip Bolus in 65/35 Ratio (Scenario 2).
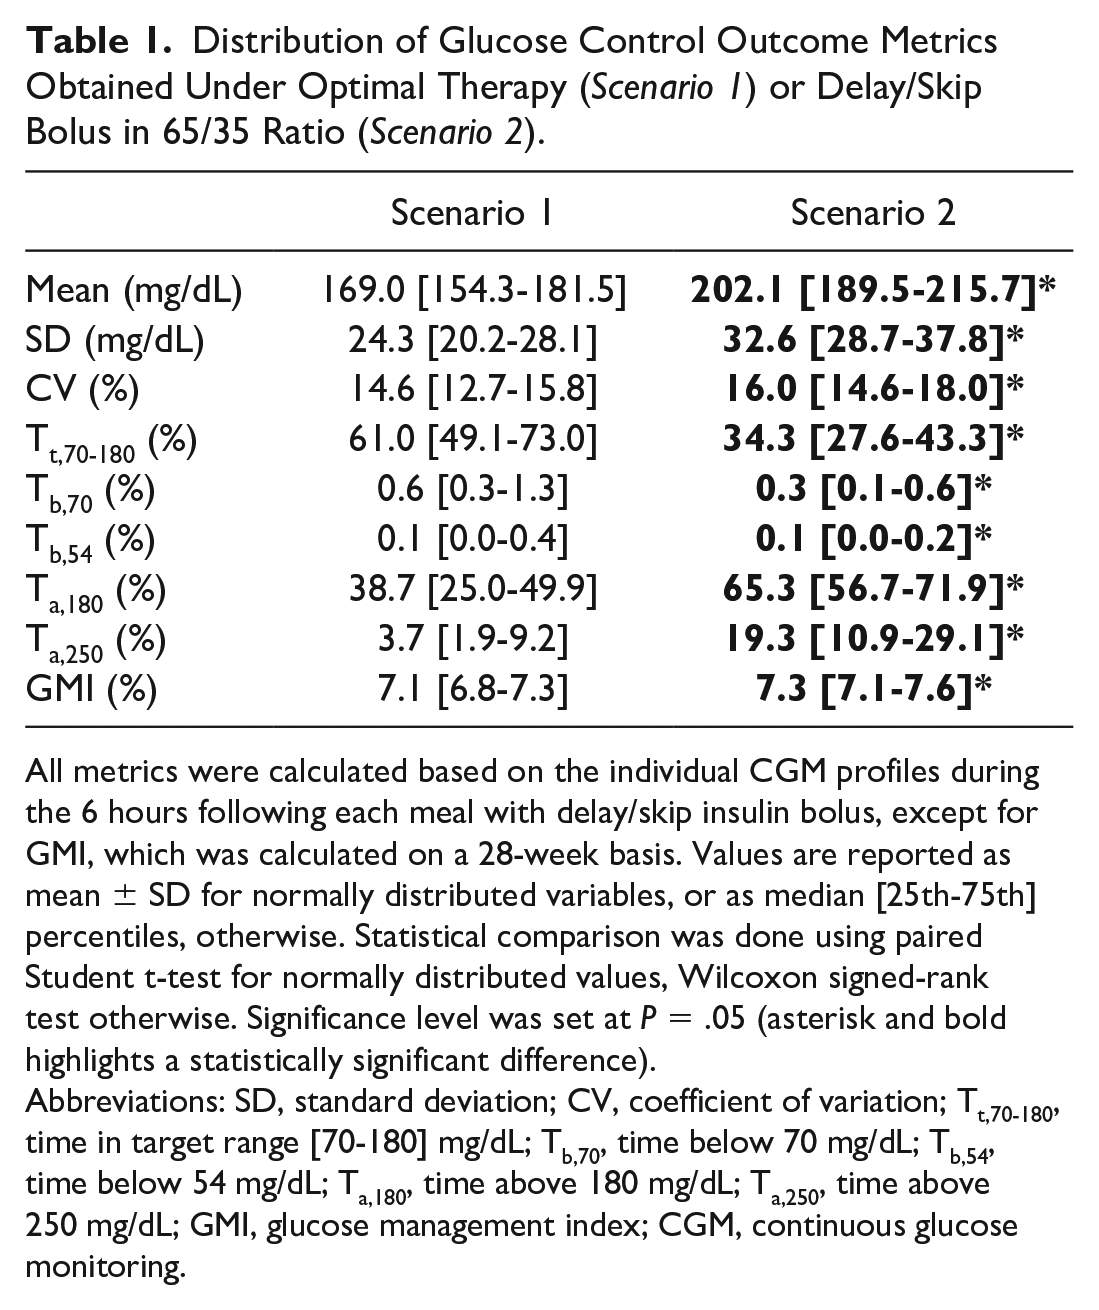
All metrics were calculated based on the individual CGM profiles during the 6 hours following each meal with delay/skip insulin bolus, except for GMI, which was calculated on a 28-week basis. Values are reported as mean ± SD for normally distributed variables, or as median [25th-75th] percentiles, otherwise. Statistical comparison was done using paired Student t-test for normally distributed values, Wilcoxon signed-rank test otherwise. Significance level was set at P = .05 (asterisk and bold highlights a statistically significant difference).
Abbreviations: SD, standard deviation; CV, coefficient of variation; Tt,70-180, time in target range [70-180] mg/dL; Tb,70, time below 70 mg/dL; Tb,54, time below 54 mg/dL; Ta,180, time above 180 mg/dL; Ta,250, time above 250 mg/dL; GMI, glucose management index; CGM, continuous glucose monitoring.
Discussion
This work evaluates in silico the impact of a nonadherence to MDI therapy on glucose control in people with advanced T2D. To achieve this aim, we exploited an in silico cloning technique to make the Padova T2D simulator (T2DS) able to well reproduce glucose regulation in insulin-dependent people with advanced T2D. To simulate MDI therapy, the T2DS was also equipped with PK models of both basal (iDeg) and prandial (lispro) insulins, and specific titration algorithms were implemented to determine, for each in silico subject, the optimal individual therapy parameters, i.e., insulin injection time and dose amount.
The in silico trial was designed to recreate a typical weekly routine, assuming T2D patients deviating from the perfect adherence to MDI therapy by delaying or skipping some meal insulin boluses. Such a situation is rather probable, and can be due to both lifestyle factors and psychosocial barriers (e.g., patients miss insulin injection at mealtime due to low attention, fear of embarrassment, and social stigma). 35 The resulting poor adherence translated into a BG control deterioration with prolonged percent time in hyperglycemia. This was particularly evident in the postprandial phases following delayed or skipped insulin meal bolus, while it was not clinically meaningful (even if still statistically significant) when calculated throughout the 24-hr time interval (data not shown). However, this is expected since the fasting overnight period is far from meal intakes, and thus less affected by nonadherence.
As mentioned in the introduction, nonadherence to MDI therapy has been widely studied in T1D, and the increased time in hyperglycemia is known occurring in this population as well. However, we evaluated whether impaired adherence has a similar or different impact on glucose control in the two populations, by performing the same in silico trial (i.e., both Scenarios 1 and 2) in the virtual T1D population of the UVA/Padova T1D Simulator. 36 Similarly to what was found in T2D, the glucose control outcome distribution revealed a degradation of glucose control toward increased hyerglycemic ranges and high average glucose (by means of GMI). Interestingly, the increase of time in hyperglycemia was significantly higher in T1D than T2D: percent relative changes of Ta,180 were 123 [59-274] in T1D versus 57 [23-148] in T2D (P < .001), percent relative changes of Ta,250 were 422 [216-1502] in T1D versus 258 [123-914] in T2D (P = .032). The lower increase of time in hyperglycemia observed in T2D population can be potentially explained by the T2D residual beta-cell function, that could compensate, even if minimally, for the inadequate exogenous insulin delivery. Indeed, by looking at the available in silico C-peptide concentrations in T2D (Figure 6), it can be observed that C-peptide secretion is increased in Scenario 2 versus Scenario 1, especially after working days lunches and during weekend dinners, with area under the C-peptide curve growing from 11.8 [3.6-32.8] 103 pmol min/L to 46.5 [26.2-77.0] 103 pmol min/L (P < .001) and maximum C-peptide concentration increasing from 134 [40-315] pmol/L to 410 [243-642] pmol/L (P < .001). However, glucose control degradation in the long term was statistically similar, with GMI increasing by 0.2% [0.1%-0.3%] in both T1D and T2D populations.
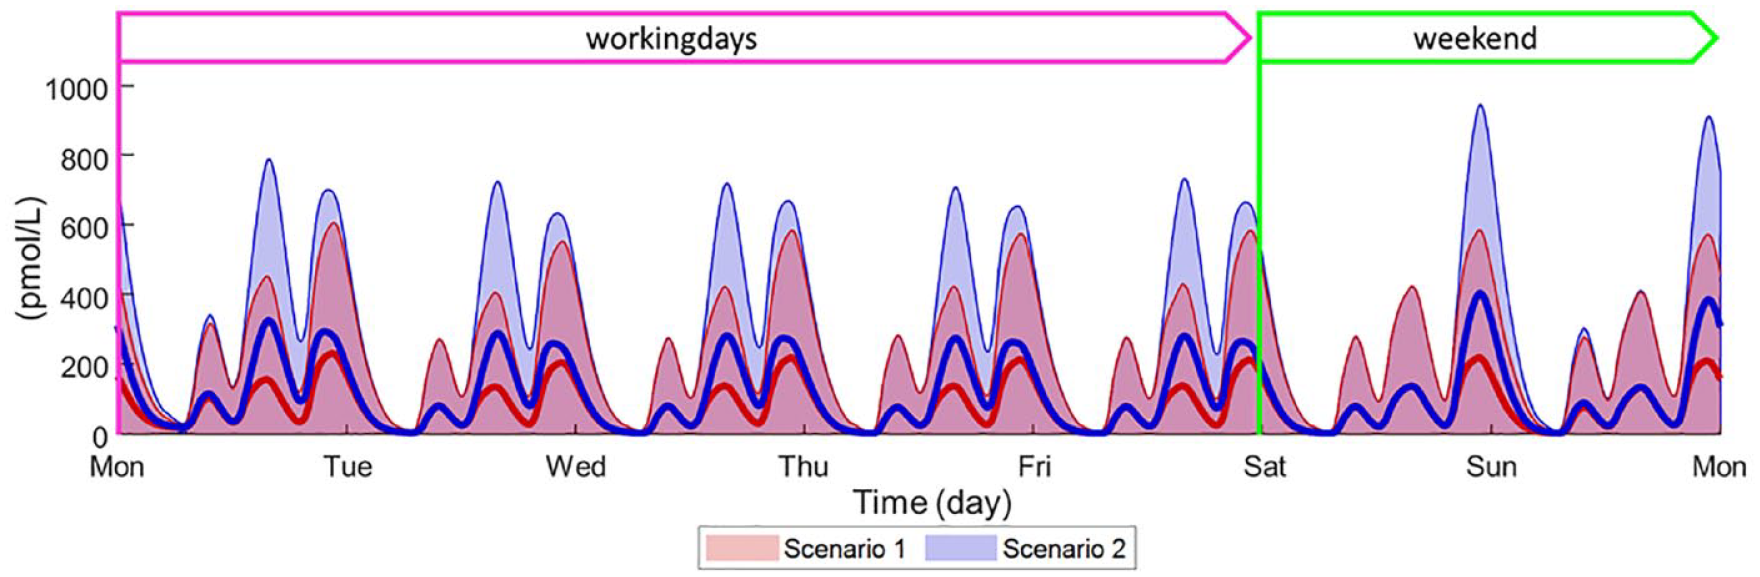
Comparison of weekly C-peptide time courses obtained by simulating optimal therapy (Scenario 1, red line and shaded area) and delay/skip bolus in 65/35 ratio (Scenario 2, blue line and shaded area) in 100 in silico adults with T2D. Weekly C-peptide are meant as average of 28 weeks. Data are reported as mean (continuous thick line) ± standard deviation (shaded area).
The differences observed between the two populations are in line with what was found in a prospective study analyzing people with T1D and T2D 37 and, implicitly, underline the importance of running in silico trials with the most appropriate population, to obtain reliable results for the target group. Indeed, a simulator able to well describe the dynamics of a specific population represents a reliable framework for supporting the development of targeted therapies and predictive algorithms to improve BG control and minimize diabetes complications.
Despite the positive results, this study presents some limitations. First, the usability of T2DS tailoring methodology relies on data availability. This approach has been established to cope with the lack of individual glucose tracer data for the target population, which precludes the possibility of building a population-specific covariance matrix employed for subject generation. This implies that the covariance matrix is assumed to be the same in both early- and advanced-stage T2D. Nevertheless, this limitation does not preclude the simulator reliability, as recently presented in Visentin et al. 24 : specifically, it was shown that the tailoring methodology allows the T2DS to well reproduce both average and variability outcomes observed in a real insulin-naïve T2D population.
It is also worth pointing out that the in silico trial assumed a precise model of meal distribution, 31 as well as insulin dosing strategies based on well-established guidelines.29,30 This was done to mimic, as much as possible, what occurs in real life. Nevertheless, future works will investigate the effect of nonadherence to insulin therapy under different conditions and alternative (e.g., preventive) dosing strategies.
Conclusion
In this article, we showed that impaired adherence to MDI therapy impacts glucose control in people with T2D on both short- and long-term scenarios, resulting in increased percent time spent in hyperglycemic ranges and higher GMI. Such findings were similar to what also occurs in T1D patients, however revealing that the residual endogenous insulin secretion in T2D contributes to mitigate the BG control degradation toward hyperglycemia due to the incorrect exogenous insulin administration. Despite this minimal physiological countermeasure, it is worth underlining that adhering to insulin schedule as much as possible is fundamental to guarantee the best glucose control management. In this direction, the proposed simulations as well as the basal-bolus T2DS environment can be further used as test bench for assessing the potential contribution of cutting-edge technologies to increase patients’ compliance and adherence to therapy, and to determine clinical differences of the impact of such technologies between people with T1D and T2D. This population-centric approach may help to minimize diabetes complications and optimize BG control.
Footnotes
Abbreviations
ADA, American Diabetes Association; B, breakfast; BG, blood glucose; CGM, continuous glucose monitoring; CHO, carbohydrates; CR, carbohydrate-to-insulin ratio; D, dinner; GMI, glucose management index; iDeg, insulin degludec; L, lunch; MMTT, mixed meal tolerance test; PK, pharmacokinetics; SD, standard deviation; SMBG, self-monitoring of blood glucose; T1D, type 1 diabetes; T2D, type 2 diabetes; UVA, University of Virginia.
Declaration of Conflicting Interests
The author(s) declared no potential conflicts of interest with respect to the research, authorship, and/or publication of this article.
Funding
The author(s) disclosed receipt of the following financial support for the research, authorship, and/or publication of this article: This work was funded by Becton, Dickinson and Company.