
Abstract
Objective:
Recent studies have provided new insights into nonlinearities of insulin action in the hypoglycemic range and into glucagon kinetics as it relates to response to hypoglycemia. Based on these data, we developed a new version of the UVA/PADOVA Type 1 Diabetes Simulator, which was submitted to FDA in 2013 (S2013).
Methods:
The model of glucose kinetics in hypoglycemia has been improved, implementing the notion that insulin-dependent utilization increases nonlinearly when glucose decreases below a certain threshold. In addition, glucagon kinetics and secretion and action models have been incorporated into the simulator: glucagon kinetics is a single compartment; glucagon secretion is controlled by plasma insulin, plasma glucose below a certain threshold, and glucose rate of change; and plasma glucagon stimulates with some delay endogenous glucose production. A refined statistical strategy for virtual patient generation has been adopted as well. Finally, new rules for determining insulin to carbs ratio (CR) and correction factor (CF) of the virtual patients have been implemented to better comply with clinical definitions.
Results:
S2013 shows a better performance in describing hypoglycemic events. In addition, the new virtual subjects span well the real type 1 diabetes mellitus population as demonstrated by good agreement between real and simulated distribution of patient-specific parameters, such as CR and CF.
Conclusions:
S2013 provides a more reliable framework for in silico trials, for testing glucose sensors and insulin augmented pump prediction methods, and for closed-loop single/dual hormone controller design, testing, and validation.
The development of artificial pancreas control algorithms in the past few years has been accelerated by computer simulation; for example, in silico testing has provided directions for clinical studies and ruling out of ineffective control scenarios in a cost-effective manner.1,2 To the best of our knowledge the first example of a closed-loop system for an artificial pancreas was designed in silico and used in the ADICOL project. 3 However, the extensive use of computer simulation started in 2008 when a paradigm change occurred in the field of type 1 diabetes mellitus (T1DM): for the first time a computer model has been accepted by FDA as a substitute for preclinical trials of certain insulin treatments, including closed-loop algorithms. 4 This UVA-PADOVA Type 1 Diabetes Simulator (S2008) emulated meal challenges and included a population of 300 in silico subjects (100 adults, 100 adolescents, 100 children). Each virtual subject was represented by a model parameter vector, which was randomly extracted from an appropriate joint parameter distribution. The S2008 has been successfully used by 32 research groups in academia, as well as by companies active in the field of T1DM; simulation results were presented by 63 publications in peer-reviewed journals.
Recently new data and models have become available on hypoglycemia 5 and counterregulation.6,7 This put us in the position to add new features and models leading to a new degree of accuracy of this important simulation tool. To further increase the simulator quality, new rules for determining CSII parameters of the virtual patients have been implemented and a new statistical strategy for virtual patient generation has been adopted. This article presents the new features of the UVA-PADOVA Type 1 Diabetes Simulator, version S2013, submitted to FDA in April 2013.
Method
T1DM Simulator 2008 (S2008)
The Model
The model describing the glucose-insulin system during a meal is described in detail in Kovatchev et al. 4 Its schematic representation is shown in Figure 1 (white and gray blocks). Briefly, the model puts in relation plasma concentrations, that is, glucose G and insulin I, with glucose fluxes, that is, endogenous glucose production (EGP), glucose rate of appearance (Ra), glucose utilization (U), renal extraction (E), and insulin fluxes, that is, rate of insulin appearance from the subcutaneous tissue (SC) and insulin degradation (D). The glucose subsystem consists of a 2-compartment model: insulin-independent utilization occurs in the first compartment, representing plasma and rapidly equilibrating tissues, while insulin-dependent utilization occurs in the second compartment, representing slowly equilibrating tissues. The insulin subsystem is also described with 2 compartments, representing liver and plasma, respectively. Subcutaneous insulin kinetics is represented by a 3-compartment model. Endogenous glucose production is assumed to be linearly dependent on plasma glucose concentration and a delayed insulin signal. Glucose rate of appearance is described with a model of glucose transit through the stomach and intestine, with the stomach represented by 2 compartments, while a single compartment is used to describe the gut; the rate constant of gastric emptying is a nonlinear function of the amount of carbohydrates in the stomach. Glucose utilization during a meal has 2 components: insulin-independent utilization by the brain and the erythrocytes takes place in the first compartment and is constant, while insulin-dependent utilization takes place in the remote compartment and depends nonlinearly from glucose in the tissues. Here we report the equations describing insulin-dependent utilization, Uid(t), and endogenous glucose production, EGP(t), of S2008, to evidence the modifications incorporated in S2013, described in the following section.
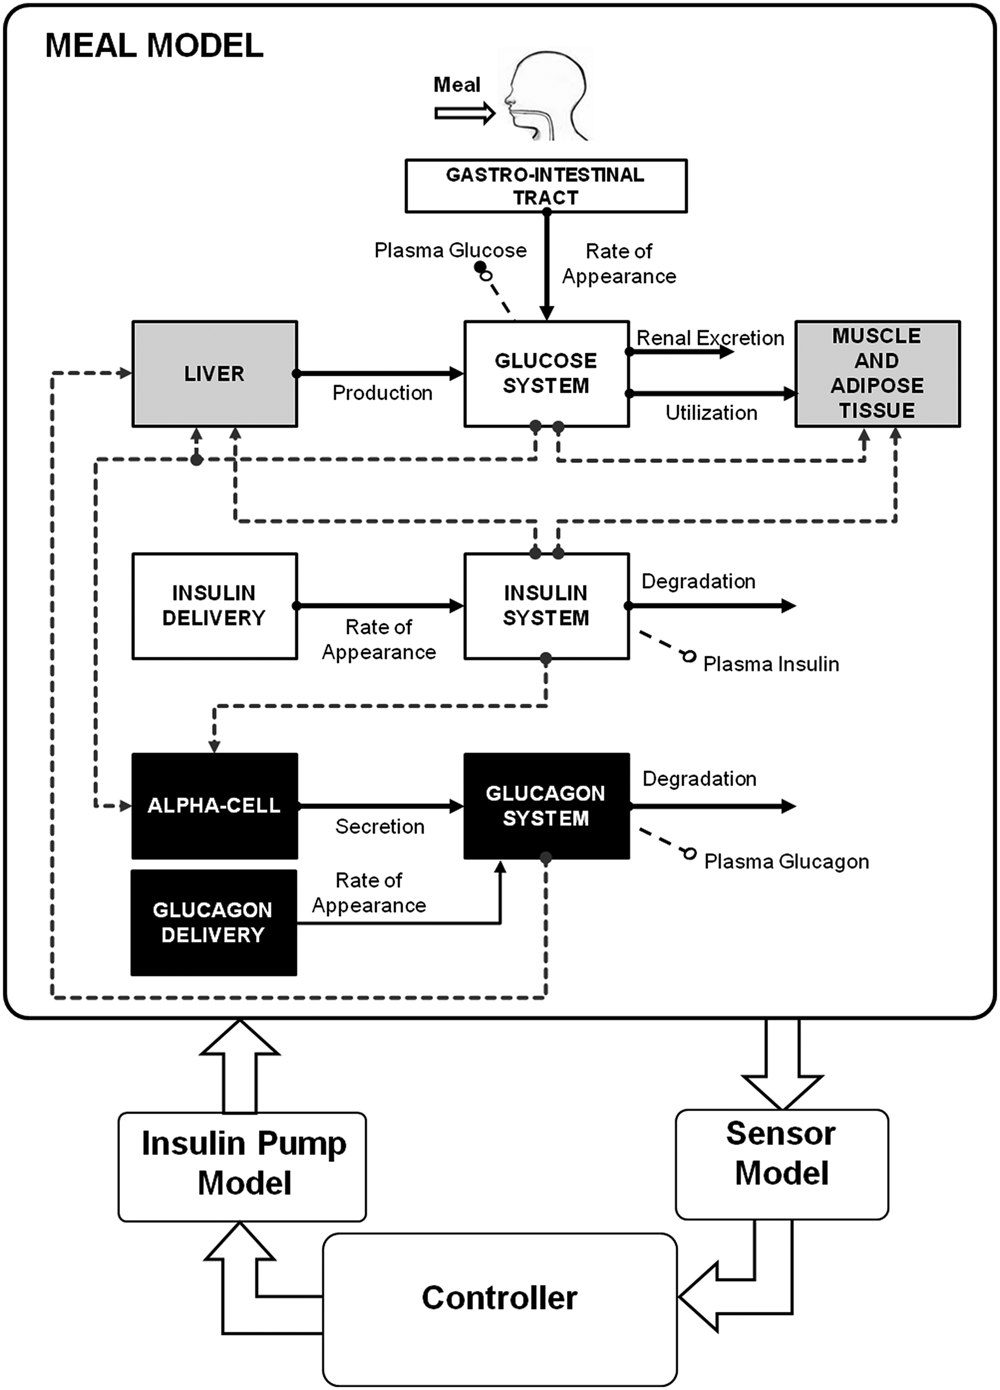
Scheme of the model included in the FDA-accepted T1DM simulator. White blocks are the unit processes of S2008 4 (gastro-intestinal tract, glucose kinetics and insulin kinetics); gray blocks are those that have been updated in the S2013 to account for counterregulation (liver, muscle, and adipose tissue); black blocks are new (alpha cell, glucagon kinetics, and delivery).
The model of glucose kinetics is described by,
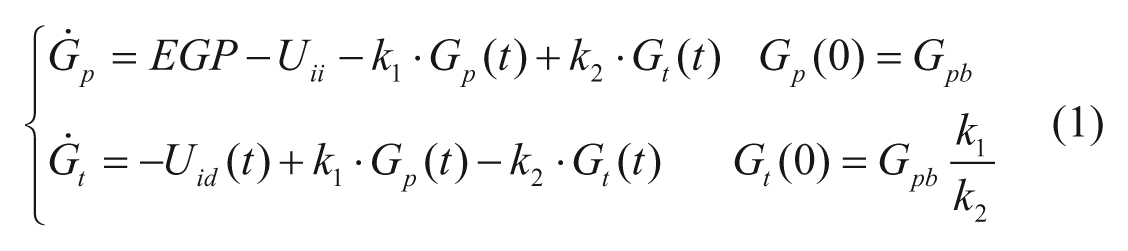
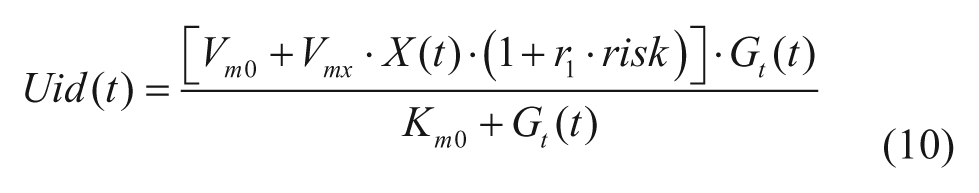
with Gp(t) amount of glucose in plasma, Gt(t) amount of glucose in the tissue, and k1 and k2 rate parameters. The insulin-independent utilization by the brain and the erythrocytes (Uii) takes place in the first compartment and is constant. The insulin-dependent utilization (Uid) takes place in the remote compartment and depends from glucose in the tissues by a Michaelis–Menten relationship,
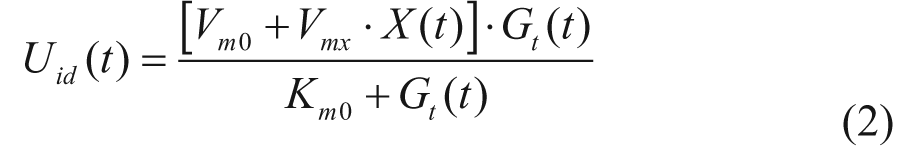
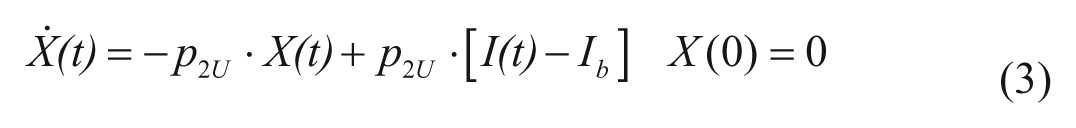
with X(t) insulin action on glucose utilization and Vm0, Vmx, Km0, p2U rate parameters.
The EGP model is,


with Gp(t) glucose amount in the plasma compartment, XL(t) delayed insulin action in the liver, and ki, kp1, kp2, kp3 rate parameters.
T1DM Virtual Subjects
The S2008 is equipped with 100 virtual adults, 100 adolescents and 100 children. These T1DM populations have been generated by randomly extracting, from joint parameter distributions, different realizations of the parameter vector, that is, the vector that includes the whole parameter set of the model. At the time of the first release of the simulator, reliable joint parameter distributions were available for a nondiabetic adult population. 4 Thus, the T1DM parameter joint distributions were derived from those available in the nondiabetic adult populations. In particular, the intersubject variability was assumed to be the same (same covariance matrix), but certain clinically relevant modifications were introduced in the average parameter vector. For instance, basal endogenous glucose production was assumed to be higher in T1DM subjects. Similarly, parameter distributions in children and adolescent were obtained from T1DM adults by introducing some changes in the average parameter vector, for example, insulin sensitivity was assumed higher in children and lower in adolescents compared to adults. 4
T1DM Simulator 2013 (S2013)
S2013 presents several important improvements with respect to S2008, both on the model on which the simulator is based, but also on the joint parameter distribution, the definition of clinically relevant parameters, and the strategy for virtual patient generation.
New Model
The scheme of the glucose model of the S2013 is shown in Figure 1: white blocks represent the unit processes that are the same of S2008 (gastro-intestinal tract, glucose and insulin kinetics), gray blocks have been updated to account for counterregulation (liver, muscle, and adipose tissue), and black blocks are new (alpha cell, glucagon kinetics, and delivery). Specifically, the model of Kovatchev et al 4 was modified as follows (see appendix for the complete set of model equations).
Glucagon secretion and kinetics
Glucagon kinetics are described with a 1-compartment linear model 8 :
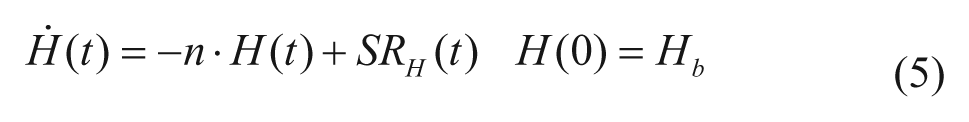
with H(t) plasma hormone concentration, SRH(t) glucagon secretion (
Glucagon secretion is described as the sum of 2 components:

with
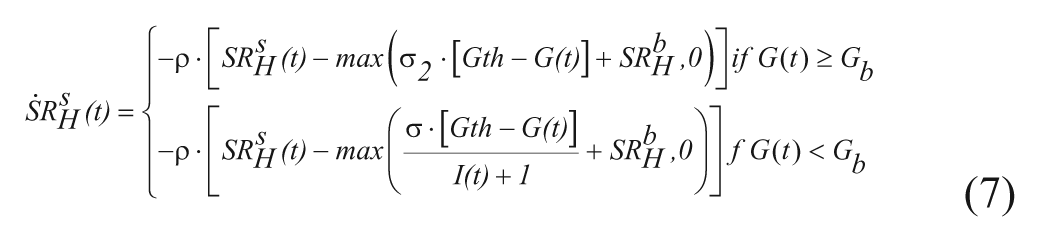
with G(t) plasma glucose (Gb its basal value), I(t) plasma insulin concentration (Ib its basal value), σ and σ2 alpha-cell responsivity to glucose level, 1/ρ delay between static glucagon secretion and plasma glucose. In this way, static secretion is stimulated when G<Gb (but modulated by insulin) and inhibited when G≥Gb.
The second component is proportional to glucose rate of change,
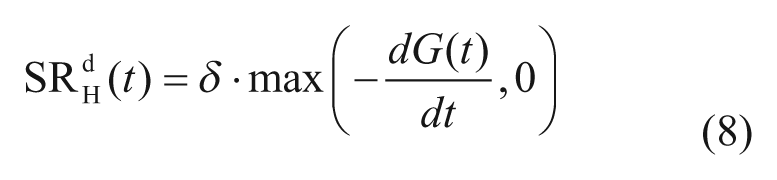
with dG(t)/dt glucose rate of change, and δ alpha-cell responsivity to glucose rate of change.
Model parameters σ and δ also reflect that glucagon response declines with age of diabetes (see also the “New Joint Parameter Distribution” section below).
Of note, in real life, glucagon secretion is almost certainly dependent on insulin level in the alpha cells (paracrine effect), not in the circulation. However, it is very difficult to model the intrapancreatic levels, so the use of plasma insulin was the best we could do, even if not perfectly physiologic.
Glucagon action
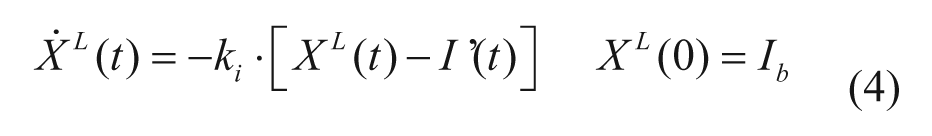
The model of glucagon action is based on the EGP model reported in equation (4), but assumes that EGP is stimulated by the above basal glucagon concentration with some delay,
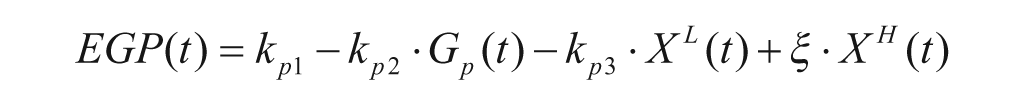


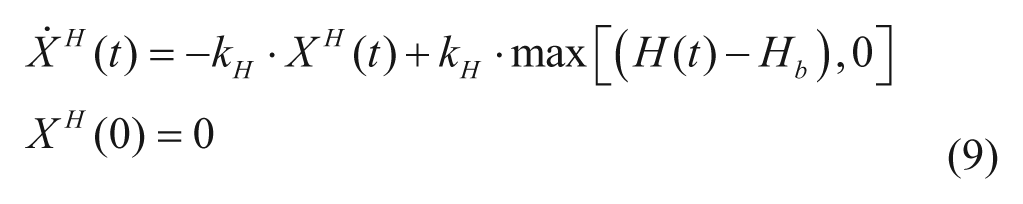
with H(t) plasma glucagon concentration, XH(t) delayed glucagon action on EGP, ξ liver responsivity to glucagon, and 1/kH delay between glucagon concentration and action.
Glucose utilization in hypoglycemia
The model of glucose utilization reported in equations (2) and (3) is unable to describe well the hypoglycemic range likely due to an inadequate description of insulin action, which paradoxically increases when glucose decreases under a given threshold. This phenomenon has been described during hyperinsulemic clamps in T1DM.9,10 Based on these observation we developed a new model that assumes that insulin-dependent utilization Uid(t) increases when glucose decreases below a certain threshold, following the blood glucose risk function: 11
where
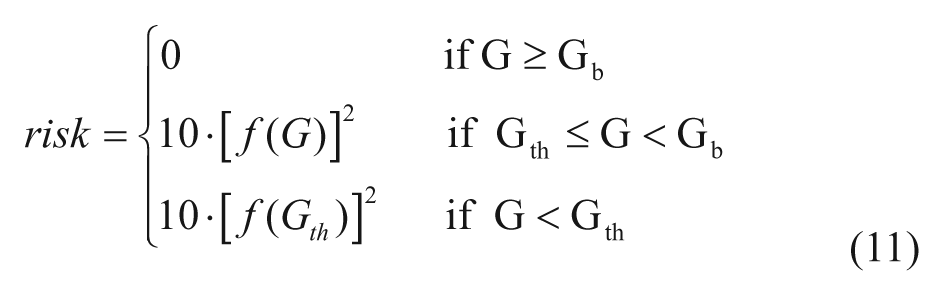
with Gb basal glucose, Gth the hypoglycemic threshold (set at 60 mg/dl),
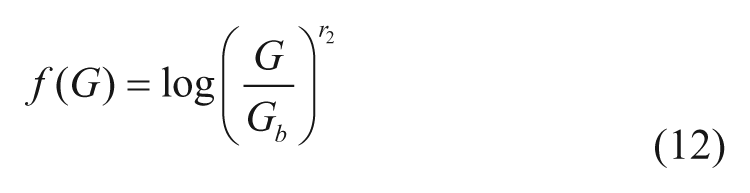
and r1, r2 model parameters.
The model was validated on 32 T1DM (age 38 ± 12 years, height 174 ± 10 cm, weight 78 ± 12 kg), which underwent a hyperinsulinemic euglycemic and hypoglycemic clamp, where hypoglycemia is induced at a descending rate of 1 mg/dl/min until 50 mg/dl glucose value is reached. However, the protocol did not include tracer administration, which would have enabled the estimate of endogenous glucose production and thus the use of the system decomposition and forcing function strategy. Thus the only model capable of describing the data is the glucose minimal model, 12 which couples insulin action on glucose utilization and production,
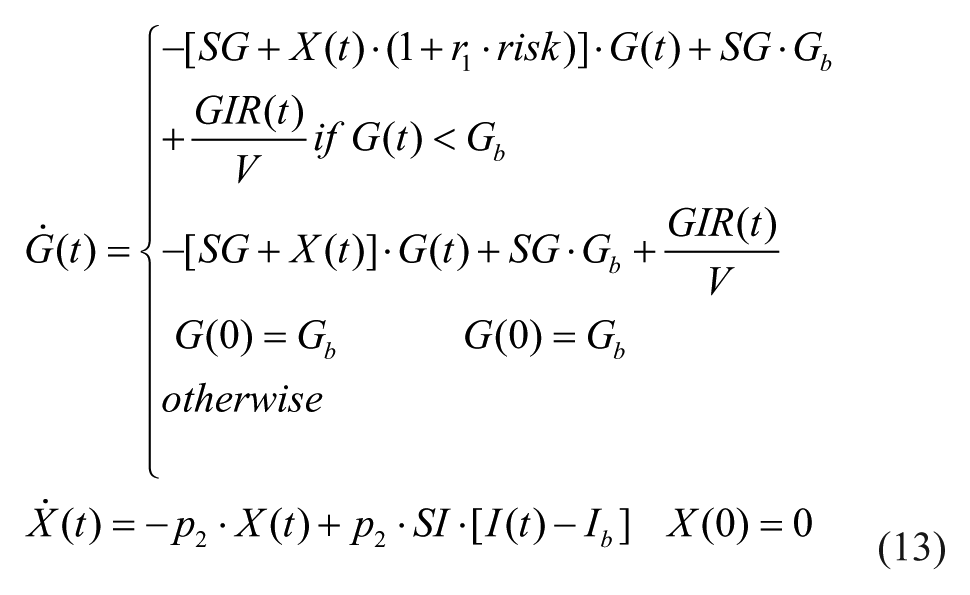
where G(t) is plasma glucose concentration, I(t) is plasma insulin concentration, GIR(t) is exogenous glucose infusion rate, SG, SI, and p2 are model parameters, and risk is defined as in (11-12).
For model identification, a glucose threshold of 60 mg/dl was defined together with its corresponding time
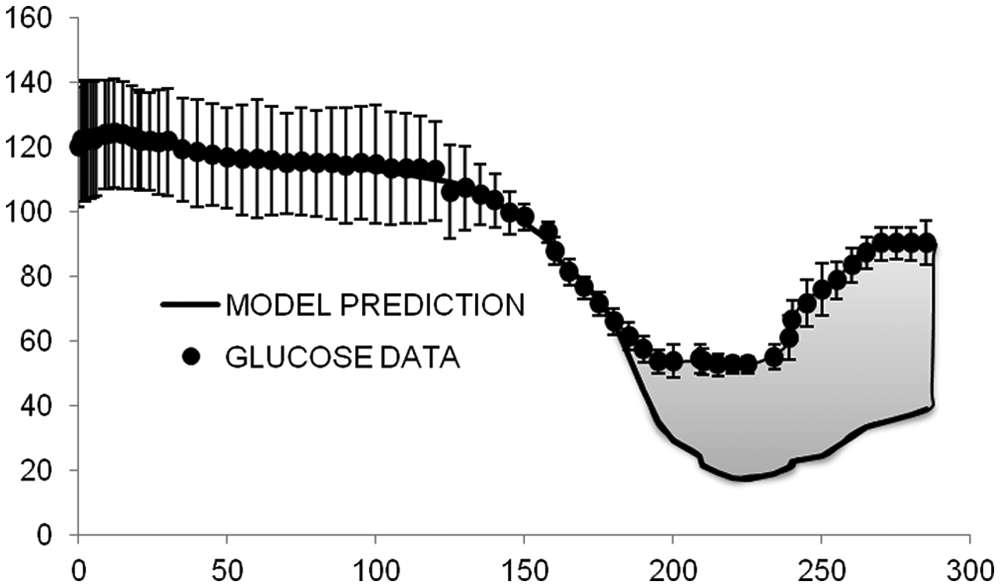
Average model prediction against glucose data in 32 T1DM subjects (unpublished). The gray area represents the counterregulation needed to return in normal glycemia (vertical bars are standard deviations).
Subcutaneous glucagon transport
As the employment of subcutaneous glucagon in a closed-loop system has received more attention (see, eg, El-Khatib et al), 13 the simulation platform necessitates including a pharmacokinetic model of exogenous glucagon to reproduce its appearance in plasma, its action controlled by the model described previously.
S2013 incorporates a recently proposed model, which describes subcutaneous glucagon transit with a 2-compartment model, 14
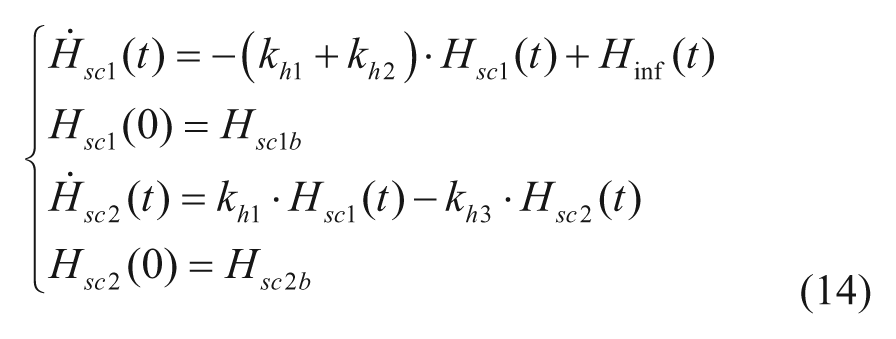
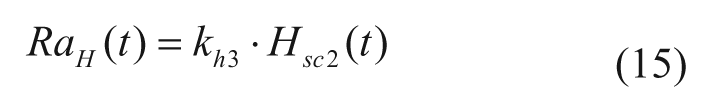
where khi are rate parameters describing subcutaneous glucagon kinetics, Hinf is the glucagon infusion rate, and Hsc1 and Hsc2 are glucagon concentrations in the subcutaneous space.
This model was assessed on a clinical data set kindly provided by Dr Damiano’s group (Boston University), which was collected in a bihormonal closed-loop clinical trial. 15 The data consist of 11 adults with T1DM (age: 40 ± 16 years, weight: 83 ± 13 kg, BMI: 28 ± 3 kg/m2, diabetes duration: 23 ± 13 years; and HbA1c: 7.3 ± 0.8%). The patients were studied for 27 hours, during which they were given 3 regular carbohydrate-rich meals. Some patients enrolled twice and were studied with a separation of at least 5 months, leading to 13 data sets available for analysis.
We acknowledge that the way this model was built suffers some important limitations. In particular, it was hard to isolate the effect of insulin on the response to glucagon since insulin is constantly changing. Furthermore, glucagon is given repeatedly in this type of study. However, these data were helpful to developing a quantitative model of subcutaneous glucagon kinetics.
New Joint Parameter Distribution
The inclusion of the risk function to the description of insulin dependent utilization makes the choice of the basal glucose (Gb) potentially critical: insulin sensitivity starts increasing, following the risk function, as soon as glucose falls below the basal value. In S2008, Gb was randomly generated from the joint distribution with an average of 140 mg/dl (chosen to reflect the knowledge available to the authors at that time). However, Gb should correspond to patient glucose target, since it is the glucose level reached with optimal basal insulin infusion, in absence of external perturbation, like meals and physical activity. In our recent closed-loop T1DM clinical trials glucose target was around 120 mg/dl on average. Thus, in S2013, Gb was randomly generated from the joint distribution with an average of 120 mg/dl. For what concerns the new parameters of the model (r1, r2, Hb, n, ξ, ρ, and kH), they were randomly generated from an appropriate joint distribution. The generation of the glucagon secretion parameters (σ and δ) was more complex as it has been shown that glucagon secretion is dependent on the duration of diabetes;15-17 that is, counterregulatory response wanes with duration of diabetes 15 following a logarithmic relationship. The in silico population of S2008 did not contain duration of T1DM but only age. Thus, we needed to associate duration of T1DM to each in silico subject in a way that it was compatible with model parameters related to glucagon secretion. Using literature on T1DM incidence,18-22 we generated a distribution of age at onset (which then can be easily transformed in T1DM duration by using the subject’s age). Random sampling form this distribution, conditioned by age of in silico patient, allowed the generation of the duration of T1DM for each in silico subject, while respecting the incidence characteristics of the disease. The choice to include glucagon secretion was based on our recent data in T1DM 23 showing a nonnegligible glucagon secretion. However, since not all the authors report the same slow decline in glucagon secretion found in Lorenzi et al 15 (see, eg, Siafarikas et al), 16 future versions of the simulator may include the possibility for the user to define the residual glucagon secretion in the population.
Determination of CR and CF
In real patients, CR and CF are empirically determined from patient history/habits and physician experience. At variance with S2008, where some theoretical definition of CR and CF were implemented, here we used the following definitions, which mimic as much as possible the criterion used to empirically determine them in real patients.24-27
CR was determined with the following simulation. Each subject receives 50 g of CHO, starting from his basal level. The optimal insulin bolus is determined so that (1) glucose concentration, measured 3 hours after the meal, is between 85% and 110% of the basal; (2) the minimum glucose concentration is above 90 mg/dl; and (3) the maximum glucose concentration is between 40 and 80 mg/dl above the basal level. CR is then calculated as the ratio between the amount of ingested CHO and the optimal insulin bolus:
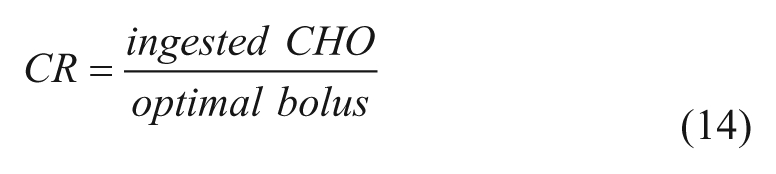
CF was determined with the so-called 1700 rule, 27 that is,
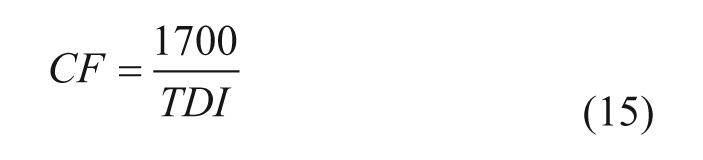
where TDI is the total daily insulin, determined for each virtual patient, using optimal CR and basal infusion rate, and assuming an average diet of 180 g of CHO for adolescents and adults and 135 g for children.
New Virtual Subject Generation
In S2008, the virtual subjects were randomly extracted from a given joint parameter distribution. However, due to the randomness of the generation, the procedure may potentially produce physiologically nonplausible parameters in some in silico patient.
Thus, in the S2013, we introduced new criteria for virtual subject generation. In particular, only subjects who met the following criteria have been included in the new in silico population: (1) CR ≤ 30 g/U for adult and adolescents and CR ≤ 40 g/U for children; (2) steady state glucose in absence of insulin infusion > 300 mg/dl; and (3) Mahalanobis distance lower than that corresponding to the 95% percentile.
Simulation Environment
The S2013 is implemented in MATLAB® R2012. The simulation environment is similar to that of S2008. In particular, the main user interface window of the software (Figure 3) allows one (1) to define a testing scenario, that is, a schedule of meals with corresponding CHO amounts; (2) to select subjects for running the desired scenario; (3) to select the hardware, for example, a particular glucose sensor and insulin pump; (4) to select a set of outcome metrics, for example, average glycemia, temporal glucose variability, and associated risks for hypoglycemia and hyperglycemia. Several graphical results are also available, for example, glucose traces, individual Poincaré plots of glucose dynamics, and control variability grid analysis (CVGA). 28
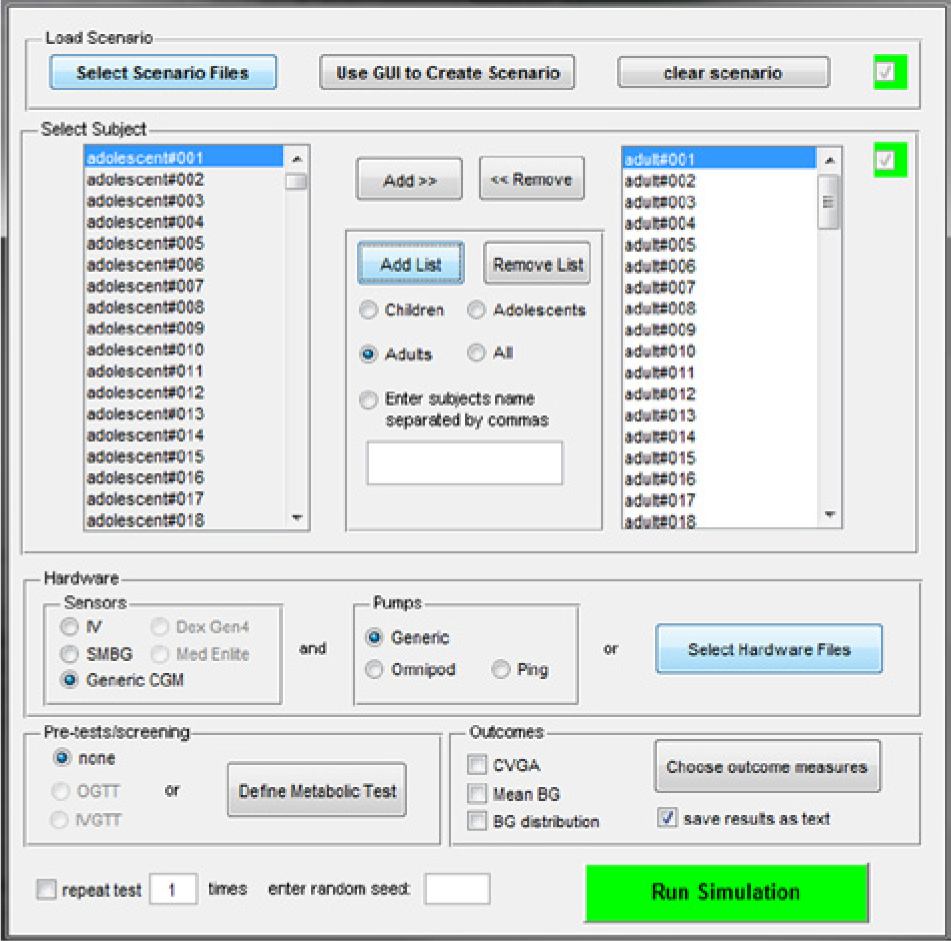
The user interface window of S2013.
Simulation Results
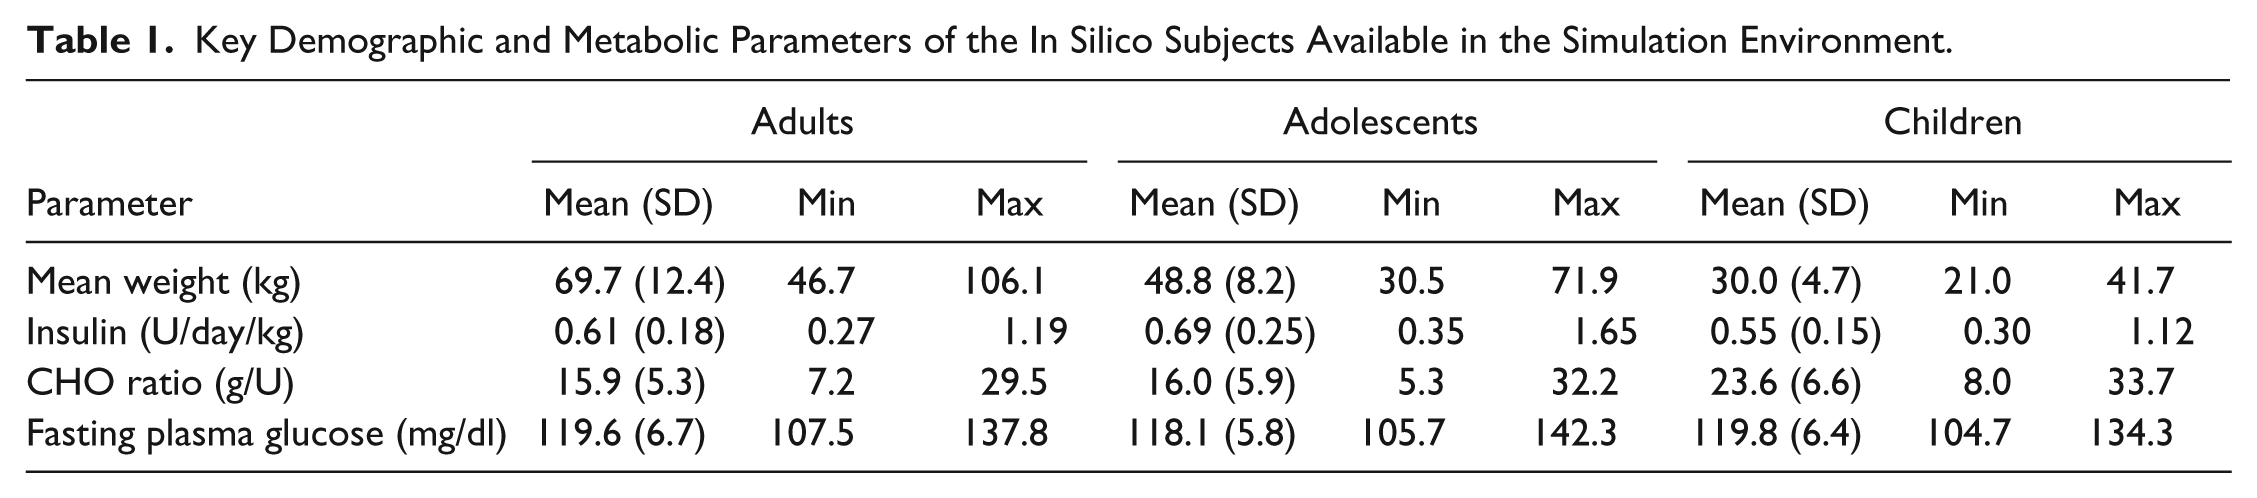
One hundred in silico adults, adolescent, and children have been generated using the above described criteria. Average and range (minimum and maximum) of the main metabolic parameters in the 3 groups are reported in Table 1.
Key Demographic and Metabolic Parameters of the In Silico Subjects Available in the Simulation Environment.
The distributions of in silico CR and CF in the 3 populations are shown in Figure 4. They well reproduce the distribution observed in real patients. In particular, CFs in children are higher than in adolescents and adults, reflecting both the higher insulin sensitivity and the lower body weight.
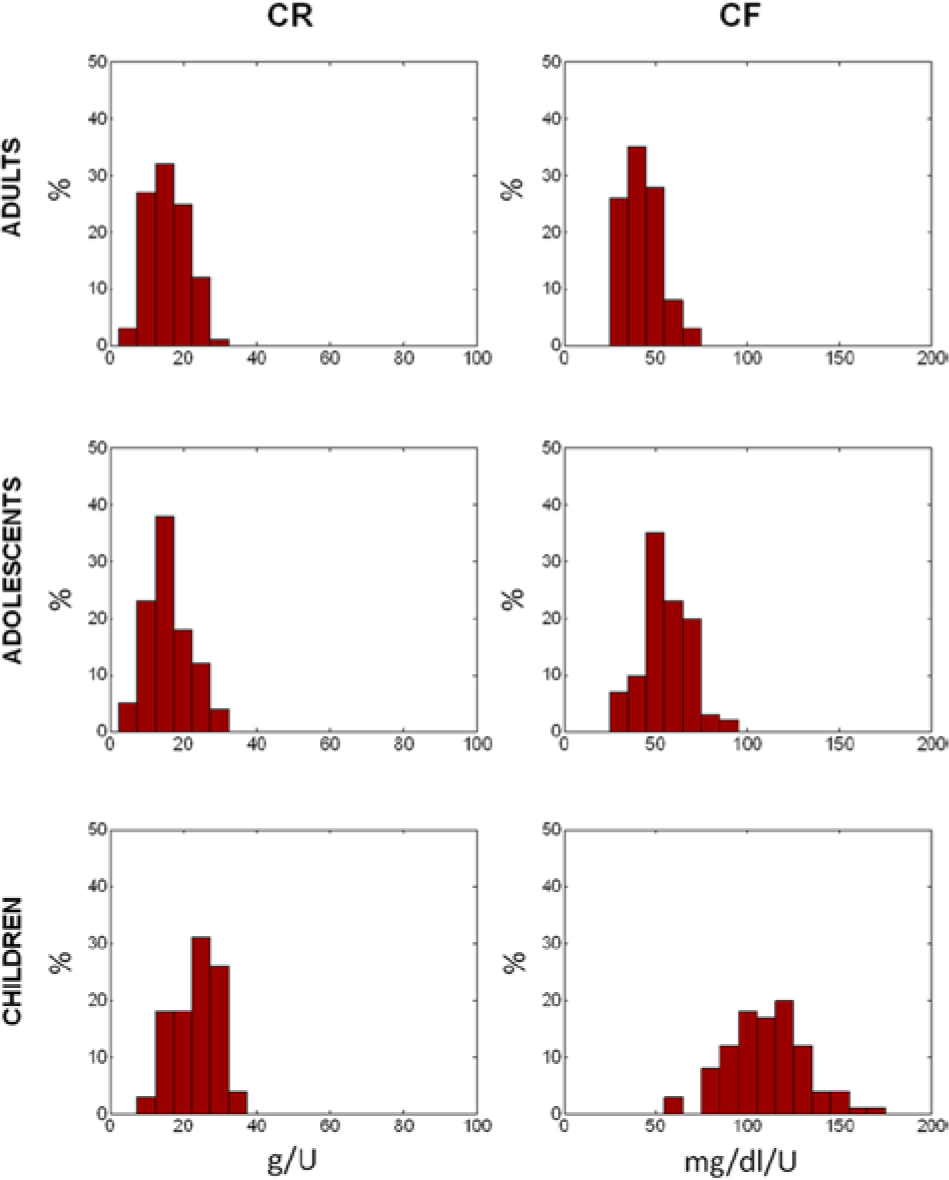
Simulated distribution of insulin to carbs ratio (CR, left) and correction factor (CF, right panels), in adult (upper), adolescent (middle), and children (lower panels) populations.
Plasma glucose, insulin, and glucagon concentration profiles of the 100 in silico adults, adolescent and children receiving 50 g of carbs at 8:00
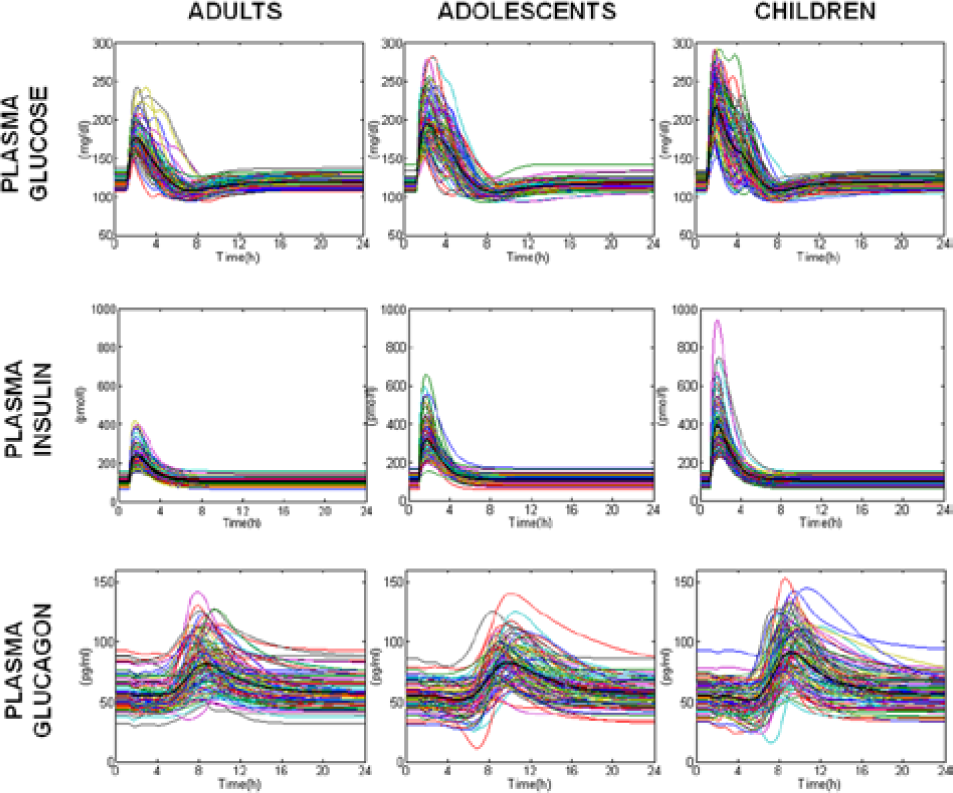
Simulated plasma glucose (upper), insulin (middle), and glucagon (lower panels) in the 100 in silico adults (left), adolescents (middle), and children (right panels).
Conclusions
S2013 has been described focusing on the new features introduced with respect to the S2008. 4 In particular, a new module describing glucose kinetics in hypoglycemia has been added. This also required the addition of a module describing counterregulation, that is, glucagon kinetics, secretion, and action, which is essential, first, to describe well hypoglycemic phenomena and, second, in view of possibly testing dual hormone control algorithms.
S2013 has been also improved in the virtual patient generation and characterization. In particular, we introduced a more realistic definition of important clinical parameters, such as insulin to carbs ratio and correction factor. Then, we implemented new criteria for virtual subject generation to automatically discard subjects with a nonplausible physiological behavior.
Simulation results have been presented for single meal optimal open-loop therapy in adult, adolescent, and children populations. S2013 provides a more reliable framework for in silico trials for regulatory purposes, for testing glucose sensors and insulin augmented pump prediction methods, and for closed-loop single/dual hormone controller design, testing, and validation. However, it is worth noting that both S2008 and S2013 simulators have been validated and accepted by FDA for a single meal scenario only. Multiple meal scenarios can obviously be simulated, but since the simulator does not include time-varying parameters, the results would not be realistic. Inclusion of meal-by-meal and day-by-day parameter variations in the simulator is under investigation. We anticipate that the first step will be the incorporation of insulin sensitivity meal-by-meal variation as reported in Hinshaw et al. 23
Footnotes
Appendix
Abbreviations
CF, correction factor; CHO, carbohydrates; CR, insulin to carbs ratio; CSII, continuous subcutaneous insulin infusion; CVGA, control variability grid analysis; D, insulin degradation; E, renal extraction; EGP, endogenous glucose production; FDA, Food and Drug Administration; Ra, glucose rate of appearance; S2008, Type 1 Diabetes Simulator 2008; S2013, Type 1 Diabetes Simulator 2013; SC, rate of insulin appearance from the subcutaneous tissue; T1DM, type 1 diabetes mellitus; U, glucose utilization; UVA, University of Virginia.
Declaration of Conflicting Interests
The author(s) declared no potential conflicts of interest with respect to the research, authorship, and/or publication of this article.
Funding
The author(s) disclosed receipt of the following financial support for the research, authorship, and/or publication of this article: This study was supported by JDRF grant no. 17-2011-273 and Italian Ministero dell’Università e della Ricerca FIRB 2009.