
Abstract
Background:
A new version of the UVA/Padova Type 1 Diabetes (T1D) Simulator is presented which provides a more realistic testing scenario. The upgrades to the previous simulator, which was accepted by the Food and Drug Administration in 2013, are described.
Method:
Intraday variability of insulin sensitivity (SI) has been modeled, based on clinical T1D data, accounting for both intra- and intersubject variability of daily SI. Thus, time-varying distributions of both subject’s basal insulin infusion and insulin-to-carbohydrate ratio were calculated and made available to the user. A model of “dawn” phenomenon based on clinical T1D data has been also included. Moreover, the model of subcutaneous insulin delivery has been updated with a recently developed model of commercially available fast-acting insulin analogs. Models of both intradermal and inhaled insulin pharmacokinetics have been included. Finally, new models of error affecting continuous glucose monitoring and self-monitoring of blood glucose devices have been added.
Results:
One hundred in silico adults, adolescent, and children have been generated according to the above modifications. The new simulator reproduces the intraday glucose variability observed in clinical data, also describing the nocturnal glucose increase, and the simulated insulin profiles reflect real life data.
Conclusions:
The new modifications introduced in the T1D simulator allow to extend its domain of validity from “single-meal” to “single-day” scenarios, thus enabling a more realistic framework for in silico testing of advanced diabetes technologies including glucose sensors, new insulin molecules and artificial pancreas.
In the last decades, computer simulation has allowed important steps forward in type 1 diabetes (T1D) research, enabling the possibility to perform several in silico tests, with relevant time- and cost- savings. Several simulation tools have been developed (for a review, see Cobelli et al, 1 Kovatchev et al, 2 Wilinska et al, 3 Kanderian et al 4 ), each one based on a comprehensive mathematical model and equipped with an in silico population. In particular, in 2008 the US Food and Drug Administration (FDA) accepted the T1D simulator developed by Universities of Virginia (UVA) and Padova as a substitute for preclinical trials for certain insulin treatments, including closed-loop algorithms for artificial pancreas (AP). 2 This dramatically accelerated the AP research in humans.
Since its first release (S2008), the simulator has been equipped with an in silico population of 300 subjects spanning the variability observed in the real T1D population. This represents the key strength of this “new generation” simulator: in fact in silico subjects are generated from a robust joint distribution of model parameters, obtained by identifying a rather complex model, 5 from a unique multiple-tracer dataset in healthy subjects, 6 which was adapted to describe the T1D variability available in the literature.
A first update of the simulator (S2013) was released and accepted by FDA in 2013, which incorporated a nonlinear glucose response to hypoglycemia and a model of counterregulation. 7 S2013 has been assessed against clinical T1D data, 8 demonstrating that the in silico population was indeed representative of T1D clinical data; this proved the robustness of the simulator in the single-meal scenario domain of validity.
Both S2008 and S2013 have been extensively used by more than 30 sites in academia and companies involved in T1D research, more than 70 articles were published in peer-reviewed journals, and, despite the “single-meal” domain of validity, the simulator was employed for testing AP algorithms which have been subsequently tested in weekly and monthly outpatient human trials.9 -16
However, the latest technological advances in T1D research call for more realistic testing scenarios than the single-meal framework, for example, adaptive AP prototypes17 -22 and slow-acting insulins have to be evaluated on single/multiple day scenarios. Both S2008 and S2013 do not cope with this requirement, since, for example, they provide the same meal response throughout the day. In contrast, the simulator should be able to describe a series of factors that could affect glucose metabolism during the day, such as daily variations in subject parameters, different composition of ingested meals, physical activity, and illness. Therefore, the resulting glucose response to a certain perturbation, for example, a meal, should be strictly dependent from the time at which the perturbation occurs (Figure 1).
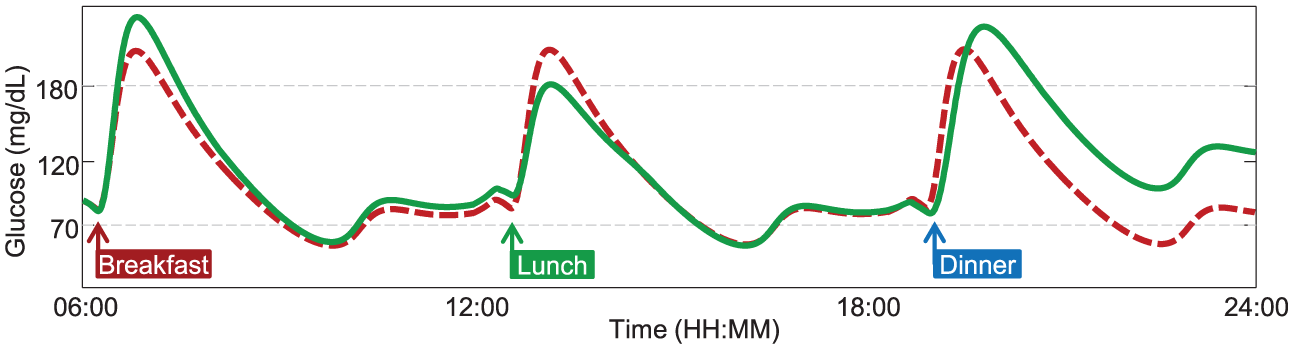
Plasma glucose profile in response to three identical meals, simulated with a time-invariant (dashed red line) or a time-varying model (continuous green line), respectively. A time-varying model provides more realistic behavior, for which glucose response to the same meal perturbation can be different during the day.
The ability to well reproduce diurnal variability is thus of interest, and other research groups have worked on this topic.4,23 -25 We recently demonstrated the ability of the T1D simulator model to describe glucose dynamics in a large dataset of T1D subjects studied for about 24 hours, by describing insulin sensitivity (SI) and meal intestinal absorption rate with time-varying parameters. 26 Such a choice was based on the notion that circadian variability of SI is well known to occur in T1D subjects, as recently demonstrated by Hinshaw and colleagues, 27 and on the assumption that meal absorption rate is depending from its composition.
In this regard, we recently developed a model of intraday SI variability, 28 and incorporated it into the simulator, thus making it time-varying and extending its domain of validity from “single-meal” to “single-day” (24-hour scenario).
In this article, we present the new version of the UVA/Padova T1D simulator (S2017), which incorporates the key feature described above, together with other novelties, such as models describing the latest developments in glucose measurement devices, insulin analogues, and routes of administration (Figure 2).
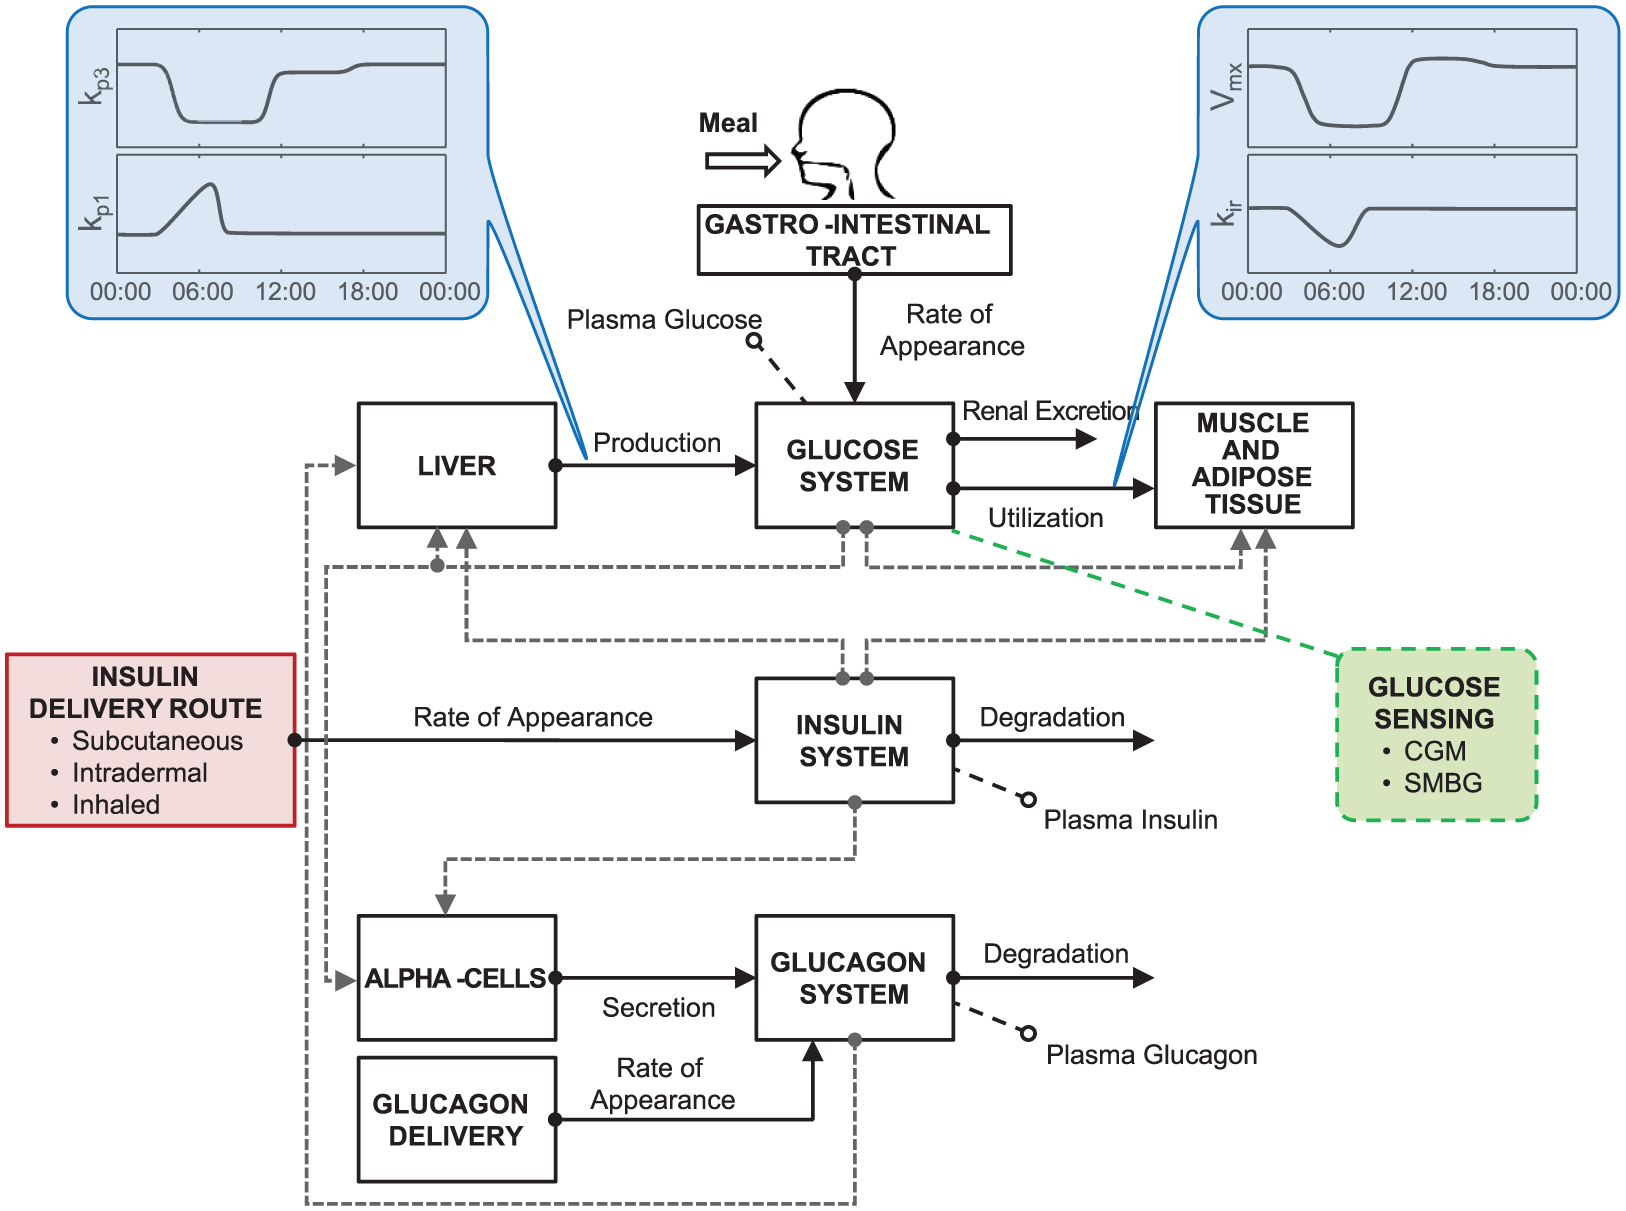
Scheme of T1D S2017 highlighting the introduced upgrades. Specifically, the model incorporates time-varying parameters describing intraday SI variability (kp3, Vmx) and dawn phenomenon (kp1, kir); insulin delivery routes account for administration of subcutaneous fast-acting insulin, intradermal and inhaled insulins; glucose monitoring devices include models of both CGM and SMBG.
Methods
Time-Varying Model of T1D Subject
The most important feature of S2017 concerns the model of T1D subject (shown in Figure 2; see the appendix for the complete set of model equations), which incorporates some time-varying model parameters that allow the description of intrasubject diurnal glucose variability.
Intraday Variability of Insulin Sensitivity
A study in T1D proved the existence of diurnal patterns in SI. 27 Briefly, 20 T1D subjects underwent a mixed meal with triple-tracer approach at breakfast (B), lunch (L), and dinner (D), with all meals having the same amount and composition. This allowed a reliable estimation of SI at B, L and D, by eliminating possible confounding effects due to different meal composition or size, thus relating the observed intraday glucose variability to the sole SI variations. Results showed that SI was lower, on average, at B than L and D, but the intersubject variability was large. This knowledge has been incorporated into the model: 28 specifically, each in silico subject is associated with one among seven possible variability classes, each one representing a specific SI daily pattern, based on the probabilities reported in Visentin et al; 28 then, the time-varying SI is implemented by varying in time parameters kp3 and Vmx (see equations (A5) and (A10), respectively), that is, the insulin action on glucose production by the liver and on glucose utilization by tissues, respectively.
Dawn Phenomenon
Nocturnal glucose variability is modeled to describe the so-called “dawn” phenomenon, that is, the rise in blood glucose concentration that occurs in T1D subjects during early morning, due to both an increased endogenous glucose production (EGP) and an increased insulin requirements.29,30 Recently, Mallad et al
29
quantified an almost 30 mg/dL increase in glucose concentration from 3:00
Updated Glucagon Model
With respect to S2013, S2017 incorporates two updates in the model of glucagon secretion, kinetics and action: first, glucagon clearance, originally expressed as absolute rate (min−1), is now fractional, that is, per unit of distribution volume (mL/kg/min), in order to provide an easy comparison with the literature; 31 second, no static secretion is assumed when blood glucose is over its basal value (see equation (A25)), in order to avoid nonphysiological oscillations in simulated glucagon concentration.
Insulin Delivery Models
Subcutaneous administration of fast-acting insulin analogs is part of conventional insulin therapy in T1D, and is thus a fundamental component of the T1D simulator. However, in order to accommodate alternative insulin delivery routes, S2017 also incorporates models of intradermal and inhaled insulins (Figure 2).
Subcutaneous Fast-acting Insulin
S2017 incorporates an improved model of subcutaneous insulin kinetics, which is able to reproduce the commercially fast-acting insulin analogs. 32 This model has been identified on a large dataset of 116 T1D subjects and introduces, with respect to that included in S2008 and S2013, a subject-specific delay in insulin absorption (τ), accounting for both removal of auxiliary substances for insulin storage in the vial and diffusion processes occurring in the subcutis (see equations A16, A17).
Intradermal Insulin
The model of intradermal insulin route is based on Lv et al. 33 This model (equations A18, A19) has been identified on 10 healthy subjects, and assumes that insulin delivered at the intradermal site is then transported to the bloodstream via two independent routes, that is, a diffusion-like process and a combination of a diffusion-like processes followed by an additional compartment before entering the blood.
Inhaled Insulin
The pulmonary route of administration is described using the model of inhaled insulin pharmacokinetic described in Visentin et al. 34 This model (equations A20, A21) has been identified on 12 T1D subjects, and assumes that a certain fraction of inhaled insulin reaches the alveoli, and then it is rapidly absorbed from the lungs.
Glucose Monitoring Models
S2017 implements the most up-to-date technology for glucose sensing, that is, models describing both continuous glucose monitoring (CGM) and self-monitoring of blood glucose (SMBG) devices (Figure 2). These models, already presented in Vettoretti et al,35,36 Facchinetti et al, 37 and Campos-Náñez et al, 38 are briefly described below.
CGM Model
CGM measurements are modeled to reproduce the performance of the Dexcom® G5 Mobile device (Dexcom, Inc, San Diego, CA). In particular, CGM model derives from that developed by Facchinetti et al: 37 ideal interstitial glucose (IG) signal is derived from simulated blood glucose (BG) profile; then, sensor calibration error is modeled with a linear polynomial; finally, an additive measurement noise generated by a second-order autoregressive model is added. Parameters of the calibration error model and the sensor noise model are randomly sampled, for each virtual sensor, from a day-specific multivariate probability density function derived by fitting the model to data collected in 76 subjects wearing the Dexcom G5 Mobile device for 7 days.
SMBG Model
SMBG model has been developed to reproduce the performance of the Bayer® Contour Next USB device (Bayer HealthCare LLC, Diabetes Care, Whippany, NJ). Specifically, the SMBG model, proposed by Vettoretti et al, 35 consists of a combination of a skew-normal density function and two exponential functions, and is used to describe the probability density functions of both absolute and relative errors, respectively in the low (BG ≤ 115 mg/dl) and the high glucose range (BG>115 mg/dl). The model was developed and validated using data collected in 51 subjects (44 T1D and 7 with type 2 diabetes). The simulator also incorporates models of 52 commercially available models previously described in Campos-Náñez et al. 38 The models provide performance similar to published data on these meters in terms of percentage of measurements within ranges in high and low glucose ranges (>100 mg/dL, <100 mg/dL).
In Silico Population
S2017 is equipped with an in silico population of 300 virtual subjects: 100 adults, 100 adolescents, 100 children. As in Dalla Man et al, 7 each in silico subject is represented by a vector of model parameters that has been randomly extracted from a joint parameter distribution (i.e., covariance matrix and average vector of model parameters).
The novelty here is that each in silico subject is equipped with a daily pattern of basal insulin rate that minimizes glucose oscillations caused by SI variability and dawn phenomenon; in particular, the optimal insulin requirement is calculated from model equations, assuming steady state conditions at early morning, breakfast, lunch, and dinner, respectively. Similarly, a diurnal pattern of carbohydrate-to-insulin ratio (CR) is provided for each subject, containing the optimal CR calculated at breakfast, lunch, and dinner, by adopting the same strategy described in Dalla Man et al. 7 Total daily insulin (TDI) is determined from basal infusion rate and optimal CR, assuming an average diet of 180 g of CHO for adults and adolescents, and 135 g for children; correction factor (CF) is then calculated using the so-called 1700 rule. 39
Following Dalla Man et al, 7 some additional criteria have been considered for subject generation, that is, Mahalanobis distance lower than the 95% percentile and steady state glucose in absence of insulin infusion > 300 mg/dL. On the other hand, constraints on CR values have been enlarged in order to cope with the time-varying SI, which can exceed the 100% of the originally generated value; in particular, here we set CR ≤ 40 g/U for adult and adolescents, CR ≤ 50 g/U for children.
Simulation Environment
S2017 is implemented in MATLAB® R2016. The software interface is similar to that of the previous S2013. In particular, the user is allowed to configure the simulation in terms of: (1) experiment attributes, such as simulation length, meal times, and CHO amounts; (2) population age and number of subjects undergoing the simulation; (3) hardware for glucose reading, such as a specific CGM sensor or SMBG, and insulin administration route, like subcutaneous, intradermal or inhaled; (4) results to be displayed, for example, outcome metrics of glucose control and variability, and graphs.
Results
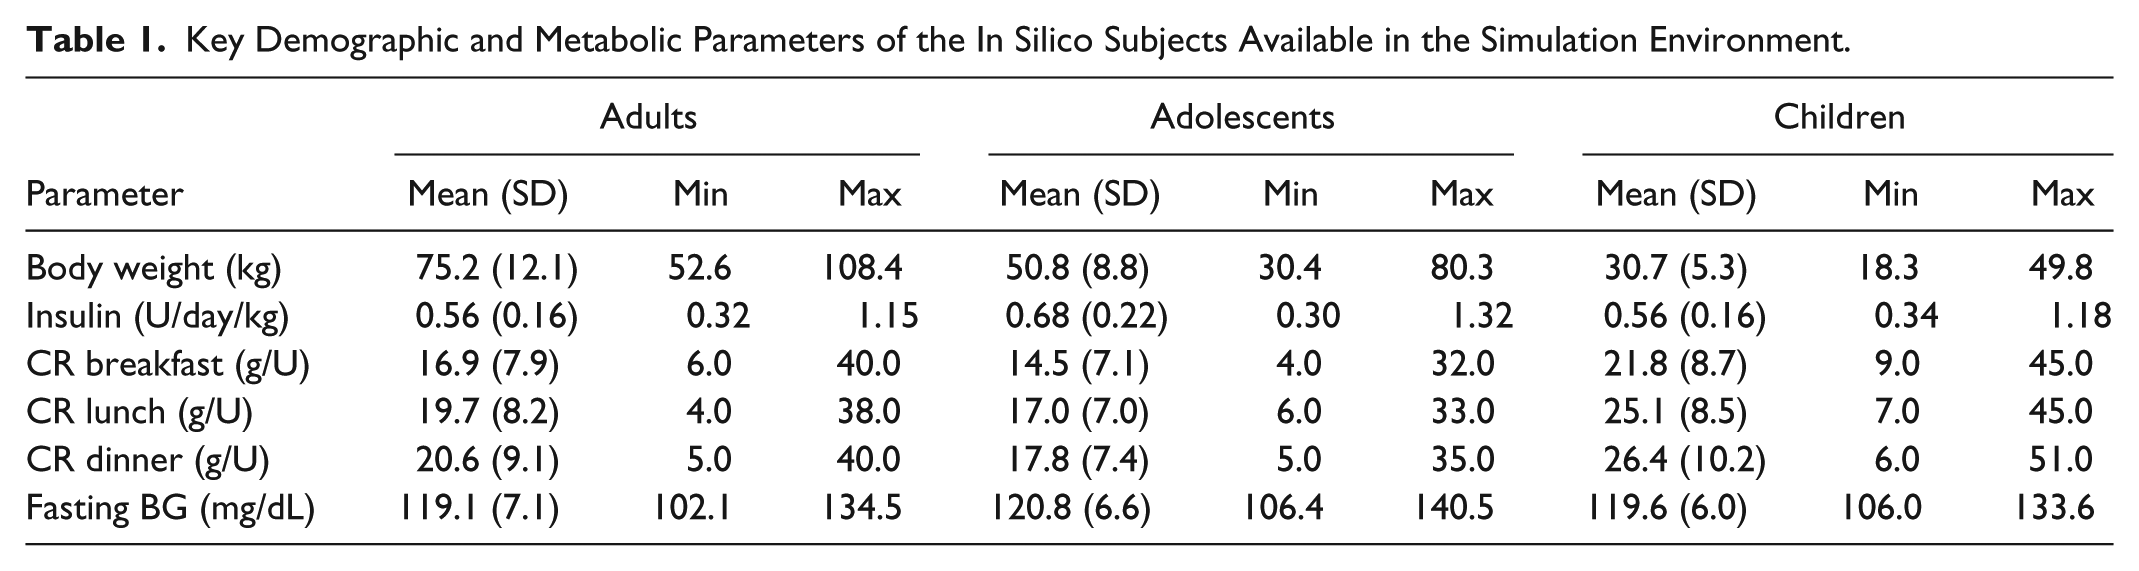
One hundred in silico adults, adolescent, and children have been generated using the criteria described above. Average (standard deviation, SD), minimum, and maximum values of the key metabolic parameters in the three cohorts are reported in Table 1. In silico CR values at breakfast are lower than those at lunch and dinner within each cohort, in agreement with Hinshaw et al. 27
Key Demographic and Metabolic Parameters of the In Silico Subjects Available in the Simulation Environment.
The distributions of CR at breakfast, lunch, and dinner, together with that of CF in the three populations are also shown in Figure 3. They describe accurately the distribution observed in real patients. In particular, CFs in children are higher than in adolescents and adults, reflecting both the higher insulin sensitivity and the lower body weight.
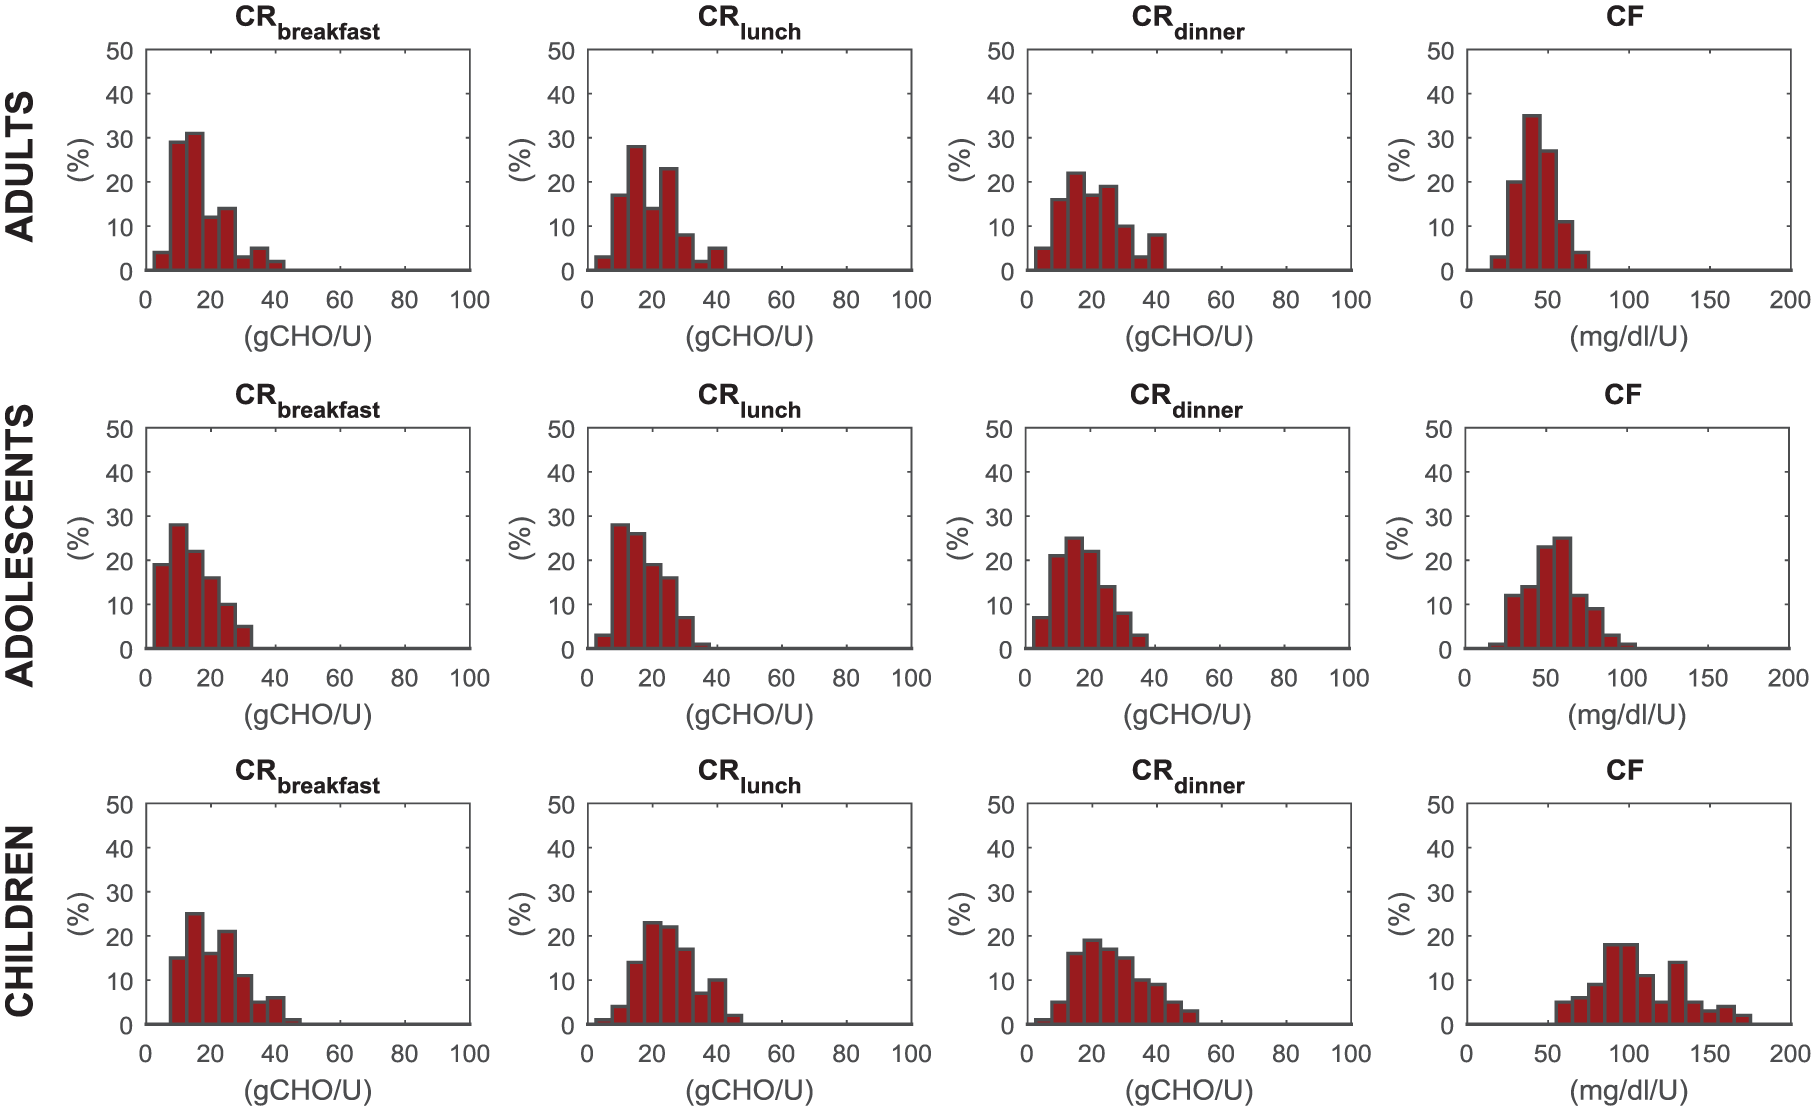
Simulated distribution of carbohydrate-to-insulin ratio at breakfast (CRB), lunch (CRL), dinner (CRD) and correction factor (CF), respectively, from left to right panels, in adult (upper), adolescent (middle), and children (lower panels) populations.
Figure 4 shows 24-hour profiles of plasma glucose and insulin concentrations of 100 adults, adolescents, and children receiving 60 g of CHO at 7:00
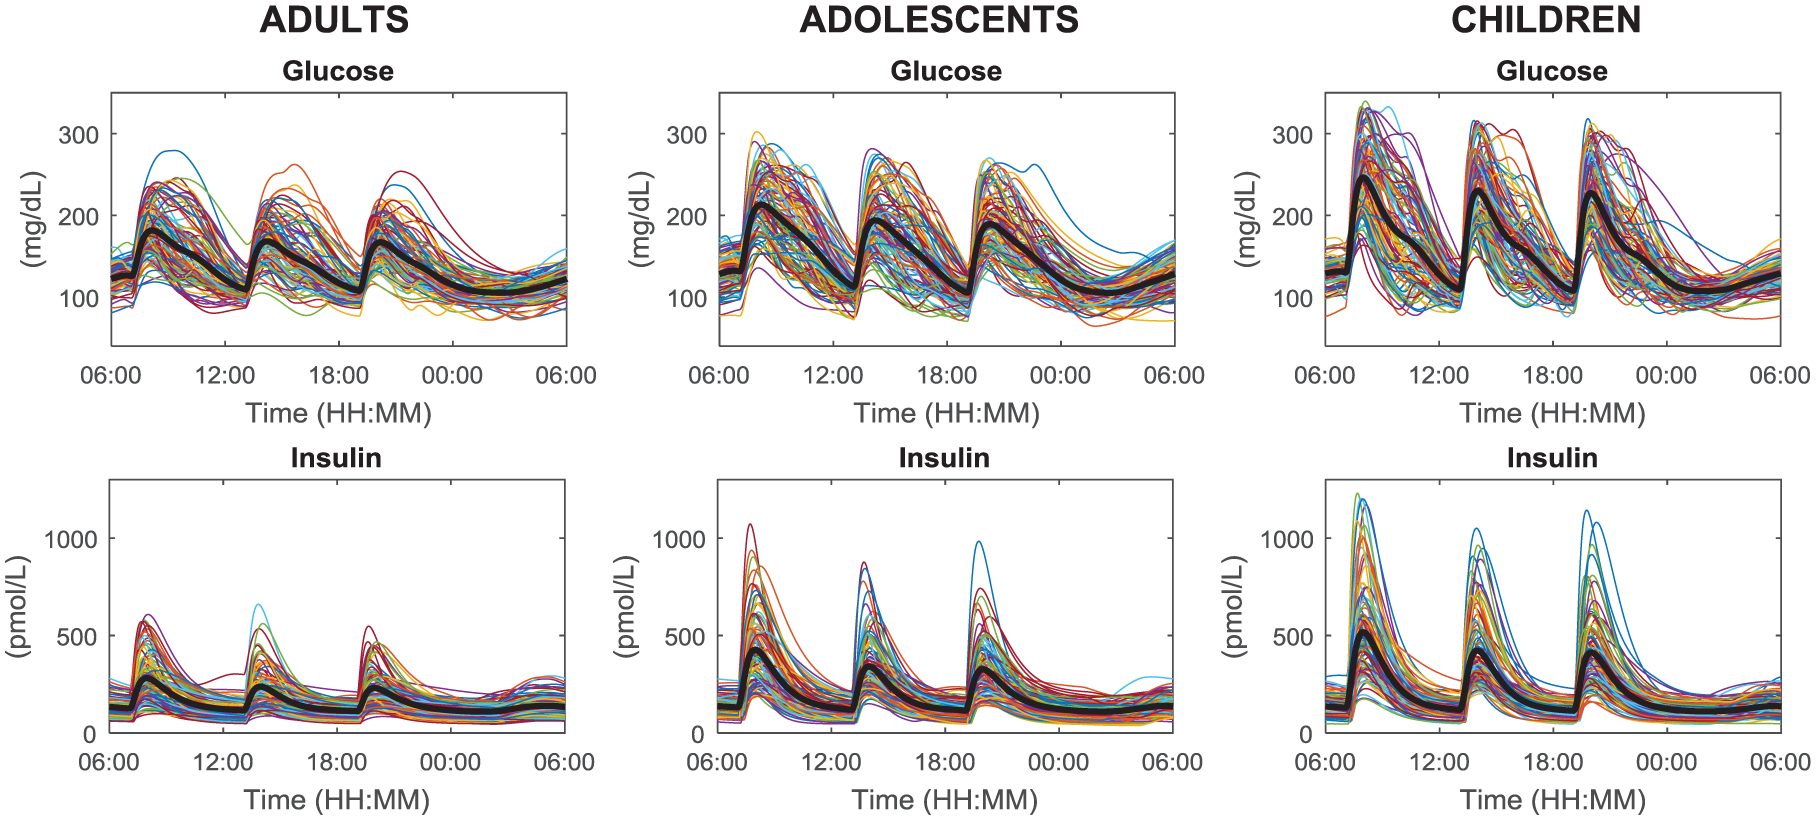
Simulated plasma glucose (upper) and insulin (lower panels) in the 100 in silico adults (left), adolescents (middle), and children (right panels) undergoing a 24-hour scenario with three identical meals (60 g of CHO) at 7:00
The observed intersubject glucose variability is larger in children and adolescents compared to adults, in agreement with the knowledge that glucose control is more challenging in these groups of subjects. Moreover, in all the cohorts the postprandial glucose and insulin excursions at breakfast (B) are higher, on average, with respect to those at lunch (L) and dinner (D). This reflects the fact that several subjects are insulin resistant in that portion of the day: mean ± SD of overbasal glucose peak values are 68 ± 30 (B), 54 ± 27 (L), and 53 ± 25 (D) mg/dL in adults, 98 ± 36 (B), 79 ± 38 (L), and 73 ± 34 (D) mg/dL in adolescents, 134 ± 45 (B), 117 ± 42 (L), and 114 ± 42 (D) mg/dL in children; mean ± SD of overbasal insulin peak values are 185 ± 108 (B), 138 ± 92 (L), and 133 ± 80 (D) pmol/L in adults, 333 ± 185 (B), 244 ± 137 (L), and 229 ± 130 (D) pmol/L in adolescents, 422 ± 236 (B), 325 ± 179 (L), and 315 ± 180 (D) pmol/L in children.
Discussion
Since its first release in 2008, the UVA/Padova T1D simulator has been widely used in AP research, contributing to speed up the transition of AP testing from short to long-lasting periods, such as multiple days/weeks. However, both 2008 and 2013 simulator versions cannot fully support the contemporary long-term AP trials due to their single-meal domain of validity: in fact these simulator versions are based on time-invariant parameters. On the contrary, recent works demonstrated that simulation models need for a certain number of time-varying parameters in order to properly describe glucose metabolism during the day.26,40 Therefore, we developed a model of SI intraday variability and a description of dawn phenomenon, thanks to available data on diurnal variability of glucose metabolism. These models have been incorporated into the new version of the UVA/Padova T1D simulator (S2017), presented in this article. A new in silico population has been generated, where each subject is equipped with a time-varying diabetes therapy, consisting of a time-varying basal insulin rate and multiple CRs, which better complies with conventional therapy of real T1D subjects. In addition, S2017 incorporates new models implementing the latest technological advances in insulin delivery and glucose sensing.
Although the described upgrades increase the reliability of the simulator, further improvements are already envisioned and under investigation. In Visentin et al, 26 a preliminary description of glucose dynamics depending on meal composition was provided; however, a better insight on this topic will be made based on a recent study on complex carbohydrates. 41 We also foresee the possibility of including multiple daily injection therapy in the next version of the simulator, by incorporating pharmacokinetic models of long-acting basal insulin analogues, such as that describing the absorption of glargine insulins. 42 Finally, new insights based on data available from recent monthly clinical trials, for example,11-13,21 will allow an appropriate description of long-term SI variability, thus potentially further extending the simulator domain of validity from single- to multiple-day scenarios.
Conclusion
In this article we presented the new version of the UVA/Padova T1D Simulator. It incorporates a number of novelties that are based on solid modeling methodologies and original data. Among them, the most noteworthy upgrade concerns the model of diurnal glucose variability, mainly due to the intraday SI variability, which allows extending the domain of validity of the simulator from single-meal to single-day multiple-meal scenarios. The 2017 updated simulator will be submitted to FDA for acceptance. The new simulator has the potential of being a suitable tool for in silico testing of the latest cutting-edge technologies in type 1 diabetes therapy.
Footnotes
Appendix
Abbreviations
AP, artificial pancreas; B, breakfast; BG, blood glucose; CF, correction factor; CGM, continuous glucose monitoring; CHO, carbohydrates; CR, carbohydrate-to-insulin ratio; CSII, continuous subcutaneous insulin infusion; CVGA, control variability grid analysis; D, dinner; EGP, endogenous glucose production; FDA, Food and Drug Administration; ID, intradermal route; IG, interstitial glucose; IH, inhaled route; L, lunch; S2008, Type 1 Diabetes Simulator 2008; S2013, Type 1 Diabetes Simulator 2013; S2017, Type 1 Diabetes Simulator 2017; SC, subcutaneous route; SD, standard deviation; SI, insulin sensitivity; SMBG, self-monitoring of blood glucose; T1D, type 1 diabetes; UVA, University of Virginia.
Declaration of Conflicting Interests
The author(s) declared no potential conflicts of interest with respect to the research, authorship, and/or publication of this article.
Funding
The author(s) disclosed receipt of the following financial support for the research, authorship, and/or publication of this article: This study was supported by University of Padova, “Progetto di Ateneo 2014” and grant CPDA145405/14, and by the Juvenile Diabetes Research Foundation grant 2-SRA-2016-291-Q-R.