
Abstract
Background:
The recent availability of high-quality data from clinical trials, together with machine learning (ML) techniques, presents exciting opportunities for developing prediction models for clinical outcomes.
Methods:
As a proof-of-concept, we translated a hypoglycemia risk model derived from the Action to Control Cardiovascular Risk in Diabetes (ACCORD) study into the HypoHazardScore, a risk assessment tool applicable to electronic health record (EHR) data. To assess its performance, we conducted a 16-week clinical study at the University of Minnesota where participants (N = 40) with type 2 diabetes mellitus (T2DM) had hypoglycemia assessed prospectively by continuous glucose monitoring (CGM).
Results:
The HypoHazardScore combines 16 risk factors commonly found within the EHR. The HypoHazardScore successfully predicted (area under the curve [AUC] = 0.723) whether participants experienced least one CGM-assessed hypoglycemic event (glucose <54 mg/dL for ≥15 minutes from two CGMs) while significantly correlating with frequency of CGM-assessed hypoglycemic events (r = 0.38) and percent time experiencing CGM-assessed hypoglycemia (r = 0.39). Compared to participants with a low HypoHazardScore (N = 19, score <4, median score of 4), participants with a high HypoHazardScore (N = 21, score ≥4) had more frequent CGM-assessed hypoglycemic events (high: 1.6 ± 2.2 events/week; low: 0.3 ± 0.5 events/week) and experienced more CGM-assessed hypoglycemia (high: 1.4% ± 2.0%; low: 0.2% ± 0.4% time) during the 16-week follow-up.
Conclusions:
We demonstrated that a hypoglycemia risk model can be successfully adapted from the ACCORD data to the EHR, with validation by a prospective study using CGM-assessed hypoglycemia. The HypoHazardScore represents a significant advancement toward implementing an EHR-based decision support system that can help reduce hypoglycemia in patients with T2DM.
Introduction
Clinical trials present a wealth of adjudicated data for knowledge discovery and secondary outcomes analysis.1,2 Machine learning (ML) methods applied to clinical trial data have identified risk prediction models and treatment selection algorithms.3,4 However, only a small percentage of these models have been incorporated clinically.5,6 Since data collection during clinical trials focus on scientific rigor rather than clinical translation, clinical trial data can differ from electronic health record (EHR) data with regard to data frequency and data elements. As a result, conversion of clinical trial derived prediction models needs to reconcile EHR data elements before translating into an EHR-based model. Furthermore, once the EHR-based model is created, efficacy evaluation within the target population remains critical.
We present a “proof-of-concept” study demonstrating the translation of our hypoglycemia risk prediction 7 model in type 2 diabetes mellitus (T2DM) patients participating in the Action to Control Cardiovascular Risk in Diabetes (ACCORD) study into an EHR-based risk assessment tool for hypoglycemia. Hypoglycemia is a serious complication of diabetes. In patients with T2DM, self-reported hypoglycemia occurred in 63% within the preceding six months where severity and frequency of hypoglycemia were associated with lower quality of life 8 and increased emergency room visits. 9
Multiple models predicting hypoglycemia either from EHR data10,11 or clinical studies data exist.12-15 Yet, important limitations exist. Although adopting an EHR-based risk model is theoretically easier than translating a clinical trial–derived model, EHR-based risk models are limited by under-documentation of hypoglycemia within the EHR. 16 In the EHR, hypoglycemia is often documented in unstructured fields, such as clinical notes. Although natural language processing methods have improved identification of hypoglycemic events, their performance remains far from perfect. 17 Likewise, clinical studies which establish risk models for hypoglycemia have traditionally depended on patient cooperation for assessing hypoglycemia, either through patient self-report or self-monitoring of blood glucose (SMBG).12-14 In these cases, hypoglycemic events may be missed for multiple reasons, such as impaired awareness of hypoglycemia, poor patient engagement, or inconsistent documentation. It is estimated that reliance on patient-reported symptoms fails to capture 95% of continuous glucose monitoring systems (CGM)–assessed hypoglycemic events. 18 In addition, many previously reported risk models were derived based on a mixed population that also includes patients with type 1 diabetes mellitus (T1DM).12,13,15 In response, we translated a model which our group had established in 2018 from the ACCORD clinical trial. 7 This model was constructed in patients with T2DM where hypoglycemic events were regularly assessed and adjudicated by the investigative team. This model estimated the risk for severe hypoglycemia (SH: hypoglycemia requiring assistance and either blood glucose <54 mg/dL or requiring the administration of glucose) over a long-term horizon (five years) in patients with T2DM and showed good risk prediction performance (c-index: 0.782). 7
To successfully translate the ACCORD-based hypoglycemia prediction model to an EHR-based hypoglycemia prediction model, we faced two critical challenges. The first involved variable mapping of clinical trial data to EHR data elements. The original 2018 risk model 7 was modified to include variables reliably measured in the EHR. The second challenge involved model validation. As validation using the EHR was not feasible due to the under-documentation of hypoglycemia within the EHR, we performed a prospective clinical study to objectively validate hypoglycemic events using CGM. Commercially available to patients in the United States via prescription, CGM technology measures interstitial glucose levels with high frequency and fidelity (glucose sampling every 1-5 minutes, glucose values reported in 10- to 15-minute intervals for 10-14 days, manufacturer-dependent) with minimal patient engagement.19-21 By addressing the aforementioned challenges, we developed the HypoHazardScore, an EHR-based risk assessment tool for hypoglycemia and demonstrated its effectiveness in assessing CGM-documented hypoglycemia risk in T2DM over a short-term (~16 weeks) observation period.
Methods
Figure 1 diagrams the study design and procedures.
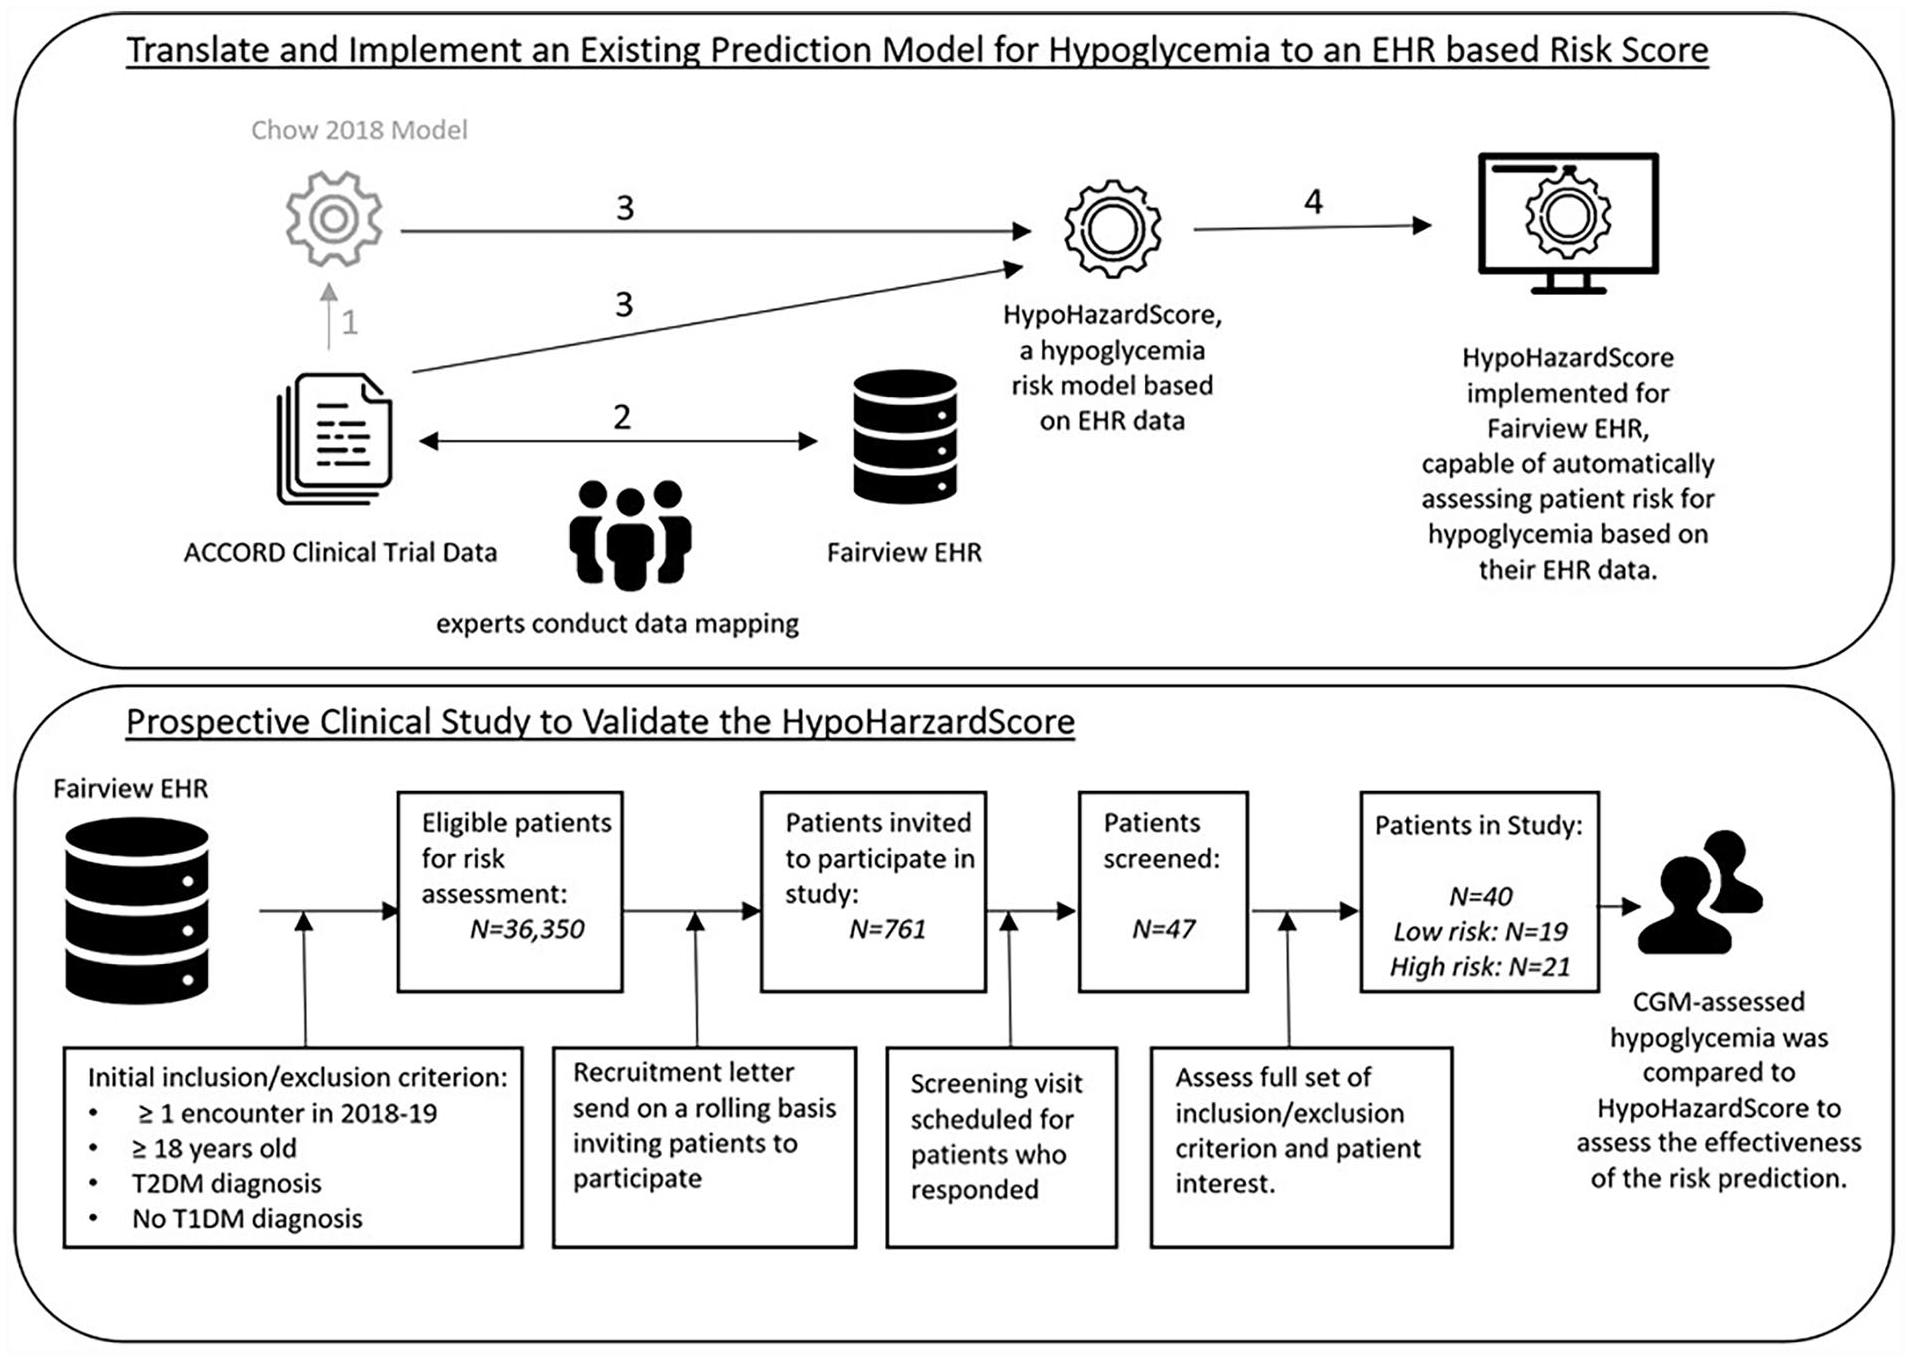
Diagram summarizing the study. Process in gray represents the previous study, and process in black represents the current study. (Upper panel) (1) In our previous study, a risk model for hypoglycemia was developed using ACCORD clinical trial data. 7 (2) To translate this model to an EHR-based risk model for hypoglycemia, experts reviewed the ACCORD variables and mapped them to corresponding data elements within the EHR data when applicable. (3) The Chow 2018 model was modified and translated to the HypoHazardScore, EHR-based risk model for hypoglycemia. (4) The HypoHazardScore was implemented within the Fairview’s EHR data to automatically assess risk for hypoglycemia based on EHR data. (Lower panel) A prospective clinical study was conducted to assess the effectiveness of HypoHazardScore.
The presented data were collected from patients participating in the “Role of CGM Usage in Predicting Risk of Hypoglycemia” study at the University of Minnesota (NCT03481530). The University of Minnesota’s Institutional Review Board approved the protocol. All participants provided written informed consent before participation. Part of the raw CGM data were pooled, analyzed, and previously published to examine CGM functionality.22,23 However, the primary outcome of the study, CGM-assessed hypoglycemia, has not been published.
Development of the HypoHazardScore
Our previous risk model developed from the ACCORD clinical trial data contains 17 risk factors, of which three factors (intensive treatment, education, and waist-circumference) are not consistently captured in the EHR. We revisited the ACCORD data, eliminated these three factors and developed a new risk model (Supplemental Table 1) to create the HypoHazardScore (Table 1), using the same methods previously reported. 7 The HypoHazardScore comprises of 16 risk factors pulled from the ACCORD data which can be easily obtained from EHR data.
EHR Components and Procedure to Calculate the HypoHazardScore.
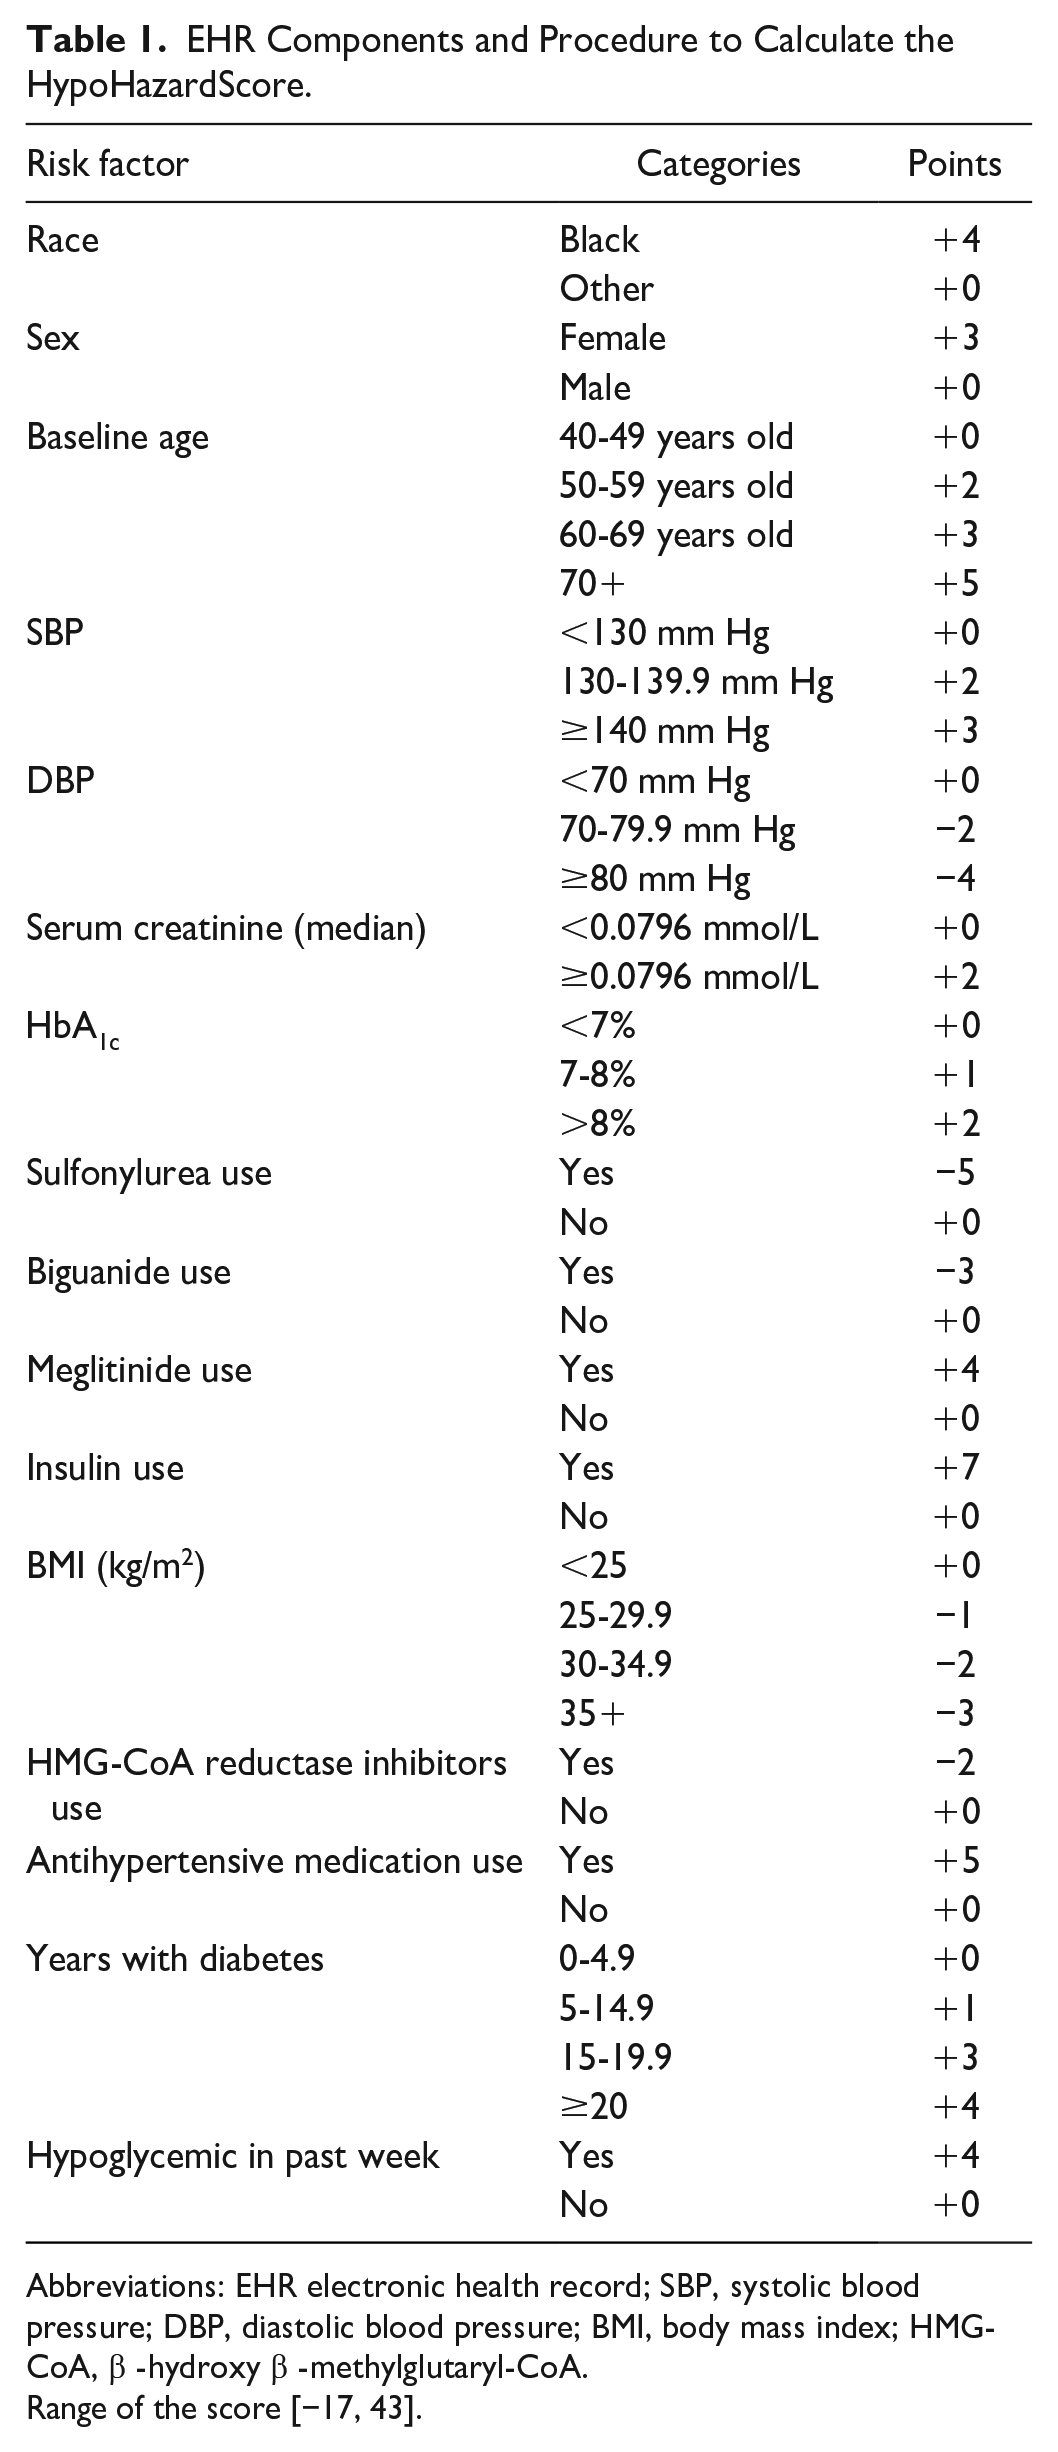
Abbreviations: EHR electronic health record; SBP, systolic blood pressure; DBP, diastolic blood pressure; BMI, body mass index; HMG-CoA, β -hydroxy β -methylglutaryl-CoA.
Range of the score [−17, 43].
Implementation of the HypoHazardScore Within the Fairview Electronic Health Record
We worked with the University of Minnesota Best Practices Integrated Informatics Core at the Clinical and Translational Science Institute to implement the HypoHazardScore within the Fairview EHR. To identify the EHR elements that correspond to the risk factors in HypoHazardScore, a team of clinicians and clinical informatics experts manually reviewed the risk factors and mapped them to their corresponding EHR-based measures. Institutional-specific result codes were used to identify laboratory results. International Classification of Diseases, Tenth Revision (ICD-10) codes were used to identify diagnoses. Pharmaceutical subclasses and/or drug names were used to identify medication.
After completing the EHR element mapping, we implemented an automated risk assessment tool based on EHR data elements for assessing hypoglycemia risks using Structured Query Language for the Fairview EHR with the scoring rule (Table 1). Based on the date when score computation was requested, we used the most recent relevant lab value/measurement, any relevant medications ordered in the past one year, and diabetes duration by considering the first date of documented diabetes diagnosis.
Validation of the HypoHazardScore in a Prospective Clinical Study
We recruited participants from the Fairview EHR who had a least one encounter between 2018 and 2019 and compared their hypoglycemia risk predicted by the HypoHazardScore to CGM-assessed hypoglycemia.
Subject recruitment
We identified patients through the EHR that met inclusion/exclusion criterion. The inclusion criteria included adult ≥18 years and patients with T2DM. Exclusion criteria included having T1DM, current/anticipated pregnancy, significant hypertension (study-visit measured systolic blood pressure >160 or diastolic blood pressure >100), or resting tachycardia (study-visit measured heart rate >130), and current CGM usage or self-reported anticipated CGM usage within the next four months. A HypoHazardScore was computed for each eligible patient who met study criteria. As the HypoHazardScore for this population ranged from −16 to 26 (median of 4), we defined a high HypoHazardScore as a score ≥4 and a low HypoHazardScore as a score<4. Due to the high number (n = 36 350) of potentially eligible patients, the recruitment pool was limited to patients living within the Minneapolis-St. Paul metropolitan area with available HbA1c values within the three months of a mailing. A total of eight mailings were performed for recruitment. One hundred patients were randomly selected for each mailing as the positive response rate is ~5% to 10% for letter-based research recruitment. Any subject responding to the recruitment letter underwent a telephone screen and if eligible, then scheduled for an in-person study visit. We had 47 potential participants contact the study of which 40 consented and completed the study (Figure 1).
Study design
During the screening visit, participants had their vital signs (height, weight, blood pressure, heart rate) measured and provided blood samples after fasting for at least 8 hours for glucose, HbA1c, and fructosamine. Afterward, participants wore a CGM sensor for 16 weeks. Every two weeks (eight visits per participant), study staff replaced the CGM sensor, collected self-reported data on adverse events, hypoglycemic events, medication changes, and SMBG logs for the past 14 days. Participants reported any hypoglycemic event requiring assistance from another person, regardless of whether they checked their blood sugar. At the study conclusion, study staff re-measured the participant’s vital signs (height, weight, blood pressure, heart rate) and blood tests (HbA1c and fructosamine).
Continuous glucose monitoring
Two types of FreeStyle Libre sensors were used in the study (FreeStyle Libre Pro and FreeStyle Libre 14-day Sensor). Each participant wore two CGM sensors simultaneously. One of these was a FreeStyle Libre Pro (blinded sensor), while the other was either a FreeStyle Libre Pro (blinded sensor) or FreeStyle Libre 14-day Sensor (unblinded sensor—first generation of the FreeStyle Libre sensor for personal use), assigned randomly to investigate whether having access to an unblinded sensor could reduce the risk of hypoglycemia as a secondary study outcome. Participants used the same type of sensor throughout the study period, and the randomization was based on the HypoHazardScore. Both sensors sample interstitial glucose every 1 minute while reporting glucose measurements every 15 minutes for up to 14 days. Study staff downloaded results from the blinded sensor every two weeks, without sharing them with the participant. For the FreeStyle Libre 14-day Sensor, we required participants to scan the sensor using the study-provided reader, rather than the FreeStyle LibreLink app; scanning was per participant discretion. Notably the FreeStyle Libre 14-day Sensor does not have any alarm settings and is not a “real-time” streaming device as it requires scanning for the participant to see the glucose results. If the participant did not scan the FreeStyle Libre 14-day Sensor every 8 hours, a data gap would occur because the sensor can only store up to 8 hours of glucose data at a time.
Statistical Analysis for the Validation Study
Identifying continuous glucose monitoring–assessed hypoglycemia
Given that the FreeStyle Libre system has a tendency to over-estimate hypoglycemia, 24 we increased the specificity our findings by defining a CGM-assessed hypoglycemic event as a glucose level <54 mg/dL 25 for ≥15 minutes 26 as measured simultaneously from both CGM sensors. Custom Python scripts were used to identify hypoglycemic events from the CGM records. After identifying each CGM-assessed hypoglycemic event from individual participants, we computed the frequency (number of events per week) of hypoglycemia, duration of each hypoglycemic event, and percent time spent experiencing CGM-assessed hypoglycemia over the observation period (duration of CGM-assessed hypoglycemic events over total CGM monitoring time).
Evaluating the relationship between HypoHazardScore vs continuous glucose monitoring–assessed hypoglycemia
We assessed the predictive performance of the HypoHazardScore for CGM-assessed hypoglycemic events over a 16-week period. We constructed a receiver operating characteristic curve (ROC) and calculated the area under the curve (AUC) to evaluate its performance. The AUC’s confidence interval was estimated using Delong’s method. 27 In addition, we measured the correlation between the HypoHazardScore and two variables: frequency of CGM-assessed hypoglycemia and time spent in CGM-assessed hypoglycemia. Spearman’s correlation was used for these calculations.
Comparing continuous glucose monitoring–assessed hypoglycemia between participants with high vs low HypoHazardScores
Participants were divided into two groups based on their HypoHazardScore: high (≥4) and low (<4). The two groups were compared regarding CGM-assessed hypoglycemia using multiple measures, such as event frequency, duration, percentage of time in hypoglycemia, and self-reported instances requiring treatment assistance. Chi-square tests were used for binary variables (eg, occurrence of hypoglycemic events), while the Student’s t-test was employed for continuous variables.
Ancillary analysis of the impact of continuous glucose monitoring sensor blind/unblind status
As a secondary analysis, we investigated the impact of access to unblinded CGM data, available for participants using the FreeStyle Libre 14-day Sensor with reader, on CGM-assessed hypoglycemia. This analysis, although not the primary focus of the study, is presented in the Supplemental Material (section “Ancillary Analysis”) since it did not have a significant impact on the rates of CGM-assessed hypoglycemia.
Results
HypoHazardScore
The HypoHazardScore contains 16 risk factors (Table 1) which were variables available from the ACCORD data and the EHR data. The HypoHazardScore achieved comparable risk assessment performance in the ACCORD data compared to the original 2018 score; the HypoHazardScore had a c-index = 0.752 (95% confidence interval [CI]: [0.732, 0.771]) vs the original score’s c-index of 0.782 [0.764, 0.800]. The relationship between the score points and estimated risk in the ACCORD population remained similar to the original 2018 model (Supplemental Figure 1).
Validation Study
For the validation study, Figure 1 (lower panel) depicts the main recruitment processes. Among 47 screened participants, 40 completed the screening visit (high risk: n = 21, low risk: n = 19). Baseline characteristics are described in Table 2, and distribution of their HypoHazardScore is described in Supplemental Figure 2. The high HypoHazardScore group (HypoHazardScore ≥4) comprised older individuals with higher HbA1c levels. Fructosamine level did not differ between groups. The percentage of participants using insulin was significantly higher in the high HypoHazardScore group (95.2%) than the low HypoHazardScore group (0.0%) (P < .01).
Descriptive Statistics of Participants’ Baseline Measures for the Entire Cohort, High, and Low HypoHazardScore Groups, Respectively.
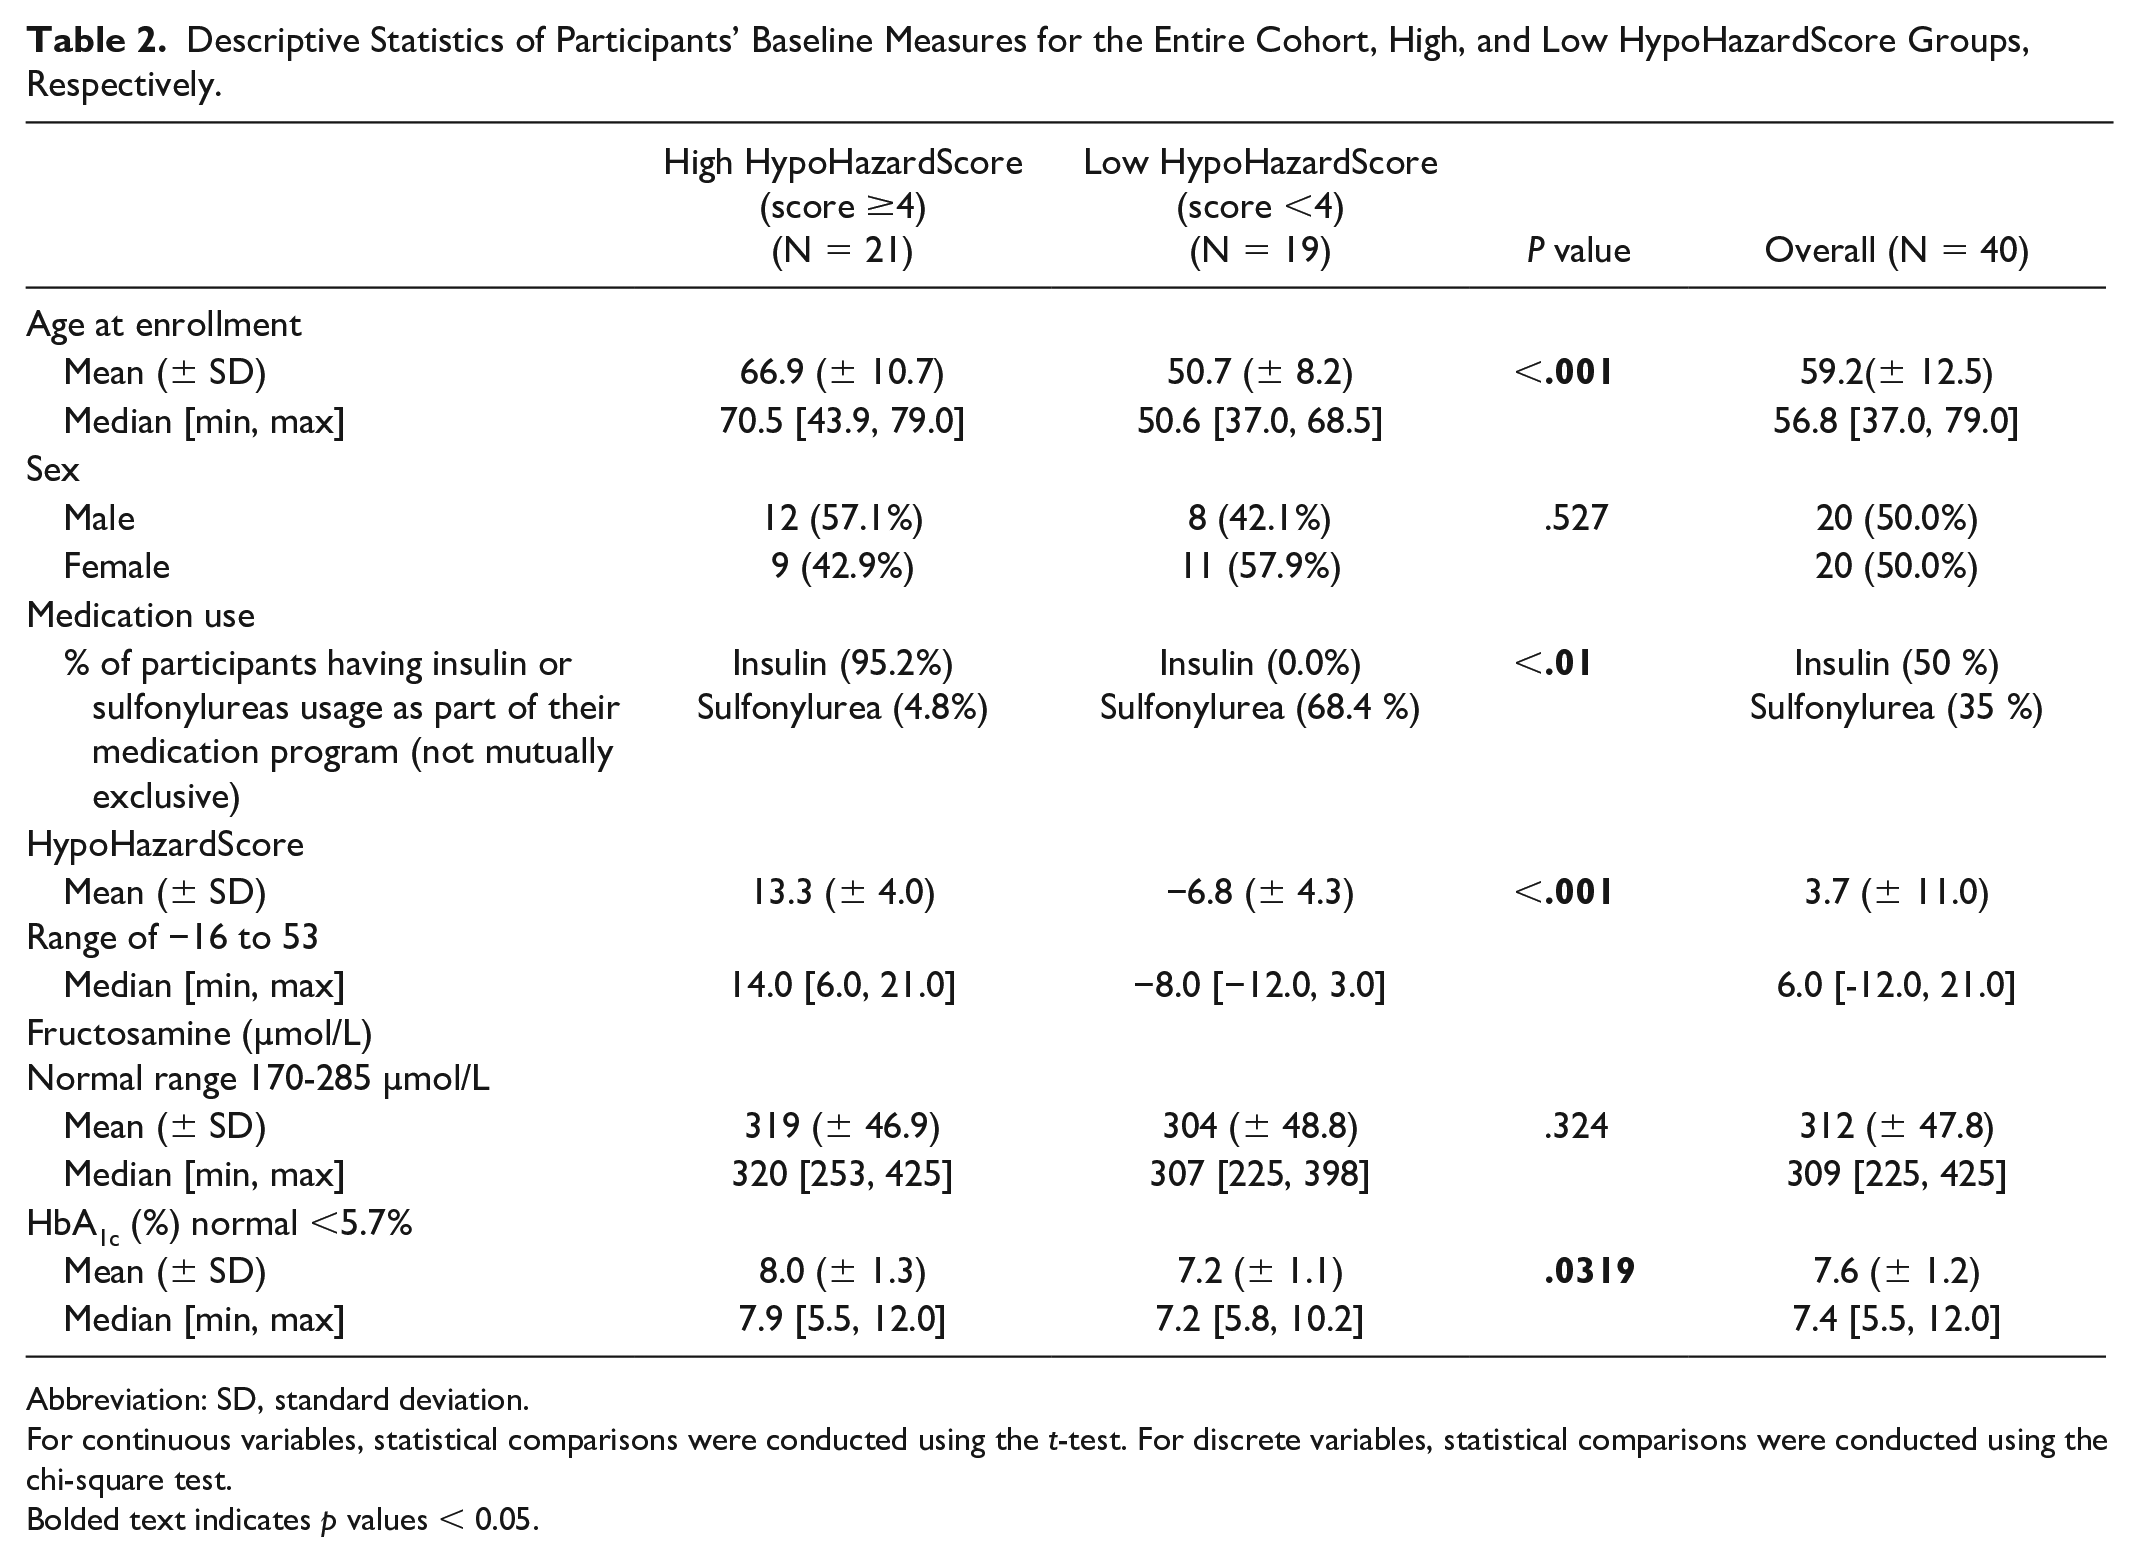
Abbreviation: SD, standard deviation.
For continuous variables, statistical comparisons were conducted using the t-test. For discrete variables, statistical comparisons were conducted using the chi-square test.
Bolded text indicates p values < 0.05.
Number of Continuous Glucose Monitoring–Assessed Hypoglycemia Events
By defining CGM-assessed hypoglycemia events as both sensors measuring <54 mg/dL for at least 15 minutes, we found 287 events in the 16-week cohort of 40 patients. However, if we only required one sensor to measure <54 mg/dL for at least 15 minutes, the number of CGM-assessed hypoglycemia events significantly rose. The left arm sensor recorded 623 events, while the right arm sensor detected 749 events. Consequently, to enhance the specificity of the HypoHazardScore in measuring CGM-assessed hypoglycemia events, we mandated that both sensors measure <54 mg/dL for at least 15 minutes.
Association Between HypoHazardScore and Continuous Glucose Monitoring–Assessed Hypoglycemia
Supplemental Figure 3 illustrates the ROC curve for using the HypoHazardScore to predict if a participant would experience any CGM-assessed hypoglycemic event during their 16-week monitoring period. The HypoHazardScore showed good predictivity, demonstrated by AUC = 0.723 with 95% CI of [0.559, 0.887].
We also examined the relationship between the HypoHazardScore, frequency of CGM-assessed hypoglycemic events, and percent time experiencing hypoglycemia. We found significant correlation between the HypoHazardScore and frequency of CGM-assessed hypoglycemia with correlation coefficient of 0.38 (P = .0154), and significant correlation between the HypoHazardScore and percent time experiencing CGM-assessed hypoglycemia with a correlation coefficient of 0.39 (P = .0118).
Participants with High HypoHazardScore had Higher Incidence, Greater Frequency, and Longer Duration of Continuous Glucose Monitoring–Assessed Hypoglycemic Events
The high HypoHazardScore group showed a significantly greater proportion of participants experiencing CGM-assessed hypoglycemia, higher frequency of hypoglycemic events, and more time spent in CGM-assessed hypoglycemia compared to the low HypoHazardScore group (Table 3).
Participants’ Hypoglycemia Outcomes for Entire Cohort, High, and Low HypoHazardScore Groups, Respectively.
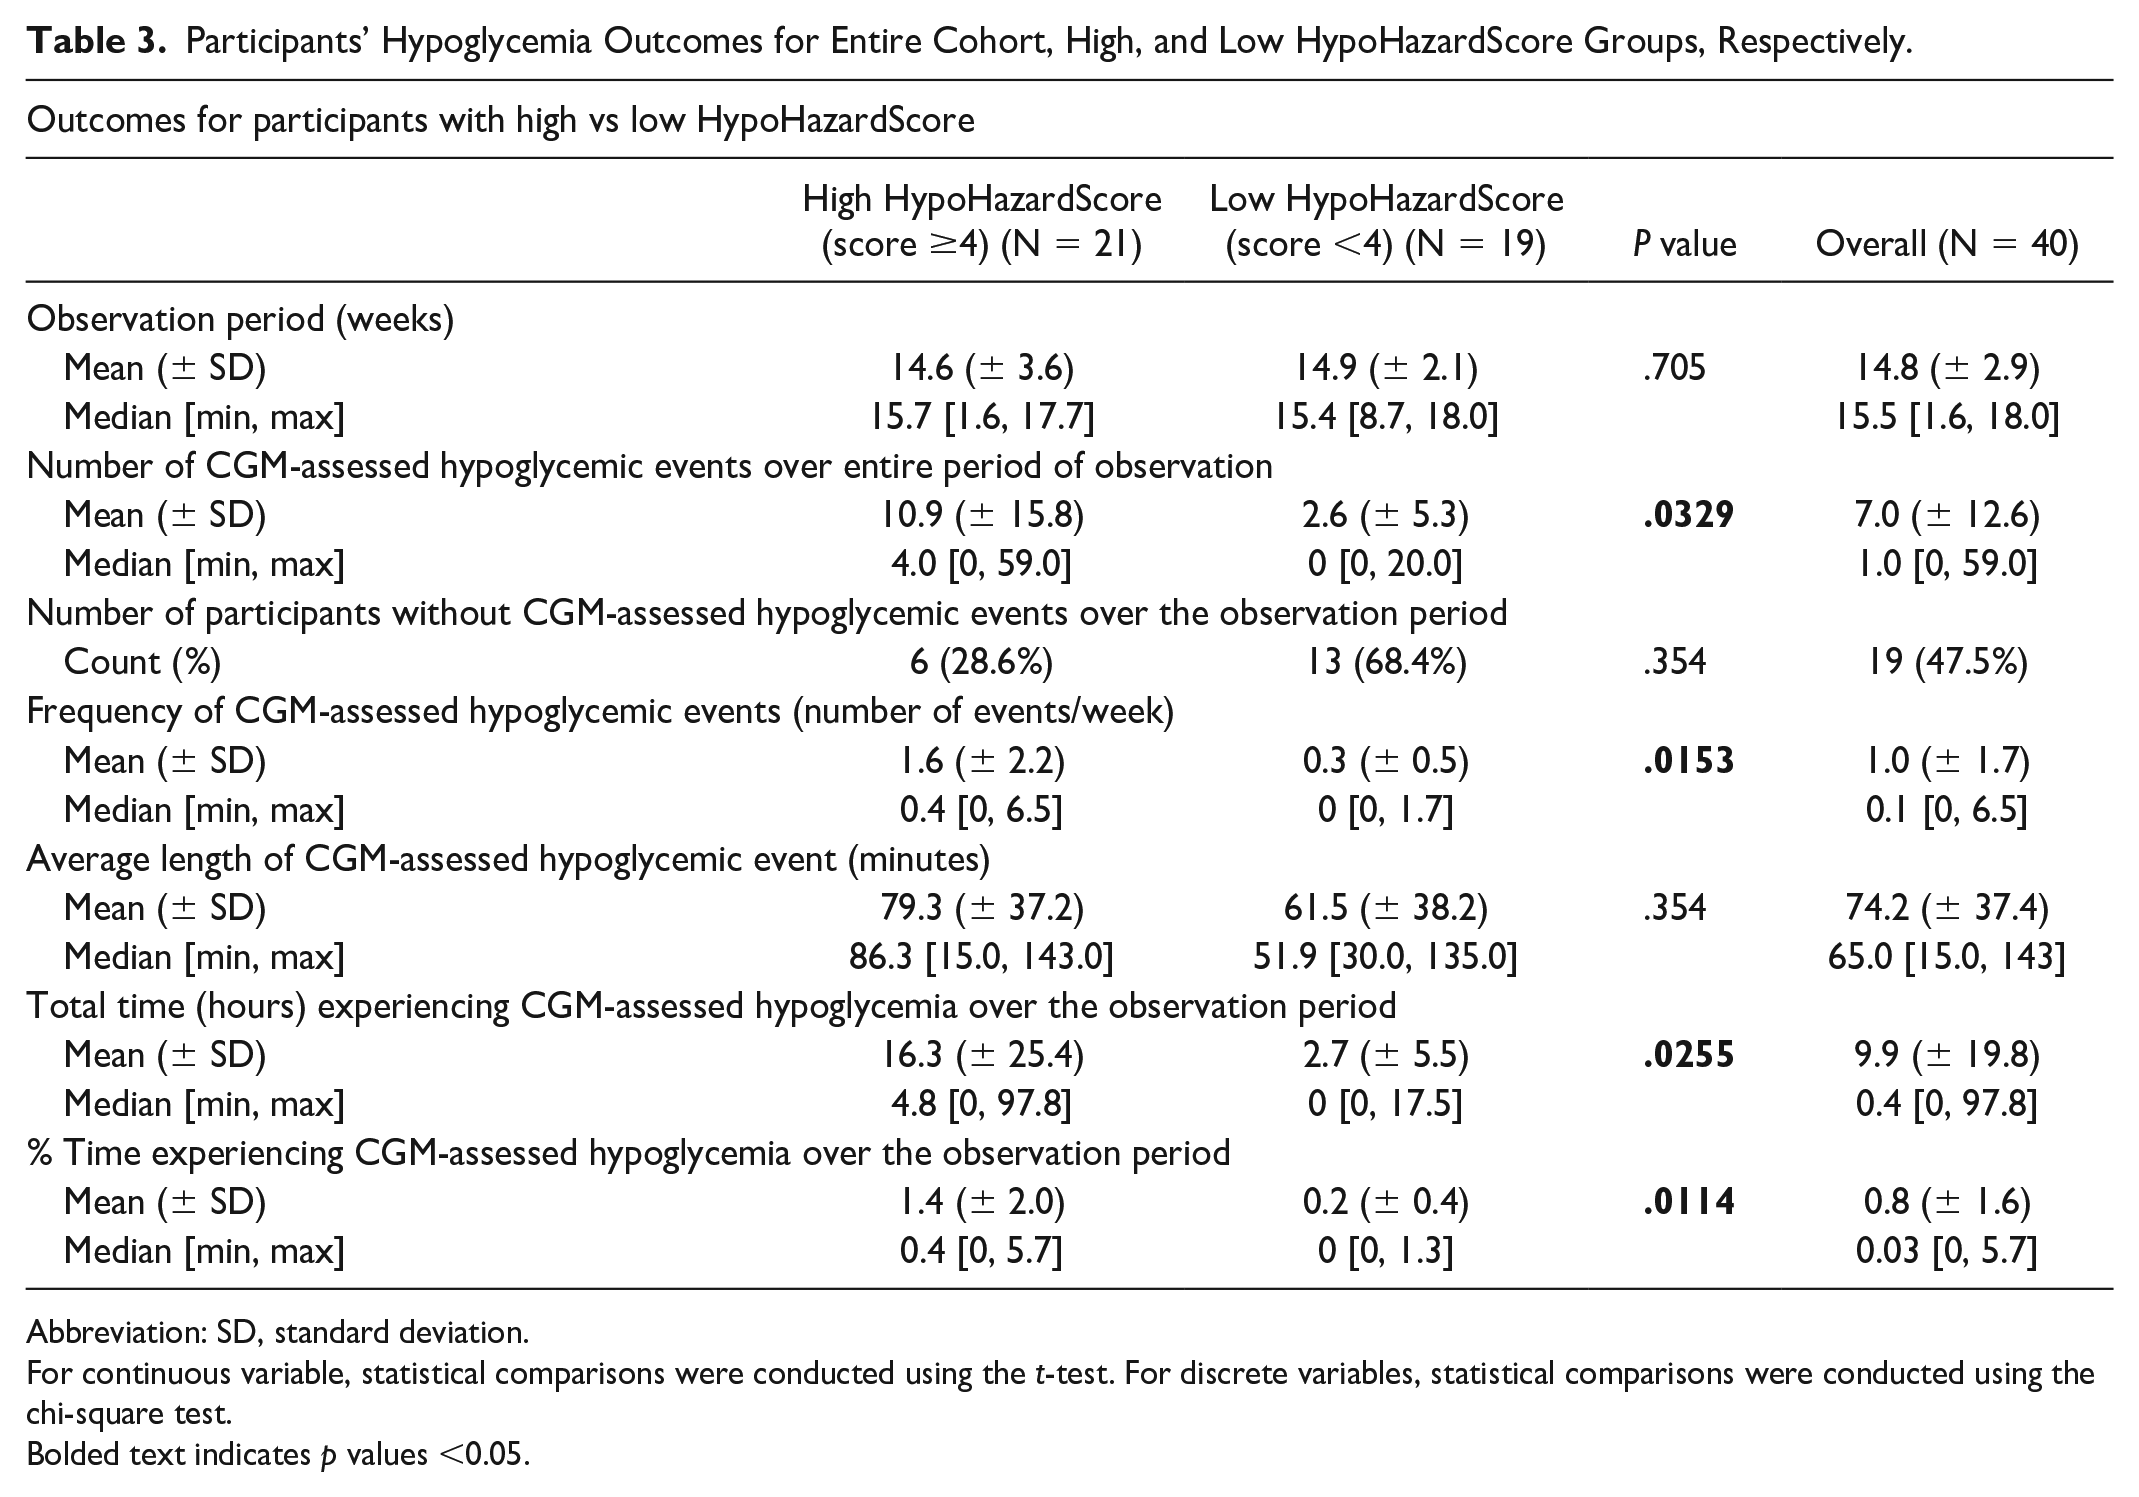
Abbreviation: SD, standard deviation.
For continuous variable, statistical comparisons were conducted using the t-test. For discrete variables, statistical comparisons were conducted using the chi-square test.
Bolded text indicates p values <0.05.
The high HypoHazardScore group had significantly higher rates of self-reported hypoglycemia requiring treatment compared to the low HypoHazardScore group (P < .04). Throughout the observation period, the high HypoHazardScore group reported an average of 1.81 ± 3.87 hypoglycemic events requiring treatment, whereas none of the participants in the low HypoHazardScore group reported any such events.
Discussion
We conducted a proof-of-concept study to develop the HypoHazardScore, an EHR-based risk model for hypoglycemia in T2DM. We validated the HypoHazardScore in a prospective 16-week clinical study, where it successfully predicted the occurrence of CGM-assessed hypoglycemia. We found that a higher HypoHazardScore was associated with increased frequency and duration of CGM-assessed hypoglycemia. These findings are particularly relevant due to recent Medicare guideline changes that now cover CGM for T2DM patients using any type of insulin as well as patients not using with a history of hypoglycemia. 28
This study identifies the difficulties encountered when translating a risk model into an EHR-based decision support tool. The first challenge was selecting the appropriate data set for model development. We opted for the ACCORD clinical trial data because of its hypoglycemia documentation and adjudication. Moreover, the ACCORD data set encompasses diverse data elements that can be aligned with EHR data elements. The second challenge focused on validating the risk assessment tool. While EHR-based risk models are typically evaluated through prospective studies using EHR data, we deemed this approach unsuitable due to under-documentation of hypoglycemia within the EHR. Therefore, we validated our HypoHazardScore against a prospective, 16-week study using CGM-assessed hypoglycemia, providing a more objective assessment of hypoglycemia than prior studies.12-15,29
This proof-of-concept study highlights the possibility of leveraging EHR-derived data to create personalized prediction models. The HypoHazardScore holds promise for various applications, such as assessing a participant’s personalized hypoglycemia risk in research studies or developing clinical decision support tools to customize CGM prescription for patients with T2DM. This is particularly relevant considering that CGM usage is predominantly initiated in patients with T1DM (91%) rather than those with T2DM (9%). 29 Finally, continuous prediction of hypoglycemia risk could be possible by integrating the HypoHazardScore with real-time CGM data.
The study has several strengths. First, the validation study gathered a detailed data set, encompassing participants with diverse predicted hypoglycemic risk who wore CGM continuously for 16 weeks. This data set offers valuable insights into the frequency of short-term hypoglycemia (measured over weeks), an understudied topic in patients with T2DM. Second, the study rigorously documented CGM-assessed hypoglycemia, defining a hypoglycemic event as glucose levels <54 mg/dL sustained for at least 15 minutes as measured by both CGM sensors.
Several limitations exist. The HypoHazardScore is derived from the ACCORD study, which does not incorporate newer treatments for T2DM, such as sodium-glucose transport protein 2 (SGLT2) inhibitors, glucagon-like peptide-1 (GLP-1) agonists, or gastric inhibitory polypeptide (GIP)/GLP-1 agonists. These treatments have shown diverse benefits beyond glycemic control, potentially altering the relative contribution of the HypoHazardScore components (eg, sulfonylureas). The validation cohort was relatively small and restricted to a single health system, possibly affecting the generalizability of the findings to other populations. In addition, the performance of the HypoHazardScore relies on EHR data quality, which can vary across different health systems. While we mitigated potential issues by requiring CGM data from both sensors, the use of the first-generation FreeStyle Libre system may still be influenced by sensor-related overestimation of hypoglycemia. Finally, it is important to recognize that the HypoHazardScore represents a “point in time,” and ongoing monitoring of its performance and relevance to the current patient population is necessary. Model updates should be considered as performance shifts occur, clinical practices evolve, and new discoveries become pertinent.30,31
Conclusions
In a proof-of-concept study, we developed the HypoHazardScore, an EHR-based risk model for hypoglycemia by translating a clinical trial prediction model. We validated the HypoHazardScore’s effectiveness in a prospective study, using CGM-assessed hypoglycemia as the outcome. Our goal is to demonstrate potential of the HypoHazardScore as an EHR-based decision support system, with the ultimate goal of identifying and reducing hypoglycemia frequency in patients with T2DM.
Supplemental Material
sj-docx-1-dst-10.1177_19322968231184497 – Supplemental material for Development and Validation of an Electronic Health Record–Based Risk Assessment Tool for Hypoglycemia in Patients With Type 2 Diabetes Mellitus
Supplemental material, sj-docx-1-dst-10.1177_19322968231184497 for Development and Validation of an Electronic Health Record–Based Risk Assessment Tool for Hypoglycemia in Patients With Type 2 Diabetes Mellitus by Sisi Ma, Alison Alvear, Pamela J. Schreiner, Elizabeth R. Seaquist, Thomas Kirsh and Lisa S. Chow in Journal of Diabetes Science and Technology
Footnotes
Acknowledgements
The authors thank Dr Niki Oldenburg for her critical review and manuscript edits.
Abbreviations
ACCORD, Action to Control Cardiovascular Risk in Diabetes; CGM, continuous glucose monitoring; EHR, electronic health record; SMBG, self-monitored blood glucose; SH, severe hypoglycemia; T1DM, type 1 diabetes mellitus; T2DM, type 2 diabetes mellitus.
Declaration of Conflicting Interests
The author(s) declared the following potential conflicts of interest with respect to the research, authorship, and/or publication of this article: For potential conflict of interest disclosure, LSC acknowledges several investigator initiated grants from DEXCOM for product only. The remaining authors have no relevant conflicts of interest.
Funding
The author(s) disclosed receipt of the following financial support for the research, authorship, and/or publication of this article: The study was supported by the University of Minnesota, Academic Health Center (AHC-FRD-17-08 to LSC) and the National Institutes of Health (NIH National Center for Advancing Translational Sciences, UL1TR002494 and UL1TR000114, National Institute of Diabetes and Digestive and Kidney Diseases, R01DK095360 to ERS). UL1TR000114 also supported SM’s time on this project.
Supplemental Material
Supplemental material for this article is available online.
References
Supplementary Material
Please find the following supplemental material available below.
For Open Access articles published under a Creative Commons License, all supplemental material carries the same license as the article it is associated with.
For non-Open Access articles published, all supplemental material carries a non-exclusive license, and permission requests for re-use of supplemental material or any part of supplemental material shall be sent directly to the copyright owner as specified in the copyright notice associated with the article.