
Abstract
Background and Objectives:
Incidence of type 1 diabetes mellitus (T1DM) is increasing, and these patients often have poor glycemic control. Electronic dashboards summating patient data have been shown to improve patient outcomes in other conditions. In addition, educating patients on T1DM has shown to improve glycated hemoglobin (A1C) levels. We hypothesized that using data from the electronic dashboard to monitor defined diabetes management activities to implement population-based interventions would improve patient outcomes.
Methods:
Inclusion criteria included patients aged 0 to 18 years at Phoenix Children’s Hospital with T1DM. Patient data were collected via the electronic dashboard, and both diabetes management activities (A1C, patient admissions, and visits to the emergency department) and patient outcomes (patient education, appointment compliance, follow-up after hospital admission) were analyzed.
Results:
This study revealed that following implementation of the electronic dashboard, the percentage of patients receiving appropriate education increased from 48% to 80% (Z-score = 23.55, P < .0001), the percentage of patients attending the appropriate number of appointments increased from 50% to 68.2%, and the percentage of patients receiving follow-up care within 40 days after a hospital admission increased from 43% to 70%. The median A1C level decreased from 9.1% to 8.2% (Z-score = −6.74, P < .0001), and patient admissions and visits to the emergency department decreased by 20%.
Conclusions:
This study shows, with the implementation of an electronic dashboard, we were able to improve outcomes for our pediatric patients with T1DM. This tool can be used at other institutions to improve care and outcomes for pediatric patients with T1DM and other chronic conditions.
Introduction
Worldwide, the incidence of type 1 diabetes mellitus (T1DM) is increasing by 2% to 5% per year 1 ; in the United States, an estimated 1 in 300 children have T1DM. 1 The rate of new-onset cases has escalated even faster during the COVID-19 pandemic. 2 In addition, a recent study across eight high-income countries looked at children and adolescents with T1DM and reported that patients in the United States had the second highest levels of glycated hemoglobin (ie, A1C)—an indicator of poor glycemic control—with an average A1C level of 8.7%. 3 A1C at 18 months following a diagnosis is highly indicative of the steady-state A1C value that the patient will establish across their lifetime. 4 Unfortunately, this time frame is also one in which many patients have not yet achieved adequate glycemic control. Hyperglycemia is associated with both short- and long-term negative effects in pediatric patients, 5 and there is an increased rate of hospitalizations and admissions in pediatric patients with T1DM and poor glycemic control. 6 Given the ever-growing population of individuals with T1DM, there is a need to understand the management of this disease to improve the long-term health outcomes for these patients.
The use of electronic dashboards has already been implemented at a handful of institutions and in various pediatric departments. Results from these projects have been promising. One study in pediatric patients with inflammatory bowel disease found decreased rates of iron deficiency through the use of an electronic dashboard that tracked screening for anemia and iron deficiency as well as iron supplementation. 7 A previous study at Phoenix Children’s Hospital (PCH) demonstrated that the use of electronic dashboards improved identification of pediatric cancer patients who were receiving inadequate anti-emetic medications, allowing providers to modify their regimens to improve control of nausea and vomiting during cancer treatment. 8
In patients with T1DM, both patient education and consistent and appropriate follow-up with health care providers have been shown to improve outcomes. For example, a study by Prahalad et al 9 showed improved clinical outcomes in patients who were given in-depth education on their disease by a team of health care providers and educators. For patients to receive adequate education concerning their diagnosis, they must be actively engaged in, and attending, appropriate visits with their providers. In fact, following the recommended visit schedule (four visits per year) has independently been shown to associate with better glycemic control for T1DM patients than for those who attended fewer visits. 10 Thus, we hypothesized that utilizing an electronic dashboard to track both patient education and attendance of health care appointments would improve glycemic control in our patient population at PCH.
In this report, we describe the development and implementation of a T1DM electronic dashboard as a quality improvement (QI) project and review the results to date. The aims of this project were to (1) identify the characteristics that correlate with A1C in our T1DM patient population; (2) use those data to inform evidence-based care practices to (3) implement practice changes aimed at improving glycemic control; and (4) monitor the data through the electronic dashboard to assess for efficacy of our interventions through diabetes management activities.
Methods
Context
Data for this QI project come from patients that were seen in the endocrinology clinic at PCH between 2017 and 2021. Patients aged 18 years or younger were enrolled. PCH serves approximately 2000 unique children and teenagers with T1DM across the Phoenix metropolitan region, as well as from more distant communities through the use of telehealth. All patients in our center diagnosed with T1DM have diabetes antibodies checked. We start with glutamic acid decarboxylase-65 a antibodies (GAD-65) and islet-antigen 2 (IA-2A). If those are negative, we obtain additional diabetes antibodies, such as ZnT8. If all antibodies remain negative, they are not considered to have T1DM, and a different diagnosis code is used. In the last five years, we began integrating A1c values, visit frequency, education received, insulin regimen type, number of hospitalizations, and other metrics related to T1DM from patient electronic medical records (EMR) into a data dashboard to track outcomes. Our first project aim was to identify factors preventing good outcomes, including hospitalizations and glucose levels, and to find interventions that improve quality care for this patient population.
Dashboard Development
To track diabetes management activities and patient outcomes on a population level, we created a monthly data report on all T1DM patients at PCH through collaboration with the IT department. It summarizes A1C by age group, insurance type, emergency department (ED) visits, admissions, insulin regimen, and patients with elevated A1C (>8% = moderate elevation, >9.5% = severe elevation). Monthly data reports were created with goals of funneling these data into an electronic dashboard integrated with the EMR used at PCH, Allscripts Sunrise, to clearly display and summarize overall patient data, inclusive of information about glycemic control and documentation of recent diabetes education.
After the initial data mining was conducted, adjustments were made to the data collection algorithm to allow for consistency and accuracy. Adjustments included further refinement of the definitions of what constitutes a patient visit and what should be referenced to as the patient’s A1C. With each change made, the data collection algorithm was presented to the team to ensure group confidence in collection methods. The team’s confidence in the clinical relevance of the data was also evaluated before implementing interventions based on findings generated from the dashboard.
Using the refined algorithm, the project was piloted in a small sample of patients (N = 10) with poor control of T1DM (A1C > 8%). The project was then expanded to include 40 patients, as described in two previously presented abstracts.11,12 The pilot project helped cultivate an understanding of possible interventions to help improve control A1C in patients with T1DM on a population level. This information was used alongside the data collection algorithm and other research findings to develop a visually appealing and usable dashboard to be utilized by our diabetes team on a week-to-week basis (Figure 1).
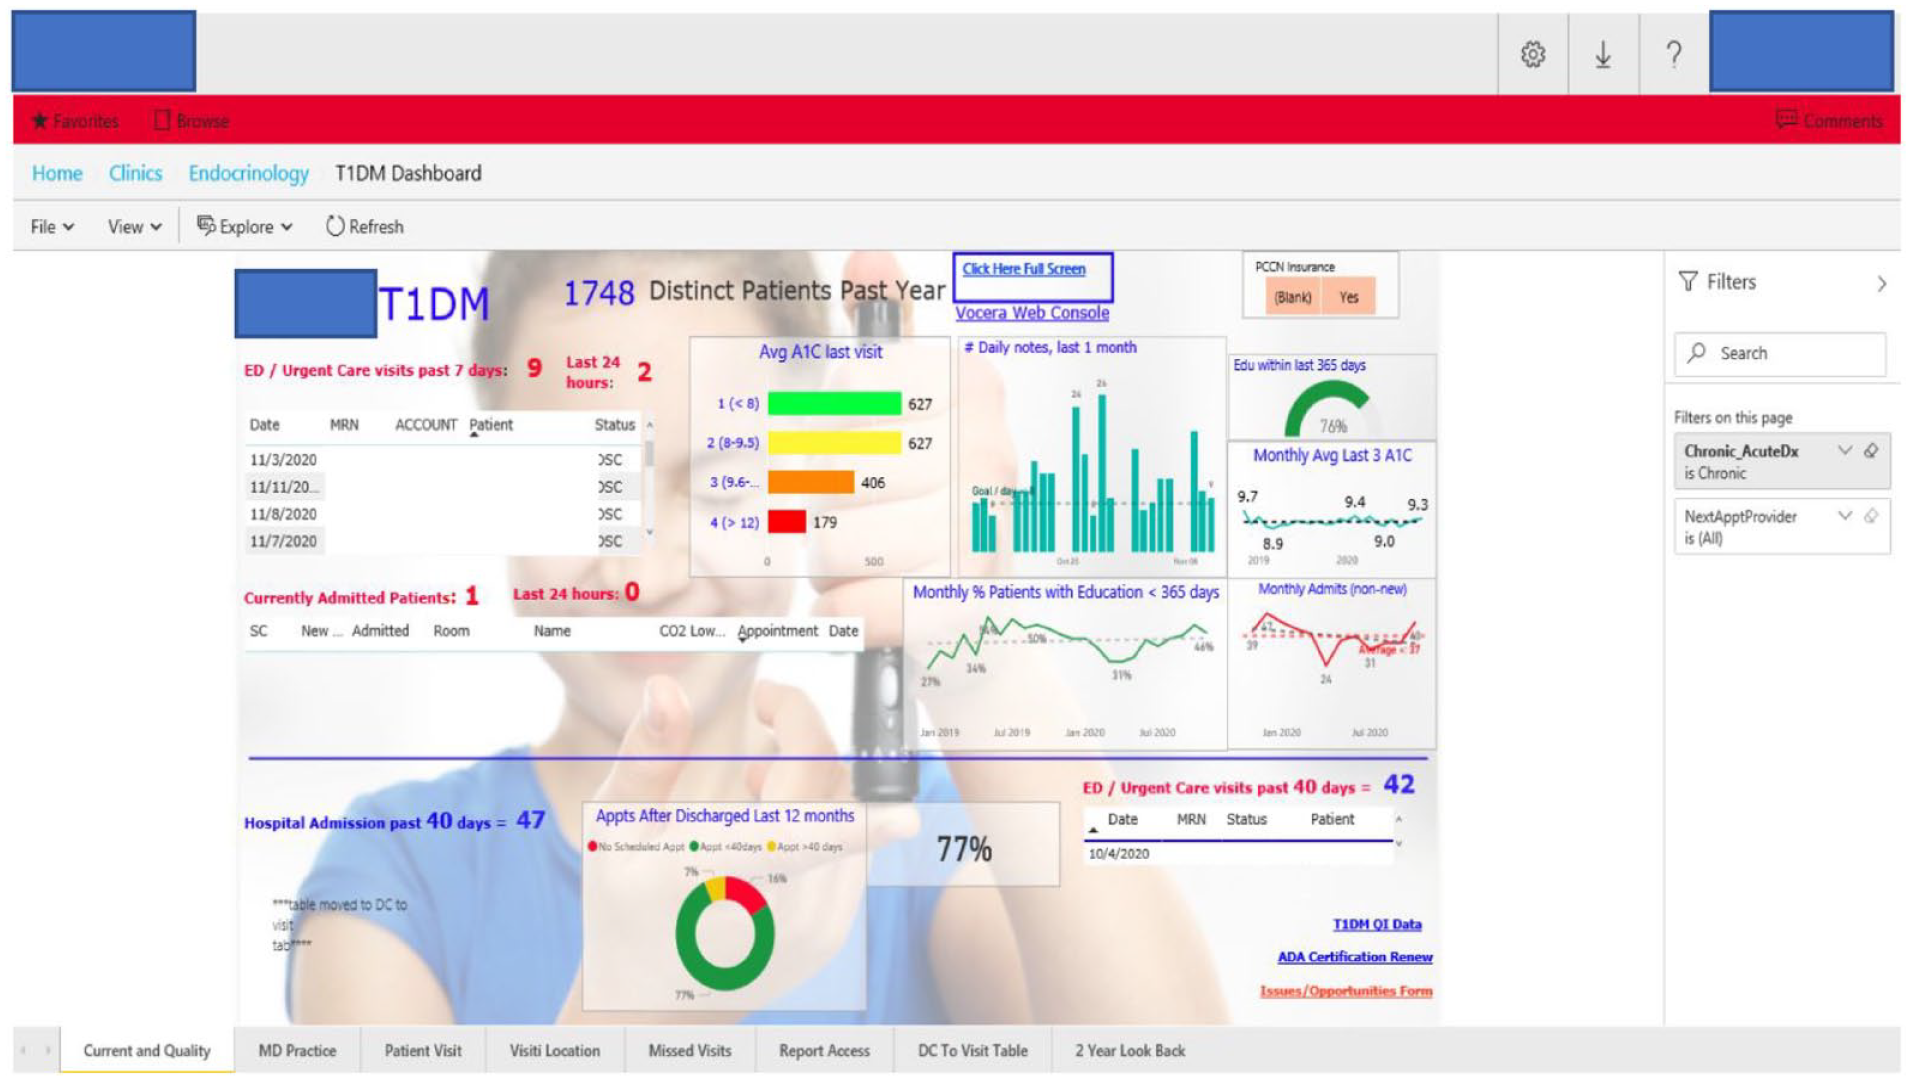
Overall depiction of dashboard interface.
Dashboard Components
The first tab of the dashboard is a quality page that summarizes general metrics of our patients with T1DM. A visit location tab helps providers and clinicians with patient-specific pre-visit planning by identifying which PCH site throughout the metropolitan area the patients will be visiting for their appointments and categorizing them based on the “severity” of their need to see a diabetes educator. Factors incorporated into the “severity” score include A1C, frequency of visits, and the visit date from the last time they saw a diabetes educator. Our dashboard also includes an individual physician tab that allows physicians to review data specific to patients on their service, in terms of breakdowns for A1C, location of patient appointments, insurance type, and other factors. Another tab provides a list of patients who are not being seen in the clinic as frequently as recommended, which includes those who had missed appointments over the past six months; this helps ensure follow-up to confirm a subsequent appointment. The same page also provides a list of hospitalized patients whom we determined should always have outpatient follow-up within six weeks or sooner following any admission.
Intervention
Our dashboard allowed us to begin implementing clinic-wide interventions. We developed specific interventions directed at our patient population to improve glycemic control. These data were reviewed at weekly and monthly quality meetings. Weekly meetings are conducted by our quality lead who is a certified diabetes educator and the diabetes program manager and are used to conduct pre-visit planning for incoming patients. The dashboard is used to provide details about the patients for each week, including the location of their visit and the “severity” of their glycemic control. Patients with a high “severity” score will be scheduled for a joint visit with their physician as well as a diabetes educator. After the visit, the A1C is used to guide the personalized intervention for the subsequent four months in terms of the number of patient contacts and visits with a diabetes educator recommended before the next physician visit. We continuously track the characteristics, outcomes, and other factors listed above in our monthly quality meetings.
Study of the Intervention
Each month, each patient’s most recent A1C values were collected, and the median was calculated. To compare outcomes after interventions with patient outcomes prior to intervention, the average of data points between February 2017 and August 2017 was calculated, and the standard deviation was calculated to determine the normal month-to-month variation in our variables. This average was then compared with our outcomes in December 2021, and a Z-score was calculated along with a P value to determine any statistically significant differences between the values before and after interventions.
Measures
Primary outcome
The primary outcome was the percentage of T1DM patients with non-elevated A1C levels (<8%).
Secondary outcomes
The secondary outcomes related to diabetes management activities included the percentage of patients that (1) received diabetes education with the past year, (2) attended recommended number of appointments, and (3) received follow-up appointments within 40 days of hospital admission. Additional secondary outcomes included the percentage of patients who are admitted and percentage of patients who visited the ED.
Process outcome
The process outcome was the change in median A1C levels in conjunction with the T1DM patient volume.
This project has been approved by the institutional review board as a QI project at PCH.
Results
The use of the dashboard has led to changes in both our rates of diabetes management activities and our patient outcomes. The number of patients monitored through the dashboard each year ranged from 1514 to 2100. Prior to the implementation of the dashboard in 2020, only 50% of our patients with T1DM had seen a diabetes educator in the past year. This increased to 82% of our patients by the end of 2021 (Z-score = 23.55, P < .0001). In addition, the percentage of patients attending the recommended number of visits per year (four or more) increased from 50% to 68.2% over this same time period. We also report a 63% increase in patients’ follow-up with their diabetes team within 40 days of a hospital admission, increasing from 43% of patients prior to dashboard implementation to 70% at present (Figure 2).
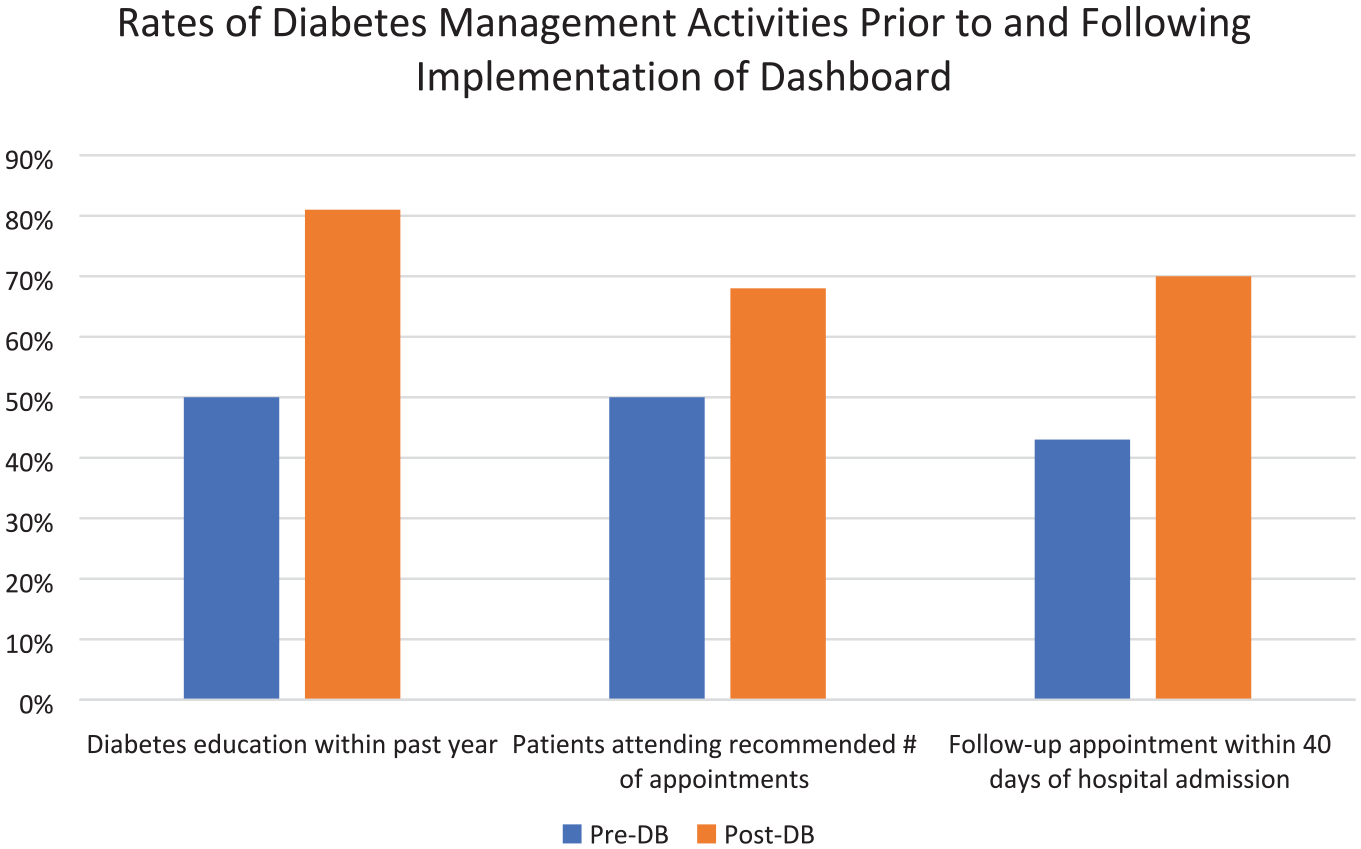
Rates of diabetes management activities contributing to glycemic control in pediatric patients with type 1 diabetes mellitus prior to and following the implementation of the electronic dashboard.
As is shown in Figure 3, the percentage of patients achieving an A1C value below 8% increased each year over a three-year period since the implementation of the electronic dashboard. Across all T1DM patients, median A1C levels have decreased from 9.1% to 8.2% over the last 3.5 years (Z-score = −6.74, P < .0001), according to patients’ most recently measured A1C level. Among Medicaid patients, median A1C levels decreased from 9.6% to 8.9% (Z-score = −3.83, P = .00006) at the time of study cutoff in December of 2021. Patient admissions and visits to the ED also declined by 20% from the beginning of the project in 2017 up until the COVID-19 pandemic in March of 2020. After this point, admission and ED visits did not increase but ceased to decline. The number of patients with T1DM at PCH has increased over the past four years, but nonetheless, the median averaged A1C of this patient population has continued to decline (Figure 4).
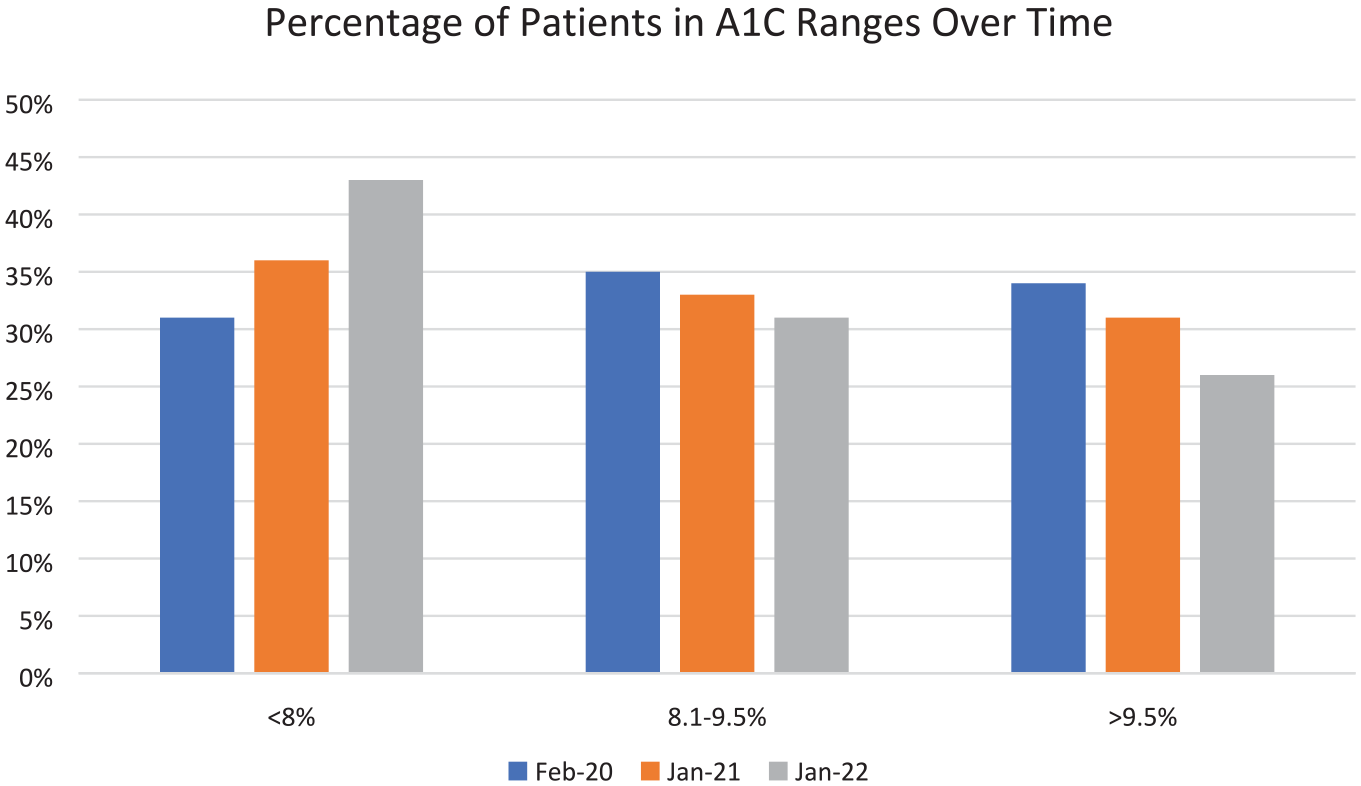
Percentage of patients in A1C ranges each year following the implementation of electronic dashboard and related interventions.
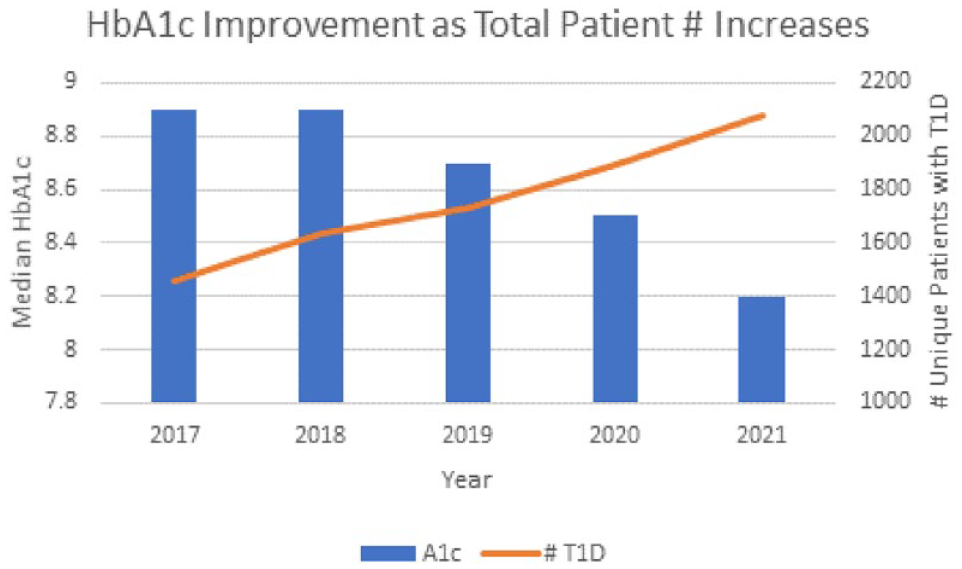
A1C improvements each year and corresponding increase in total patient population.
Discussion
Summary
In this report, we described the development and launch of a T1DM QI dashboard that allows for real-time tracking of patient progress and opportunities for interventions to improve care. This dashboard is now used on a weekly basis to manage our care delivery to optimize patient outcomes. The dashboard is necessarily tailored to the patient population and specifics of PCH, but the principle of integrating patient data into dashboards that can help clinicians track patients is very generalizable to other institutions.
Interpretation
Through the implementation of this tool at PCH, we were able to achieve improvement in many metrics of T1DM control in pediatric patients. The American Diabetes Association (ADA) recommends that pediatric and adolescent patients diagnosed with T1DM receive diabetes education at the time of diagnosis and future education routinely, with a minimum of four appointments each year. 13 This recommendation is in place as frequent contact with the care team is known to correlate with better type 1 diabetes care and outcomes. 9 Our use of the electronic dashboard to track activities like diabetes education led to an increase in such activities that promote disease management and demonstrates the potential of leveraging technological tools to improve patient outcomes here and at other institutions. Achieving the recommended number of provider visits per year allows an opportunity for continued patient education about T1DM, and the increase in the percentage of patients receiving four or more visits per year will likely continue to help improve the number of patients receiving adequate patient education.
It is well documented that a lower A1C level and improved glycemic control in patients with T1DM lead to better outcomes, yet glycemic control has been proven difficult to achieve for many pediatric patients. However, by focusing efforts on patient monitoring and diabetes management activities, we were able to make significant impact on decreasing A1C levels in our patient population in a manner that was cheap and easily integrated into the management of a clinical practice. Although the ADA recommends an A1C of less than 7%, 13 the decrease in A1C in our patient population as a result of the electronic dashboard suggests that further interventions might continue to lower the median A1C level of our patients.
A potentially confounding factor in our study is the advancement of technology for diabetes management. We do not have data regarding patients that began using a “closed-loop” system over this time period, but we do assume that the increase in the use of closed-loop systems was substantial. Our data do show that continuous glucose monitoring system (CGMS) use increased, from less than 30% to approximately 45% over the last several years in our practice. An analysis of our 2022 data shows A1C is lower by 0.9% in all patients and 0.7% in Medicaid patients on CGMS although we do not have similar analysis for prior years. Overall, we can infer that the drop in A1C is a combination of technological advances and greater education access. In fact, it is education that facilitates increased technology use because seeing an educator is how our patients begin using new devices.
This QI study has many strengths. First, as detailed previously, PCH has a large population of pediatric patients with T1DM and, thus, was a great institution to conduct this study. Future studies would benefit from an even larger patient population to determine if similar benefits are seen from the implementation of the electronic dashboard for patient monitoring. Our study was also conducted at very low cost because the data collected were already gathered through our EMR. Our ratio of educators to providers increased slightly during the study. To manage the increase in education needed for patients, diabetes educators were allocated more efficiently, primarily by planning and scheduling the distribution of educators appropriately. When scheduling was not possible, we used Zoom to bring offsite educators into the room with the care provider. The affordability of this project makes the implementation of our techniques and replication of our research feasible for many other institutions.
A limitation of this study and potential area for future research is the QI nature of our study. Data were collected on a population level for the most part, and therefore, certain data were not ascertained. This includes how many patients were duplicates year to year. In addition, there were other variables that should be considered for future analysis. For one, our patients were not categorized by years since their diagnosis. While we did track date of and time since diagnosis, we did not include this in our initial analysis. This may be important due to the “honeymoon phase” seen with the initial diagnosis of T1DM. Also, because many patients visit the ED in diabetic ketoacidosis (DKA) and with an A1C >10, it makes sense that their glucose control may improve over the subsequent three months. In addition, patients who have received years of personalized care may also have improved A1C compared with those with a newer diagnosis. In this way, differences in time since diagnosis between groups could impact results. The portion of patients with new-onset T1DM is about 10% per year in our population. However, since new patients were included in the analysis both in the pre-intervention and post-intervention periods, we do not imagine this would significantly impact our results. Nonetheless, it would be worthwhile to take a closer look.
Another limitation to consider is differences in outcome by insurance type. In our study, we were able to collect information from most patients about insurance type, but our study model did not consist of a separate analysis for this. In the 2021 cohort of patients, of the 1359 patients with insurance type available, 42.6% of patients received Medicaid, 57.0% of patients received private insurance, and 0.4% of patients were self-pay. To determine if any health disparities exist in insurance status and glycemic control, future studies should separate their cohorts based on insurance coverage. Finally, while our type of data collection was only possible on a population scale, future studies would benefit from obtaining individual patient data to further classify patient characteristics to determine any differences in outcomes based on these factors.
In the future, this dashboard can be implemented to specifically examine differences in glycemic control by socioeconomic and racial population factors. It is well established that there are disparities in glycemic control among minority groups. A1C values have been found to be higher in black/African American patients with T1DM than in their white and Hispanic counterparts, 14 in addition to higher incidence of DKA and severe hypoglycemic events in black patients. This is evidence that further efforts focusing specifically on minority groups must be made to improve control of glucose levels in pediatric patients with T1DM. It has also been shown that QI projects have been used to identify these health disparities in individual practices and have allowed for providers to make adequate changes in their practices. 15 Our dashboard could be adapted to collect information on patients categorized into different socio-economic, racial, and ethnic groups to determine if similar disparities are occurring in our patient population at PCH. We could elucidate if there are any differences in which treatments are given and what outcomes are experienced for patients of different groups and perhaps adjust as needed to provide more comparable and appropriate care for all patients. We are now working on further projects to identify and study these factors. Our hope is that this study will impact how individuals monitor and care for pediatric patients with T1DM and that other institutions will implement electronic dashboards to achieve these goals.
Conclusions
Our QI project has shown that by organizing our data into an understandable and user-friendly format, we were able to create meaningful changes in patient education, appointment compliance, glycemic control, and hospital admissions in our patient population with data that were already being collected. This is a simple strategy that can be implemented at other institutions to improve glycemic control in pediatric patients with T1DM.
Footnotes
Abbreviations
DKA, diabetic ketoacidosis; PCH, Phoenix Children’s Hospital; T1DM, type 1 diabetes mellitus.
Declaration of Conflicting Interests
The author(s) declared no potential conflicts of interest with respect to the research, authorship, and/or publication of this article.
Funding
The author(s) received no financial support for the research, authorship, and/or publication of this article.