
Abstract
Background:
Achieving optimal glycemic control for persons with diabetes remains difficult. Real-world continuous glucose monitoring (CGM) data can illuminate previously underrecognized glycemic fluctuations. We aimed to characterize glucose trajectories in individuals with Type 1 and Type 2 diabetes, and to examine how baseline glycemic control, CGM usage frequency, and regional differences shape these patterns.
Methods:
We linked Dexcom CGM data (2015–2020) with Veterans Health Administration electronic health records, identifying 892 Type 1 and 1716 Type 2 diabetes patients. Analyses focused on the first three years of CGM use, encompassing over 2.1 million glucose readings. We explored temporal trends in average daily glucose and time-in-range values.
Results:
Both Type 1 and Type 2 cohorts exhibited a gradual rise in mean daily glucose over time, although higher CGM usage frequency was associated with lower overall glucose or attenuated increases. Notable weekly patterns emerged: Sundays consistently showed the highest glucose values, whereas Wednesdays tended to have the lowest. Seasonally, glycemic control deteriorated from October to February and rebounded from April to August, with more pronounced fluctuations in the Northeast compared to the Southwest U.S.
Conclusions:
Our findings underscore the importance of recognizing day-of-week and seasonal glycemic variations in diabetes management. Tailoring interventions to account for these real-world fluctuations may enhance patient engagement, optimize glycemic control, and ultimately improve health outcomes.
Keywords
Introduction
Achieving optimal glycemic control for persons with diabetes remains difficult.1,2 This is due in part to the complexity of balancing the risks of hypoglycemia and hyperglycemia as well as the progressive nature of diabetes, particularly in type 2 diabetes (T2D). Even in dedicated glucose-lowering studies for type 1 diabetes (T1D) and T2D, slow rises in hemoglobin A1c (HbA1c) are commonly seen over subsequent years following the acute intervention initiation.3-5 Although the field of diabetes has focused on HbA1c as the key metric of glycemic control over the past decades, there has been growing recognition of its many limitations in capturing the full spectrum of glucose control and the need for more continuous glucose assessments. Modern continuous glucose monitoring (CGM) has greatly improved the potential for further glucose lowering while helping avoid hypoglycemia.6,7 Indeed, short-term clinical trials of CGM in both T1D and T2D (typically 12-26 weeks) have demonstrated greater success in achieving these important glycemic goals. 8 Although we and others have demonstrated that initiating CGM in the real-world environment does appear to improve HbA1c over 6 and possibly 12 months, the longer-term effects of CGM have yet to be fully studied.
Another gap in our understanding of CGM use and glycemic control, particularly in the real-world setting, is that we have insufficient awareness of the more granular patterns of glucose fluctuation over extended periods. Lifestyle, diet, work, and holiday schedules—which may all influence glucose control—change over time and can be influenced by environmental factors such as weather, so tracking long-term glucose fluctuation provides a unique opportunity to identify and understand these patterns. This, in turn, may allow more informed and precise patient self-management choices and diabetes team treatment decisions.
To address these issues related to CGM usage and diabetes care, we have created one of the largest cohorts of T1D and T2D CGM users with detailed long-term glucose data to date within the U.S. Department of Veterans Affairs Health Care System (VA). For 2796 CGM users, we combined their daily CGM glucose data with their electronic health care records (EHRs). Leveraging the extensive follow-up period of these CGM users provided over 2.1 million CGM readings for up to a maximum of six years. This rich dataset provides a unique opportunity to examine trends in glycemic control and the more granular patterns of glucose fluctuation across different times of the year, including holiday seasons. It also allows for assessing how these patterns may be influenced by factors such as initial glycemic control, consistency of CGM use, and regional differences in the United States.
Methods
Cohort
This observational study combined Dexcom CGM device data with VA EHRs, previously described and validated. 9 We identified Veterans ≥21 years old with ≥1 ICD diabetes diagnosis (ICD-9: 250; ICD-10: E10, E11, O24.0X, O24.1X) from 2002 to 2020 who initiated CGM (first Dexcom sensor prescription) between 1/1/2015 and 12/31/2020. We restricted the sample to participants with ≥14 days of Dexcom CGM data. We focused on the first three years (the most data-rich interval), excluding the initial 13 days of CGM use and defining day 14 as baseline. To minimize gaps, we excluded ~5% of users who switched to other CGMs between Dexcom use periods.
Glycemic Metrics
For each participant, Dexcom CGM measures up to 288 individual interstitial glucose readings each day. The daily individual CGM data were aggregated to compute the average daily (1) mean glucose (MG), (2) coefficient of variation (CV), (3) time-in-range (TIR): time between 70 and 180 mg/dL, (4) time-below-range (TBR): below 55 mg/dL and below 70 mg/dL; and (5) time-above-range, time above 180 mg/dL and above 250 mg/dL. We focused on MG and TIR to identify unique temporal patterns. We calculated the percentage of time in CGM use and categorized participants into low- and high-frequency users using a 70% threshold (Supplementary Material).
As low-frequency users may have fewer CGM glucose measures which may lead to inaccurate estimation of trends, we extracted longitudinal HbA1c measurements from EHR (between 1/2015 and 1/2023) to assess consistency in the three-year trends between MG and HbA1c. Approximately 2%/4% of T1D/T2D patients had no HbA1c values during the three years, while approximately 4%/2% of T1D/T2D patients had no pre-CGM HbA1c values.
Statistical Analysis
We defined a week-based alignment of 364 days per year to distinguish between weekdays and weekends. Day 1 begins Monday in Week 1 (January) and day 364 represents the Sunday in Week 52 (December). Week 53, including the last one or two days (leap year) of the year, was not considered as it lacked data for all days of the week. Using the week-based alignment, we investigated, (1) Three-Year Pattern: we calculated the mean MG across subjects for each weekday over three years; (2) Year-Round Pattern: We aggregated each subject’s up to three measurements into a mean, then averaged those means across all subjects for each weekday of each week.
We used linear mixed-effects models (LMM) separated by diabetes type to investigate the temporal pattern of three-year trajectories of MG. The response variable, change in MG, was defined as the daily MG minus the MG measured at baseline. The LMMs included fixed effects: time elapsed since the baseline, the frequency of CGM use (low-frequency (reference) vs high-frequency uses), and diabetes types. Random effects include random intercepts and slopes for time. An interaction between time and frequency of CGM use was included to estimate a slope difference by frequency of CGM use. A similar approach was applied for HbA1c.
We used separate LMMs for each diabetes type with daily MG and TIR as outcomes to examine monthly and day-of-the-week patterns. Month (January as reference) and day-of-the-week (Monday as reference) were included as categorical variables. The models also incorporated additional fixed effects: time (since baseline), baseline age, and CGM use, as well as a random intercept and a random slope for time. Changes in MG were calculated as differences from the average monthly MG or average daily MG, with corresponding standard errors. We computed confidence intervals for each month and day-of-the-week, plus the largest observed differences between any two months or days-of-the-week. Bonferroni correction was applied for multiple comparisons (0.05/21, i.e., 12 for months, 7 for day-of-the-weeks, and 2 for the largest observed differences (1 for months and 1 for day-of-the-weeks)), and both confidence intervals and P values were adjusted to maintain an overall 95% confidence level. We also present individual-level estimates of these largest observed differences, accounting for random effects. Subgroup analyses based on pre-CGM HbA1c levels and U.S. regions are detailed in the Supplementary Material.
All statistical analyses were performed using R (4.4.1, https://www.r-project.org).
Results
Characteristics of Study Participants
The cohort of 892 individuals with T1D and 1,716 with T2D had a median “duration of CGM use” of 1021 days (with an interquartile range (IQR): 580-1097 days) and 965 days (IQR: 470-1097 days), respectively. Among T1D participants, 79.8% identified as Non-Hispanic White, 16.1% as African American, and 3.5% as Hispanic (Table 1). For T2D patients, the corresponding percentages were 75.1%, 17.8%, and 4.0%, respectively. Median baseline HbA1c was 8.3% in T1D and 8.1% in T2D. Insulin pump use was 29.4% in T1D versus 13.2% in T2D. Although the frequency of insulin use (documented within VA EHR) was high in both T1D and T2D (95.9% and 94.1%), oral non-insulin glucose-lowering medication usage was much higher in T2D than T1D (55.8% vs 19.7%). Key baseline characteristics across subgroups, i.e., categories of baseline HbA1c (pre-CGM levels), diabetes type, and the frequency of CGM use, are shown in Supplementary Table S1 and Supplementary Table S2. Supplementary Figure S1 shows the distributions of MG, TIR, TBR of 70 mg/dL, and CV. While MG and TIR were similar between T1D and T2D patients, T1D patients had significantly higher TBR and CV.
Baseline Characteristics by Diabetes Type.
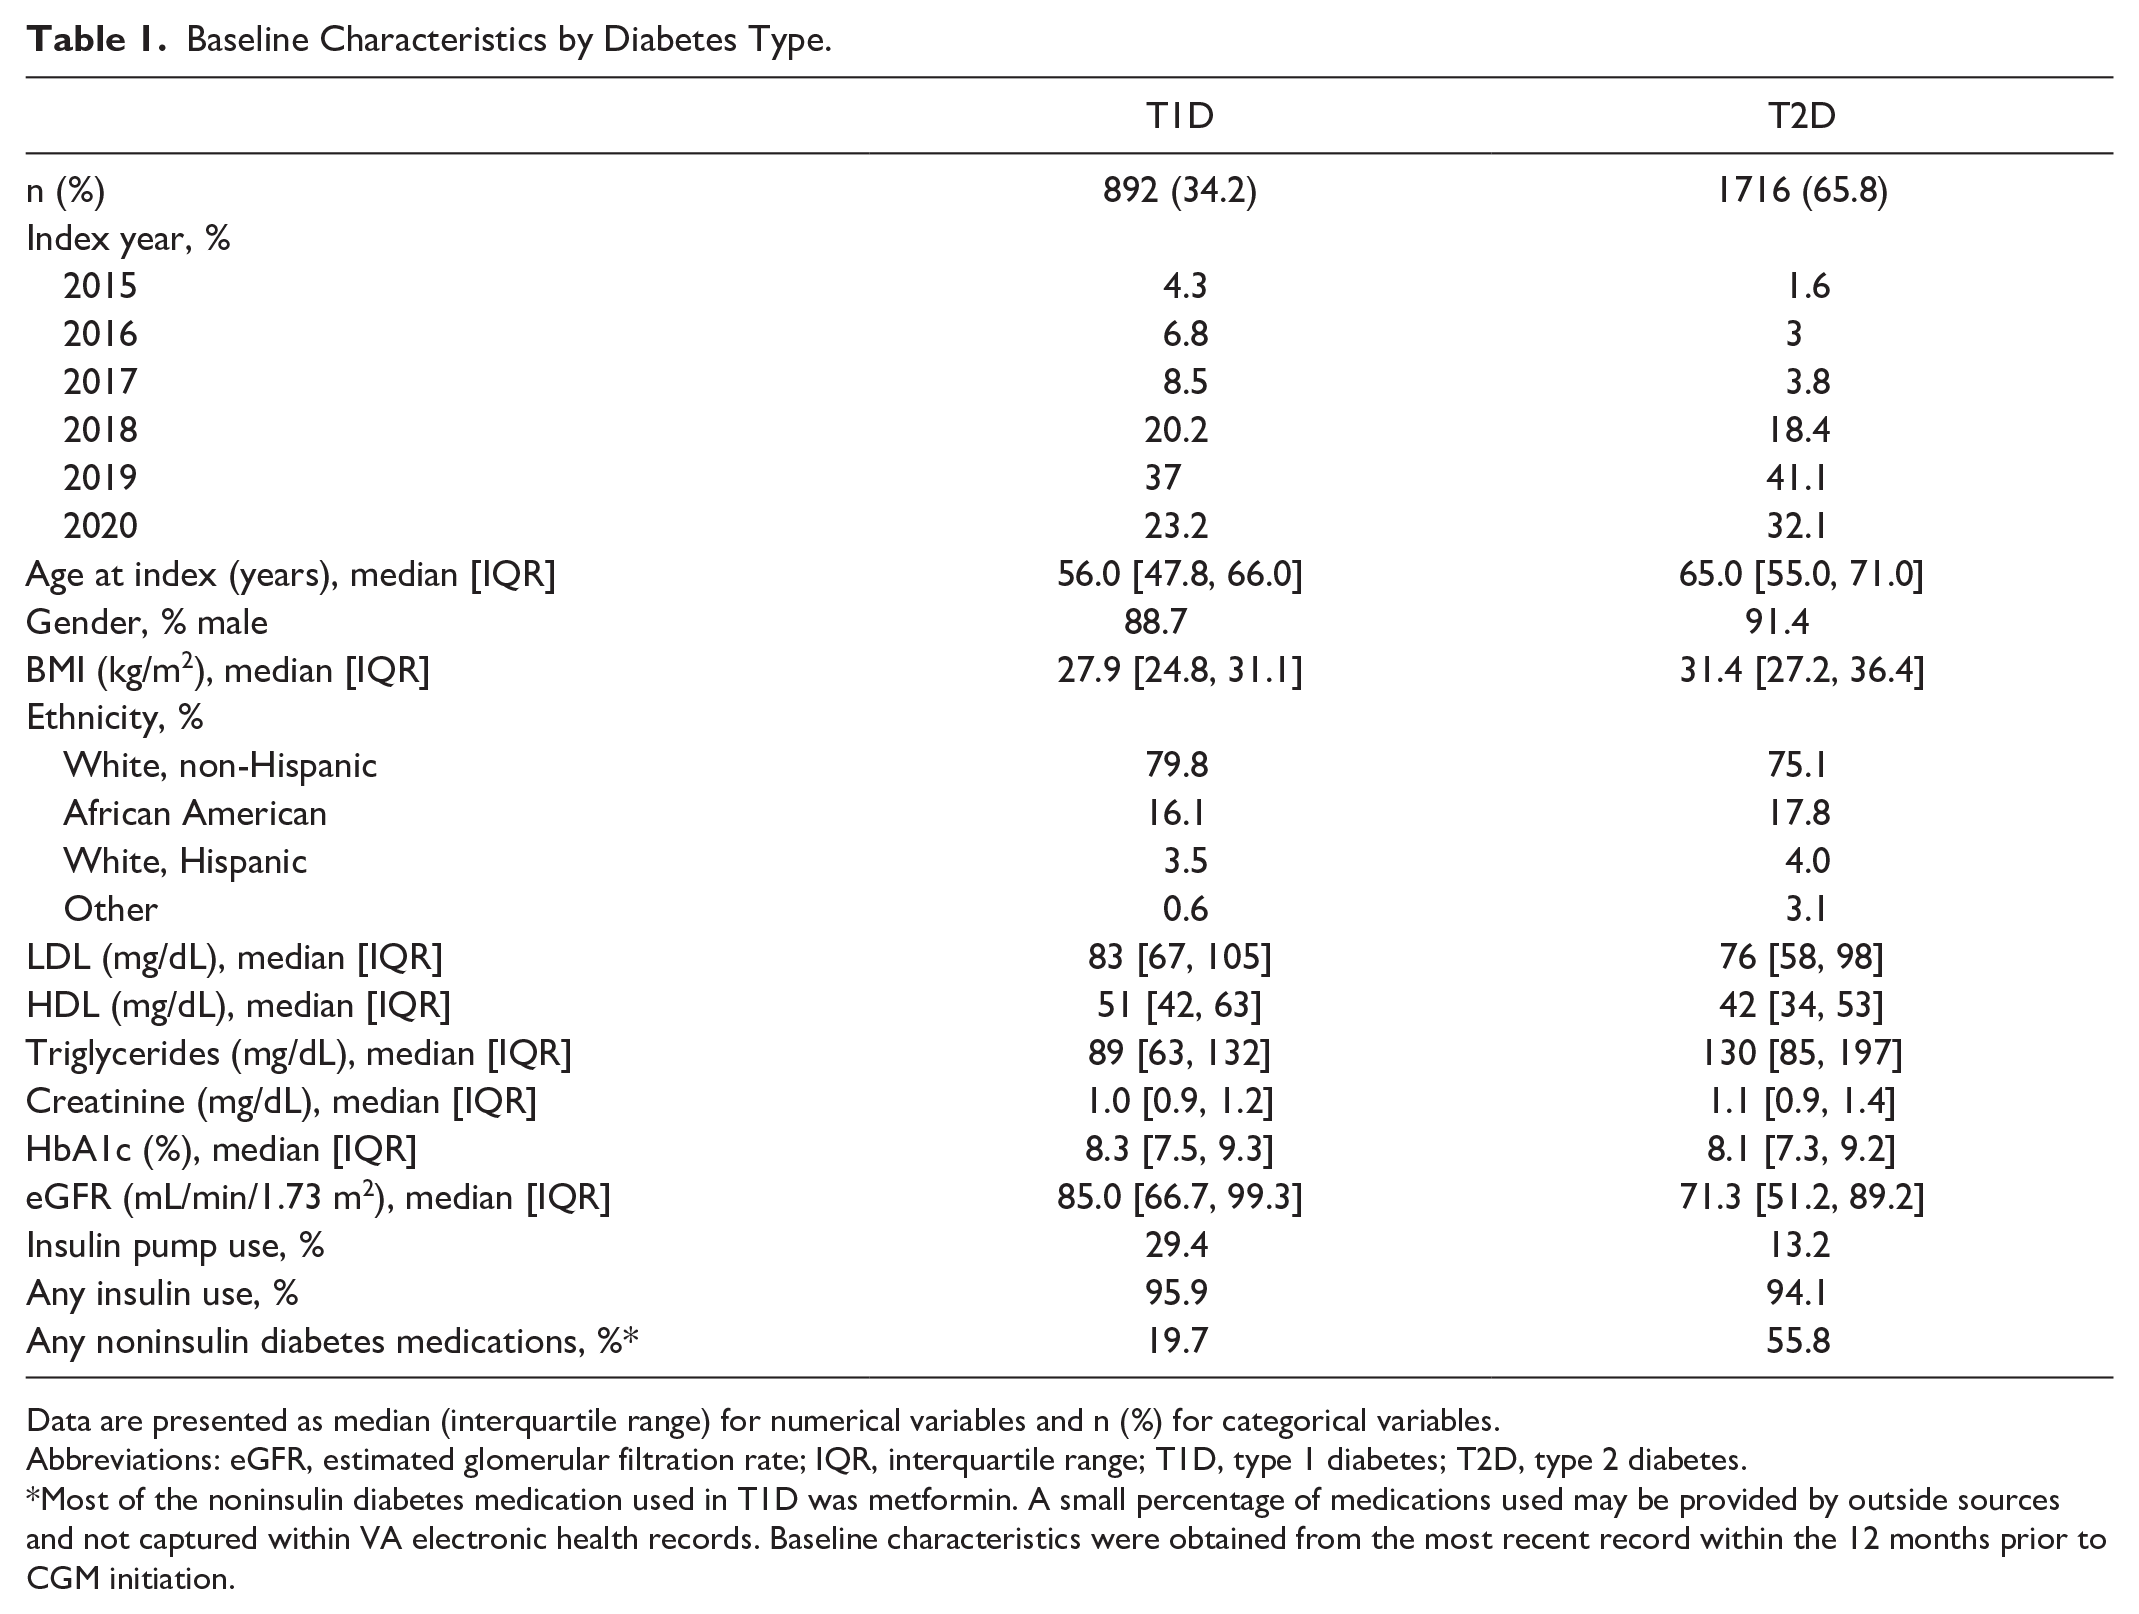
Data are presented as median (interquartile range) for numerical variables and n (%) for categorical variables.
Abbreviations: eGFR, estimated glomerular filtration rate; IQR, interquartile range; T1D, type 1 diabetes; T2D, type 2 diabetes.
Most of the noninsulin diabetes medication used in T1D was metformin. A small percentage of medications used may be provided by outside sources and not captured within VA electronic health records. Baseline characteristics were obtained from the most recent record within the 12 months prior to CGM initiation.
Long-Term Glucose Trend and CGM Usage
Figure 1a shows estimated linear trends in the change of daily MG from the baseline over three years by diabetes type. In this analysis, the time axis represents the time in years elapsed from the baseline. Both T1D and T2D groups exhibited slightly upward trends, yet the slope was lower for T1D patients (1.05 mg/dL per year, 95% CI: −0.03 to −2.12; P = .056) than T2D patients (2.91 mg/dL per year, 1.85-3.97; P < .001). The long-term MG trend varied based on CGM use time (≤70 and >70%). Overall, the more frequent use of CGM, the better the trend in MG levels over time in both T1D and T2D patients (Figure 1b). More specifically, in T1D, the change of MG after the baseline among low-frequency CGM users had a significant increase of 2.70 mg/dL per year (0.61-4.78; P = .011), while there was less and insignificant rise in MG levels over time among high-frequency CGM users, with a slope of 0.44 mg/dL per year (−0.81 to −1.69; P = .5). The difference of the two slopes was significant (P = .049). Among T2D patients, the rise (slope) of 6.92 mg/dL per year (4.97-8.86; P < .001) was much higher in the low-frequency users compared with high-frequency users, 1.25 mg/dL per year (0.00-2.50; P = .050) with a significant slope difference (P = .029). We also compared the linear trend in the change of daily HbA1c from the most recent HbA1c measured prior to the baseline between high-frequency and low-frequency users. We found that both T1D and T2D patients demonstrated better glucose control among high-frequency users. Specifically, the slope was 0.073% per year (0.000-0.146; P = .049) and 0.070% per year (0.007-0.132; P = .029) lower for high-frequency users compared to low-frequency users among T1D and T2D patients, respectively.
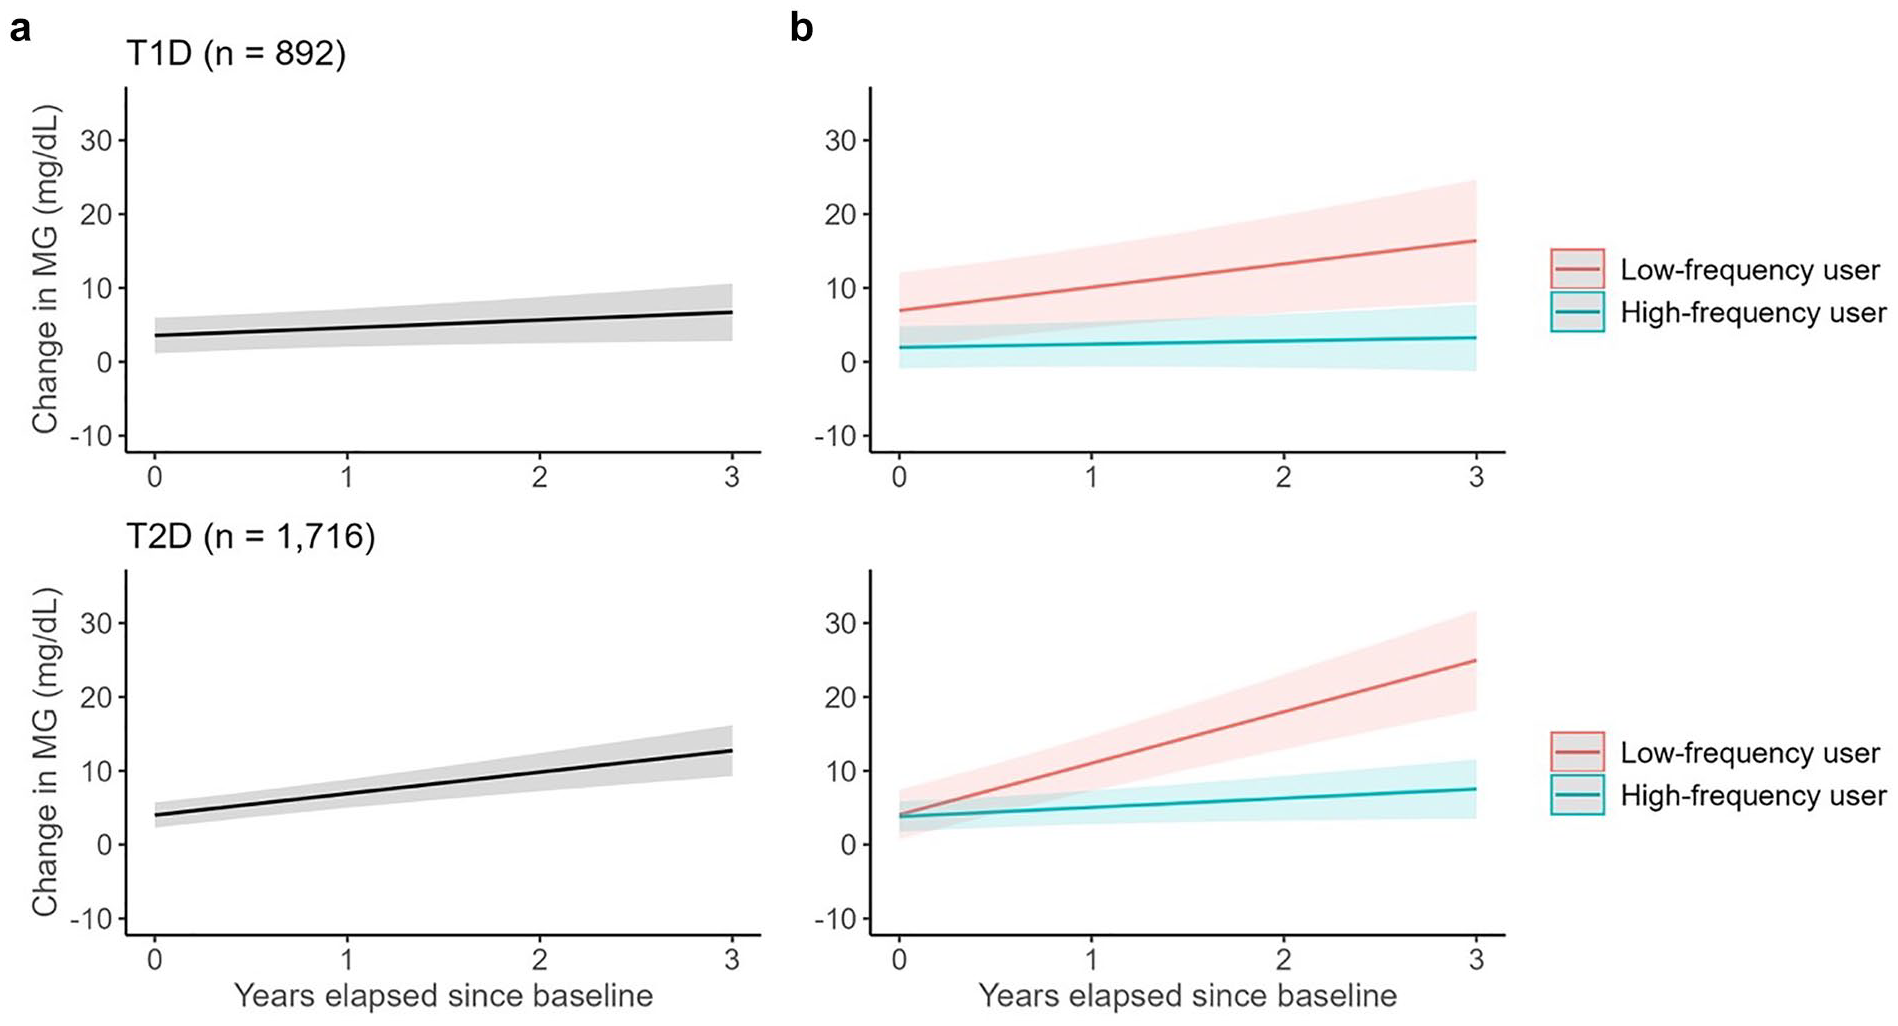
Three-year MG trajectories after starting CGM in each diabetes type and by frequency of CGM use. The change in MG was calculated as the difference in MG from the baseline (the first MG measure) and separate models were fit for T1D and T2D CGM users. Panel a shows the trajectories within each diabetes type, and Panel b shows trajectories by frequency of use within each diabetes type at the population level. Frequency of CGM use was modeled as a binary variable (low vs. high). The linear mixed-effects models included both a random intercept and a random slope for time. For the models used in Panel b, an interaction term between time and frequency of CGM use was included to estimate slope differences between low- and high-frequent users. Low- and high-frequency users were defined as ≤ 70% and > 70% of the time of CGM use, respectively. Although change in MG is anchored at zero at each individual’s baseline, the model-based means at time = 0 do not strictly start at zero due to the effects of fixed and random intercepts in the linear mixed-effects model. However, these intercept differences do not affect the interpretation of the slope, which reflects the overall trend in MG over time. The shaded areas represent the 95% confidence bands for the regression lines.
Seasonal, Monthly, and Day-of-the-Week Trends in Glucose Levels by Diabetes Type
Figure 2a shows the patterns of mean daily MG over three years by diabetes type. We observed that during the warmer seasons, MG levels tend to be lower compared to the colder seasons. These patterns influenced TIR as T1D patients typically had MG levels below 180 mg/dL (the upper bound for TIR) except for late fall and winter. T2D patients showed similar but more muted fluctuations during the year. The macro- and micro-patterns of daily MG were more apparent when overlaying each of the nearly three years of daily glucose values over a 12-month period, starting with the first week in January (Figure 2b). There was an overall trend for T1D and T2D patients to have higher MG levels at the beginning of the year, a gradual decline during spring and summer, followed by a gradual rise through the end of the year. We also observed that the mean MG levels tended to peak on weekends (Saturdays and Sundays) every week throughout the year (Figure 2b and 2c).
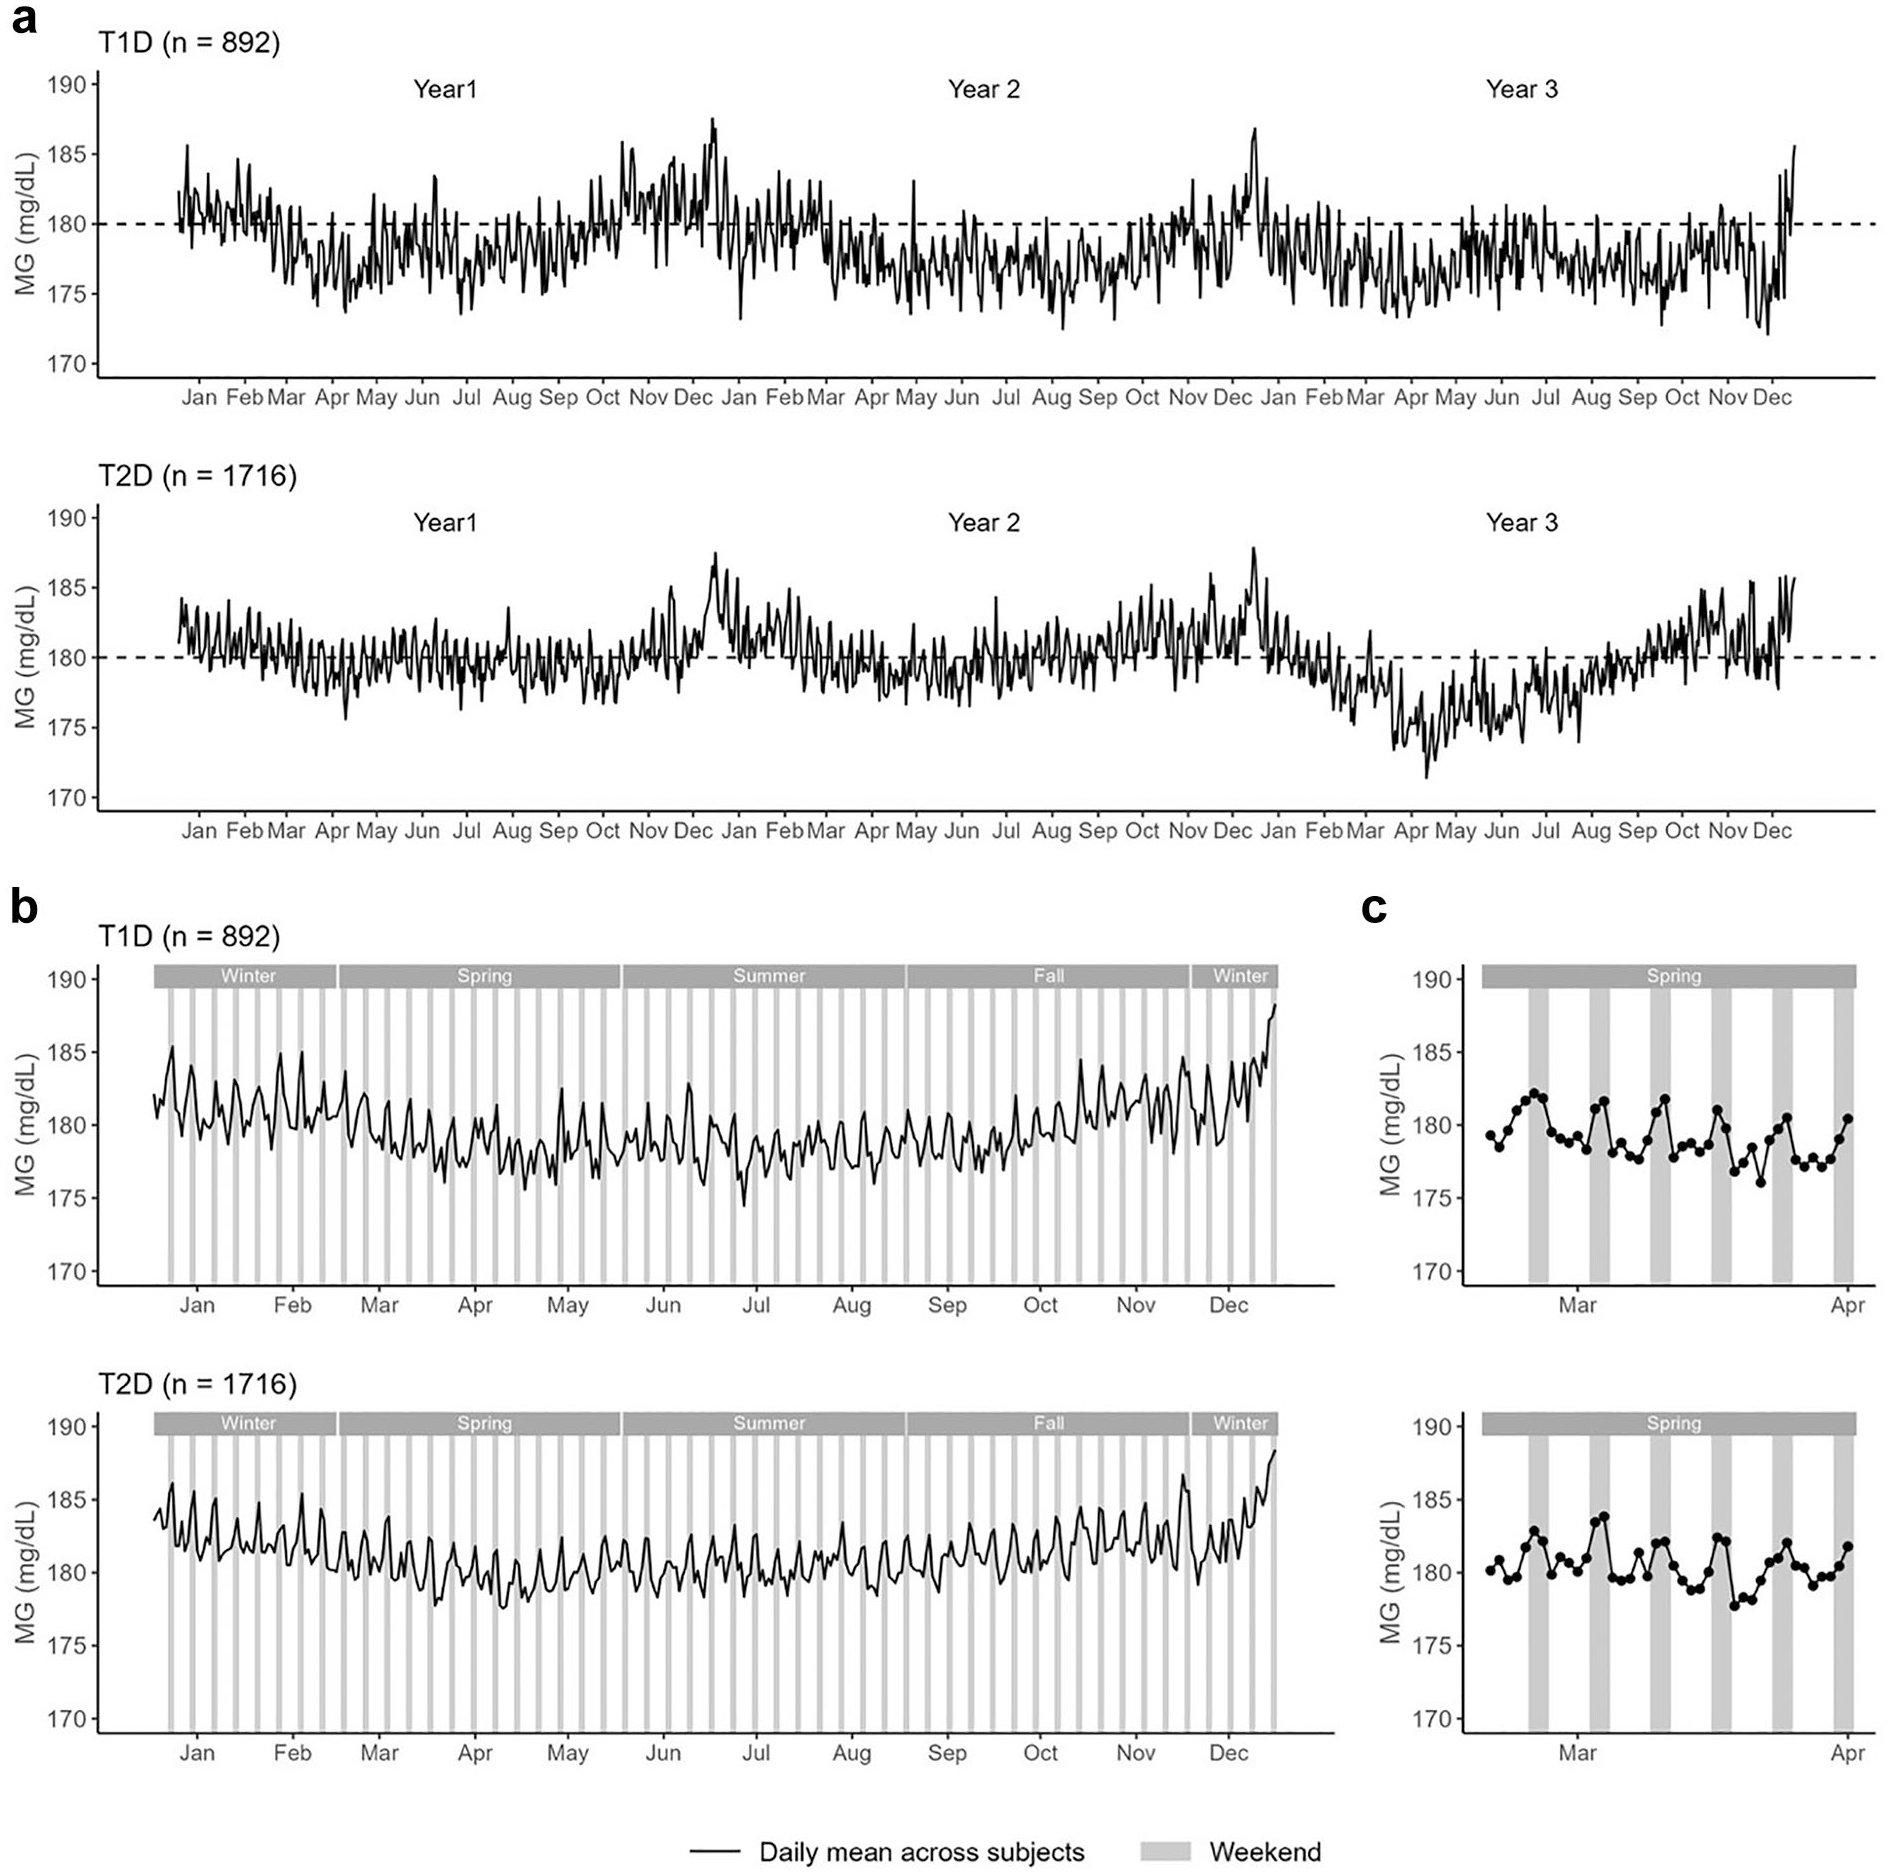
Daily pattern of MG by diabetes type.
Monthly MG levels, compared with the overall monthly average, were high in January and slowly decreased through April, remained below average through September and then began to rise above the average from October to December (Figure 3). The change in mean MG was highest in December, with increases of approximately 2.79 mg/dL (95% CI: 2.35-3.23; P < .001) for T1D patients and 2.34 mg/dL (2.01-2.68; P < .001) for T2D compared with the monthly average. Conversely, decreases of approximately −1.85 mg/dL (−2.29 to −1.41; P < .001) for T1D patients and −1.49 mg/dL (−1.82 to −1.15; P < .001) for T2D patients were observed in April. This resulted in an average MG difference of 4.64 mg/dL (3.99-5.30; P < .001) and 3.83 mg/dL (3.33-4.33; P < .001) in T1D and T2D groups, respectively. At the individual level (when random effects were considered), the mean (SD) of each patient’s MG difference (December minus April) was 4.62 (7.55) mg/dL in T1D patients and 4.14 (7.86) mg/dL in T2D patients. TIR showed a similar but inverse pattern over the year. Seasonal swings in MG were more pronounced in those with higher pre-CGM HbA1c and more muted in those with lower pre-CGM HbA1c ( Supplementary Figure S2A, S2B ), with TIR changes mirroring these patterns ( Supplementary Figure S3A, S3B ). Among two U.S. regions with distinct weather (Northeast vs Southwest), T1D patients in the Northeast showed more exaggerated winter–summer differences ( Supplementary Figure S2C, S2D ); T2D patients had similar but smaller regional variations. TIR differences by region also paralleled these trends ( Supplementary Figure S3C, S3D ). Other regions showed patterns consistent with the overall cohort.
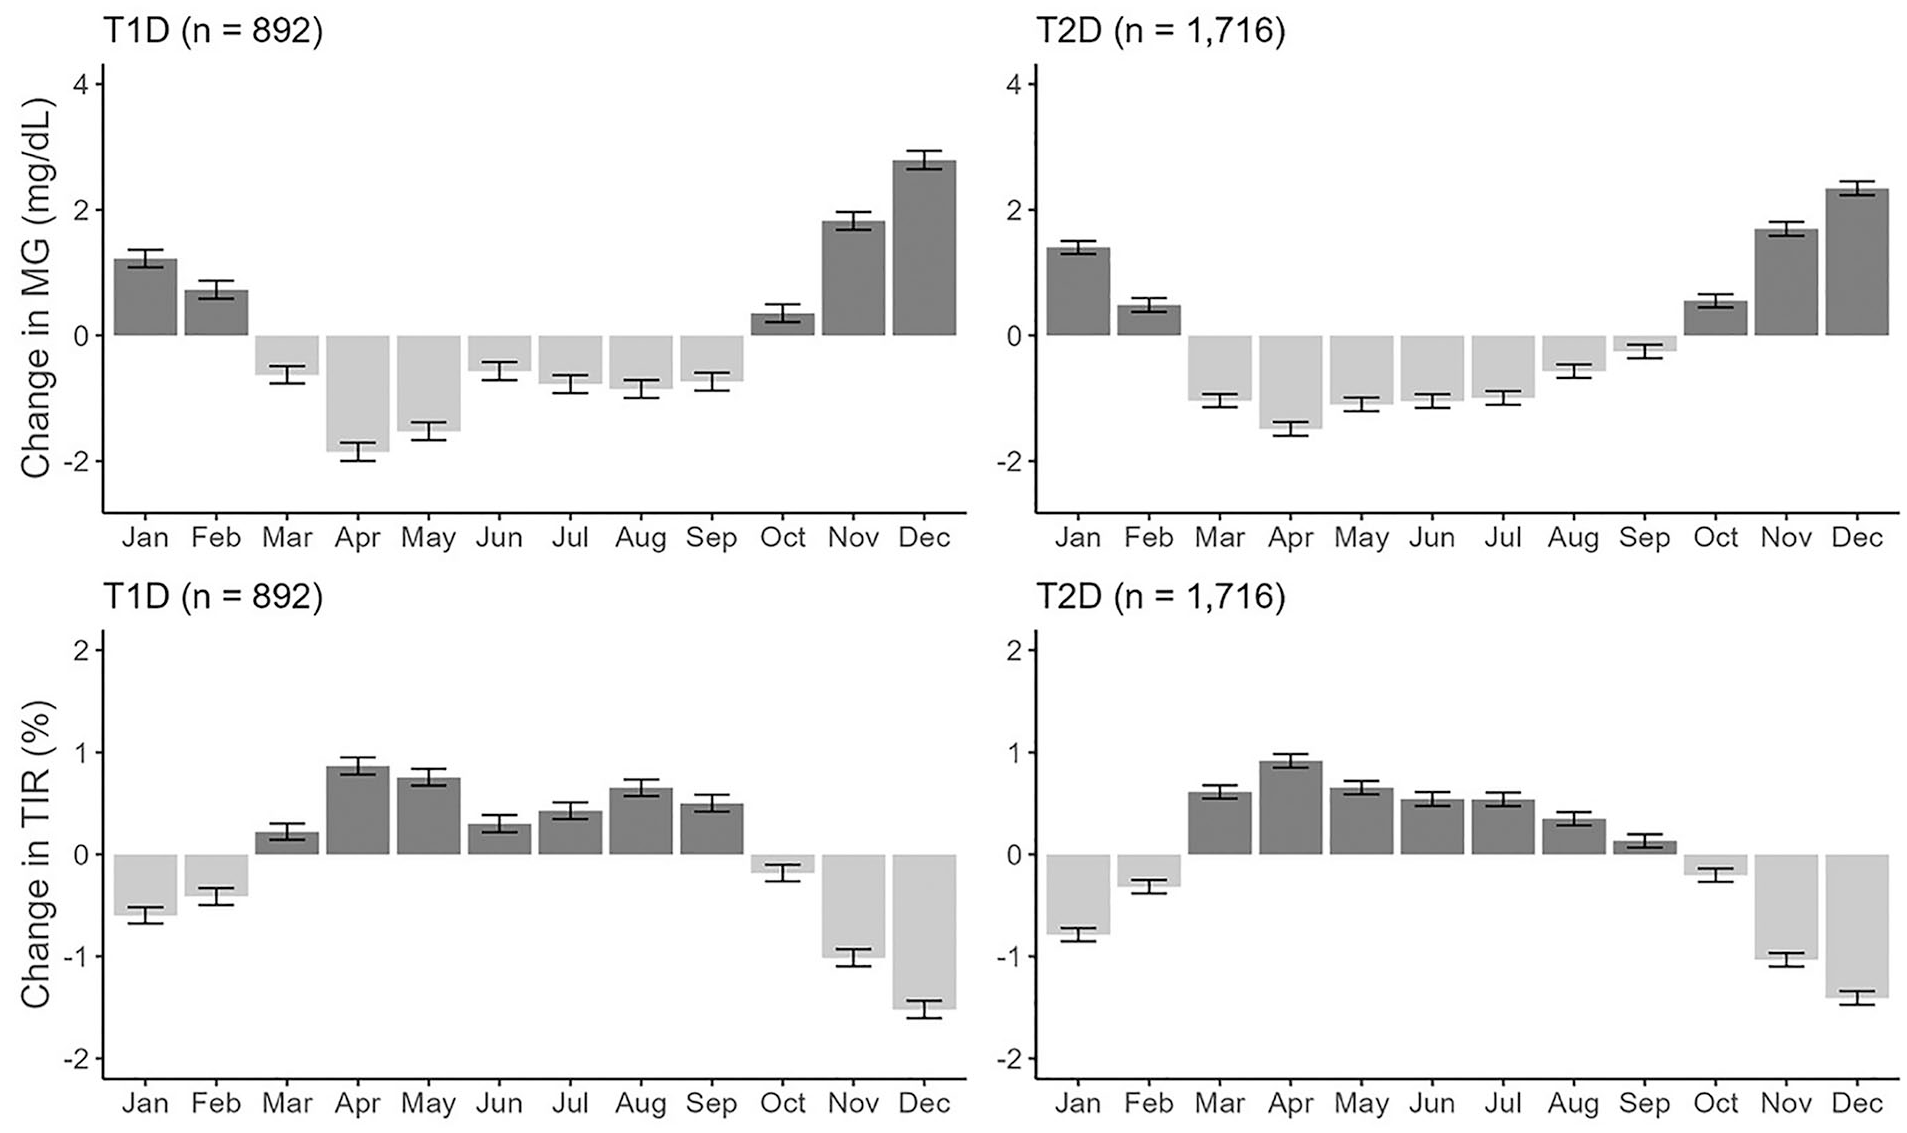
Monthly MG and TIR change from year-long average among T1D (left) and T2D (right).
We determined the average day-of-the-week patterns for MG and TIR over the three years, controlling for the above noted monthly effects. These data confirmed the trend for both T1D and T2D patients to have higher MG during weekends (Figure 4), particularly on Sunday. The average MG differences between Sunday and Wednesday were 3.01 mg/dL (2.53-3.49; P < .001) in T1D patients and 2.82 mg/dL (2.46-3.19; P < .001) in T2D patients. At the individual level (when random effects were considered), the mean (SD) of each patient’s MG difference (Sunday minus Wednesday) was 3.03 (0.55) mg/dL and 2.84 (0.63) mg/dL in T1D and T2D groups, respectively. TIR displayed an inverse relationship, with higher TIR percentages present during weekdays (approximately 0.6% higher on Wednesdays for both T1D and T2D patients) and lower TIR percentages during weekends (around −1.1% and −1.0% on Sundays, for T1D and T2D patients, respectively).

Average day of the week change in MG and TIR from the weekly average among T1D (left) and T2D (right).
Stratification by pre-CGM HbA1c levels revealed that both T1D and T2D patients with higher HbA1c levels exhibited more pronounced MG peaks during weekends and slightly greater drops during the week (Supplementary Figure S5 ). The TIR patterns mirrored these MG observations to a lesser extent ( Supplementary Figure S6 ). No weekly differences were observed when comparing the Northeast and Southwest regions in the United States (not shown).
Data dashboard for immediate review of our findings is at: https://bowenz.shinyapps.io/cgm_long-term_glycemic_patterns/.
Discussion
Combining a large national dataset of EHR with CGM device glucose data from the same individuals offers a unique window into the real-world, long-term glycemic patterns of individuals with T1D and T2D. Several key points of the analysis deserve additional discussion. T1D and T2D CGM users had slight rises in average daily glucose values over nearly three years of follow-up. This is consistent with the general trend for diabetes control to gradually worsen over time unless intensive efforts are made.10,11 However, consistency of CGM use was an important determinant of long-term glycemic control. There was evidence of a “dose effect” with increasing use of CGM associated with lower average daily glucose. Of note, those using CGM less than 70% of the time showed a steady and clinically relevant rise in glucose measures over time, suggesting that continued regular use of CGM is important for maintaining long-term glucose control. While individuals with more CGM use differed modestly in some baseline characteristics, such as age and eGFR, the two groups were broadly comparable overall. Moreover, including an estimate of statin medication use, as a way of assessing if effects of CGM use were being confounded by other better patient behaviors, did not alter results notably. These data support the interpretation that CGM use itself plays a key role in long-term glucose control.
Clear seasonal trends were observed, with deteriorating glycemic control during the winter months and improvements during the spring and summer periods. This aligns with prior research that indicated seasonal variations in metabolic control among 137 individuals (mostly T1D patients) with 91,000 days of CGM data. 12 In contrast, our study expands on this by utilizing data from approximately 900 individuals with T1D and 1700 with T2D, encompassing a total of approximately 1.7 million days of CGM data. This extensive dataset provides a more comprehensive understanding of long-term glycemic patterns and further reinforces the importance of consistent CGM use in managing glucose levels. Seasonal and weekday/weekend effects in both T1D and T2D, which have different pathophysiology and treatment regimens, suggest the influence of environmental and/or lifestyle factors,13-16 emphasizing the need for behavioral or treatment adaptations to manage weekend glucose spikes.
There are several unique strengths of this study. The data reflect large and nationally representative cohorts of both T1D and T2D patients who were not self-selected or study volunteers in clinical trials of CGM but instead received their CGMs as part of their routine care. Importantly, the results reflect long-term follow-up, extending the observation time beyond most studies to date and providing much more certainty about the consistent and recurrent patterns observed over many years. Thus, the glucose patterns revealed in these studies provide a realistic perspective of long-term glucose control after the provision of CGM devices. Despite these promising findings, our study has limitations. The observational nature of the research, the lack of non-CGM controls for comparisons of long-term glycemic control, and the reliance on data from a specific CGM system may reduce the certainty that potential glucose-lowering effects can be ascribed directly to CGM use. Our study population is comprised primarily of older male veterans using insulin as part of their diabetes care, which may limit the generalizability of the findings to the broader U.S. diabetes population, 17 particularly women, younger individuals, and patients with T2D not receiving insulin. As differences in diabetes medication use and compliance (as assessed by the statin use) appeared modest and adoption of advanced diabetes technologies (such as automated insulin delivery systems) was quite low in these years, comprehensive assessment of their influence on glycemic trajectories was not performed in this study.
In this real-world study of T1D and T2D patients using CGM, we found modest but clinically meaningful changes in glycemic control alongside recurring weekly and seasonal glucose fluctuations. The relatively small average fluctuations in glucose largely reflect the aggregation of diverse individual patterns over time. Although the average fluctuations appeared small overall, this effect likely masked wide variation at the individual level. Indeed, null models with fixed and random intercepts showed intraclass correlation values of 0.557 for T1D and 0.529 for T2D, indicating that over half of the total variance was due to between-patient differences. Recognizing and adjusting for these patterns can improve clinical trials and real-world analyses and guide more personalized diabetes management. By highlighting the wide variability among individuals, this work underscores the value of CGM for refining self-management, behavior change, and risk factor modification.18-20
Supplemental Material
sj-docx-1-dst-10.1177_19322968251341264 – Supplemental material for Temporal Glycemic Patterns in Type 1 and Type 2 Diabetes: Insights From Extended Continuous Glucose Monitoring
Supplemental material, sj-docx-1-dst-10.1177_19322968251341264 for Temporal Glycemic Patterns in Type 1 and Type 2 Diabetes: Insights From Extended Continuous Glucose Monitoring by Tomoki Okuno, Lucas Sort, Bowen Zhang, Kerry Zhou, Matthew Kitchen, Victor Li, Donald R. Miller, Gregory J. Norman, Peter Reaven and Jin J. Zhou in Journal of Diabetes Science and Technology
Footnotes
Acknowledgements
The authors thank Dexcom, Inc for providing CGM device data. This material is the result of work supported by resources and the use of facilities at the Carl T. Hayden VA Medical Center. The views expressed in this article are those of the authors and do not necessarily reflect the position or policy of the Department of Veterans Affairs or the United States government.
Abbreviations
CGM, continuous glucose monitoring; CV, coefficient of variation; EHR, electronic health care record; HbA1c, hemoglobin A1c; IQR, interquartile range; LMM, linear mixed-effects model; MG, mean glucose; SD, standard deviation; T1D, type 1 diabetes; T2D, type 2 diabetes; TBR, time below range; TIR, time in range; VA, Veterans Affairs Health Care System.
Author Contributions
TO analyzed data and wrote the first draft of the manuscript. LS analyzed data at the beginning. BZ, MK, and VL developed the glucose trajectory data dashboard. DM contributed to discussions. HZ provided advice and edited the manuscript. GJN arranged for access to Dexcom device data, provided information on the nature of these data and contributed to discussions. PR conceived the idea for the project, obtained project funding and contributed to discussions and manuscript preparation. JJZ assisted in project development, supervised the project and analyses, and assisted with manuscript preparation. All authors reviewed, edited, and approved the manuscript. JJZ is the guarantor of this work, had full access to all the data, and takes full responsibility for the integrity of data and the accuracy of data analysis.
Declaration of Conflicting Interests
The author(s) declared the following potential conflicts of interest with respect to the research, authorship, and/or publication of this article: No potential conflicts of interest relevant to this article were reported. GJN is an employee of Dexcom, Inc.
Funding
The author(s) disclosed receipt of the following financial support for the research, authorship, and/or publication of this article: This material is the result of work supported in part, and with resources and the use of facilities, at the Phoenix VA Healthcare System and support from Dexcom, Inc. JJZ was supported by NIH (grant no. R01HG006139), National Science Foundation (grant nos. DMS-2054253 and IIS-2205441).
Supplemental Material
Supplemental material for this article is available online.
References
Supplementary Material
Please find the following supplemental material available below.
For Open Access articles published under a Creative Commons License, all supplemental material carries the same license as the article it is associated with.
For non-Open Access articles published, all supplemental material carries a non-exclusive license, and permission requests for re-use of supplemental material or any part of supplemental material shall be sent directly to the copyright owner as specified in the copyright notice associated with the article.