
Abstract
Background:
While glucometric benchmarking has been used to compare glucose management between institutions, the value of longitudinal intra-institution benchmarking to assess quality improvement changes is not established.
Methods:
A prospective six-month observational study (October 2019–March 2020 inclusive) of inpatients with diabetes or newly detected hyperglycemia admitted to eight medical and surgical wards at the Royal Melbourne Hospital. Networked blood glucose (BG) meters were used to collect capillary BG levels. Outcomes were measures of glycemic control assessed by mean and threshold glucometric measures and comparison with published glucometric benchmarks. Intra-institution comparison was over the 2016-2020 period.
Results:
In all, 620 admissions (588 unique individuals) met the inclusion criteria, contributing 15 164 BG results over 4023 admission-days. Compared with the 2016 cohort from the same institution, there was increased BG testing (3.8 [SD = 2.2) vs 3.3 [SD = 1.7] BG measurements per patient-day, P < .001), lower mean patient-day mean glucose (PDMG; 8.9 mmol/L [SD = 3.2] vs 9.5 mmol/L [SD = 3.3], P < .001), and reduced mean and threshold measures of hyperglycemia (P < .001 for all). Comparison with institutions across the United States revealed lower incidence of mean PDMG >13.9 or >16.7 mmol/L, and reduced hypoglycemia (<3.9, <2.8, and <2.2 mmol/L), when compared with published benchmarks from an earlier period (2009-2014).
Conclusions:
Comprehensive digital-based glucometric benchmarking confirmed institutional quality improvement changes were followed by reduced hyperglycemia and hypoglycemia in a five-year comparison. Longitudinal glucometric benchmarking enables evaluation and validation of changes to institutional diabetes care management practices.
Introduction
Globally, diabetes was estimated to affect 537 million adults and be responsible for 6.7 million deaths in 2021. 1 In Australia, diabetes affects approximately 5% of the adult population and was a primary or associated diagnosis for 1.2 million hospital admissions during 2016-2017 (11% of all Australian hospitalizations). 2 There is now overwhelming evidence that both hyperglycemia and hypoglycemia in hospital inpatients increase mortality.3,4 But while interventions that reduce hyperglycemia may reduce in-hospital adverse clinical events,5,6 excessive glucose reduction that results in hypoglycemia can increase mortality. 7 It is thus incumbent on healthcare institutions to implement diabetes care quality improvement changes that reduce inpatient hyperglycemia without increasing hypoglycemia.
The first step in improving inpatient glycemia is the establishing of baselines for hospital diabetes care processes8,9 as well as glucometric processes.10,11 While the former have been assessed through bedside-based audits such as the United Kingdom’s annual National Inpatient Diabetes Audit (NaDIA) since 2010 and more recently in Australia in 2019, 9 digital or electronic-based glucometric benchmarking is now similarly being established as a viable and efficient method for comparing glucose values between institutions and over time.11 -13
We have previously undertaken glucometric benchmarking at our institution. 10 In the years since, we have instituted a number of quality improvement changes in our inpatient glycemic management program including expansion of networked glucose monitoring technology to all inpatient wards of the hospital (enabling electronic-based glucometry) 14 ; implementation of peri-operative, 15 hyperglycemia and hypoglycemia management plans 16 ; and commencement of an inpatient diabetes nurse practitioner role (Figure 1). 5 However, as an improvement in hyperglycemia can come at the cost of increased hypoglycemia, 17 it is crucial to ensure that any systemic changes to inpatient glycemia management are producing the intended effect without significant adverse consequences.
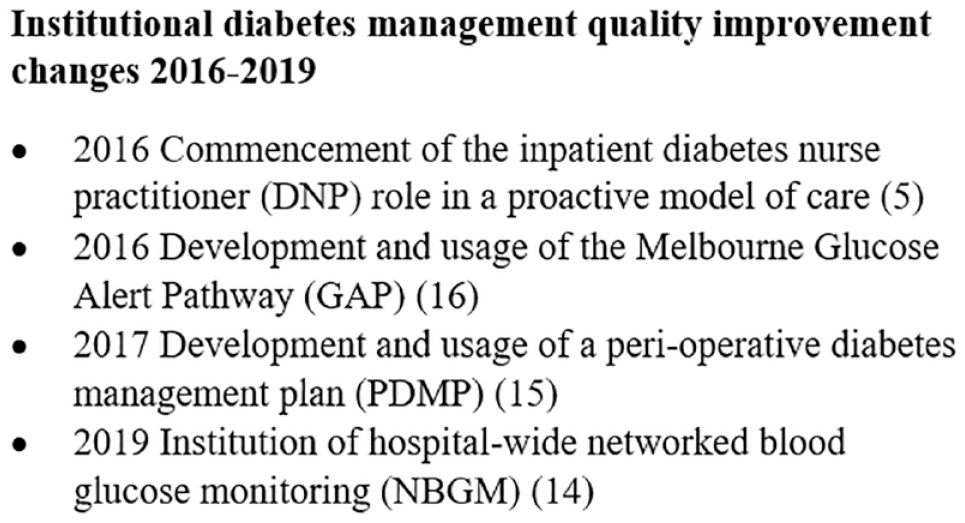
Potential contributors to improvement in institutional diabetes management seen over the 2016-2020 period.
Methods
We conducted an observational study at the Royal Melbourne Hospital, a quaternary referral hospital affiliated with the University of Melbourne, on a selection of noncritical care wards for which historic data were available. 10 Following the successful implementation of networked blood glucose meters (NBGMs; StatStrip, Australasian Medical and Scientific [AMSL] Pty. Ltd, Chatswood, New South Wales, Australia) linked to a clinician-viewable software interface (NovaNet, Nova Biomedical Pty. Ltd, Waltham, Massachusetts, USA) on eight wards from 2016, in 2019, we expanded this program to all inpatient wards of the hospital. This expansion, supported by a simultaneous education program of frontline healthcare professionals, was completed in August 2019. Blood glucose (BG) results from the meters were labeled with the patient’s unit record number, which is a unique identifier, and the date and time of the result.
At the time of the study, diabetes and hyperglycemia were primarily managed by the admitting team, with the availability of a specialist inpatient diabetes service able to consult on patients following referral. A diabetes nurse practitioner was also working in the inpatient context, assisting nursing staff with performing point-of-care glucose tests and addressing adverse glycemia appropriately. In addition to general inpatient diabetes management guidelines, clinicians at the time had access to a peri-operative diabetes management plan and the Melbourne Glucose Alert Pathway (GAP). The Melbourne GAP is a structured clinical escalation pathway to guide responses to adverse glycemia. 16 Following incident hyperglycemia or hypoglycemia, the pathway indicates actions that should be taken by healthcare professionals performing nursing and medical officer roles, and their urgency. This attempts to address the well-documented therapeutic inertia regarding responses to abnormal glucose in the inpatient setting. 18 The institution used a limited scanned medical record at the time and was preparing to transition to a comprehensive electronic medical record (EMR).
Participants
We identified all inpatients with either an established diagnosis of diabetes or at least one BG measure ≥11.1 mmol/L who were discharged from the eight study wards, comprising a cardiology, neurology, neurosurgery, orthopedic, two general medical, and two general surgical wards during the six-month study period (October 2019–March 2020 inclusive). Of note, this study period ended prior to significant community transmission and hospitalizations for COVID-19 in Melbourne, Australia. Patients with a length of stay (LOS) <24 hours were excluded. Half of all eligible inpatients were sampled each calendar week. Pre-existing diabetes was defined as a clinical diagnosis of diabetes or pre-hospital prescription of glucose-lowering medications recorded at admission.
Outcomes
Each point-of-care BG measurement for each patient for the duration of their hospital stay was collected. Blood glucose measurements after day 14 of admission were subsequently excluded to avoid undue influence by prolonged hospital stays on summary statistics. In addition, the method described by Weinberg et al 19 for excluding repeated measurements from episodes of hypoglycemia or hyperglycemia was applied.
Established hospital glucometric indices were assessed, which included population means (all BG measurements for all patients over the study period with each individual measurement equally weighted), patient-stay means (BG measurements grouped by patient admission with each admission equally weighted), and patient-day means (BG measurements grouped by patient-day with each patient-day equally weighted). 11 In addition, the adverse glycemic day (AGD), a threshold-based glucometric variable defined as a patient-day on which there was a BG of either < 4.0 or > 15.0 mmol/L, 5 was assessed.
Glucometric data were compared with historic published benchmarks from our and international institutions. Intra-institution comparisons were made using the patient-day model over the 2016-2020 period. The selection of glucometric indices for comparison with other institutions was based on those that were most consistently reported in published benchmarking studies. Inter-institutional comparison used different glucose meters; however, comparability between these methods has been previously shown. 20
Differences between groups were assessed using the Wilcoxon rank-sum test for continuous glucometrics and the χ2 test for categorical variables. All statistical analyses were performed in R version 4.0.3 (R Foundation for Statistical Computing, Vienna, Austria). Data and analysis code are available from the authors on request. The study was approved by the Melbourne Health Human Research Ethics Committee (approval 2018117).
Results
During the six-month study period, 620 admissions of 588 unique patients meeting the inclusion criteria were sampled to comprise the study cohort. In all, 498 patients (85%) had diabetes and 137 (23%) were receiving insulin treatment prior to their admission. Of these, 106 patients (17%) received glucocorticoid therapy during the admission (Table 1). Admission characteristics of the study cohort were similar to the previously reported cohort at our institution with the notable difference of 95% of the original cohort having a pre-admission diagnosis of diabetes. 10
Characteristics of Admitted Patients in the Benchmarking Cohort and Compared With 2016. 10
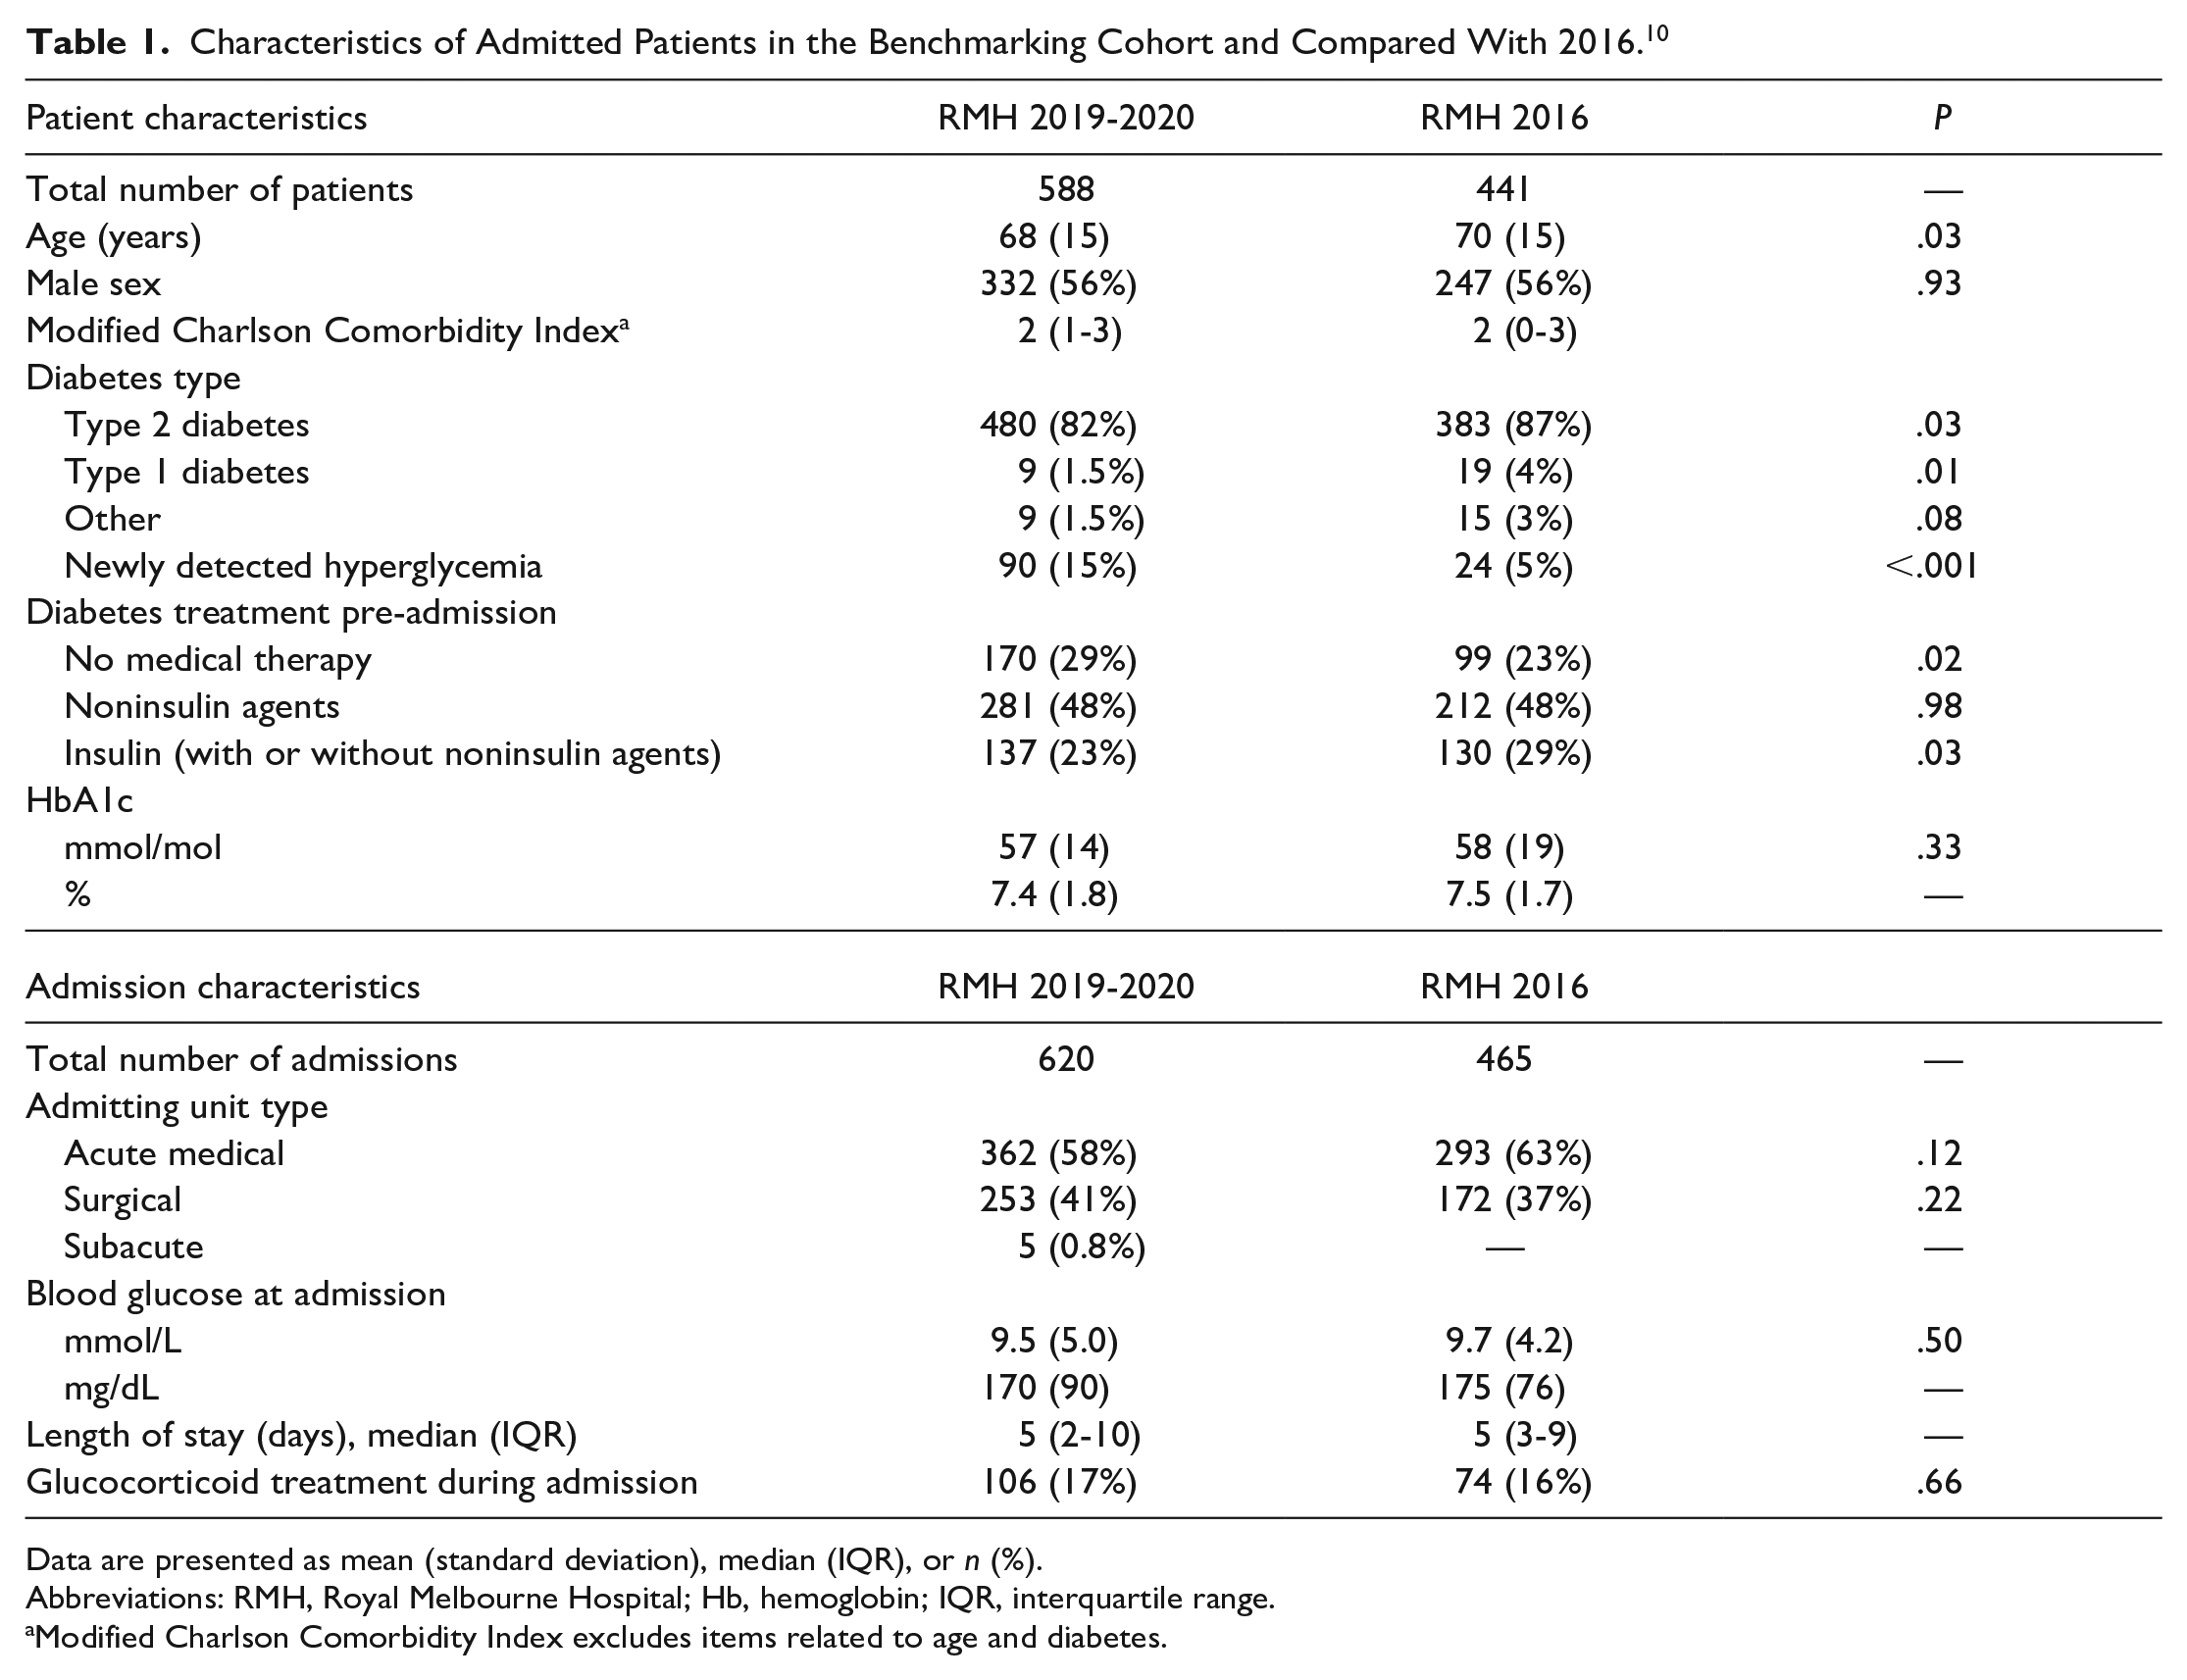
Data are presented as mean (standard deviation), median (IQR), or n (%).
Abbreviations: RMH, Royal Melbourne Hospital; Hb, hemoglobin; IQR, interquartile range.
Modified Charlson Comorbidity Index excludes items related to age and diabetes.
There were 15 164 BG results observed over 4023 admission-days with a mean of 3.8 BG measurements taken per patient per day (SD = 2.2; Table 2). Almost one in five patient-days (19%) was an AGD, the majority of these were due to hyperglycemia.
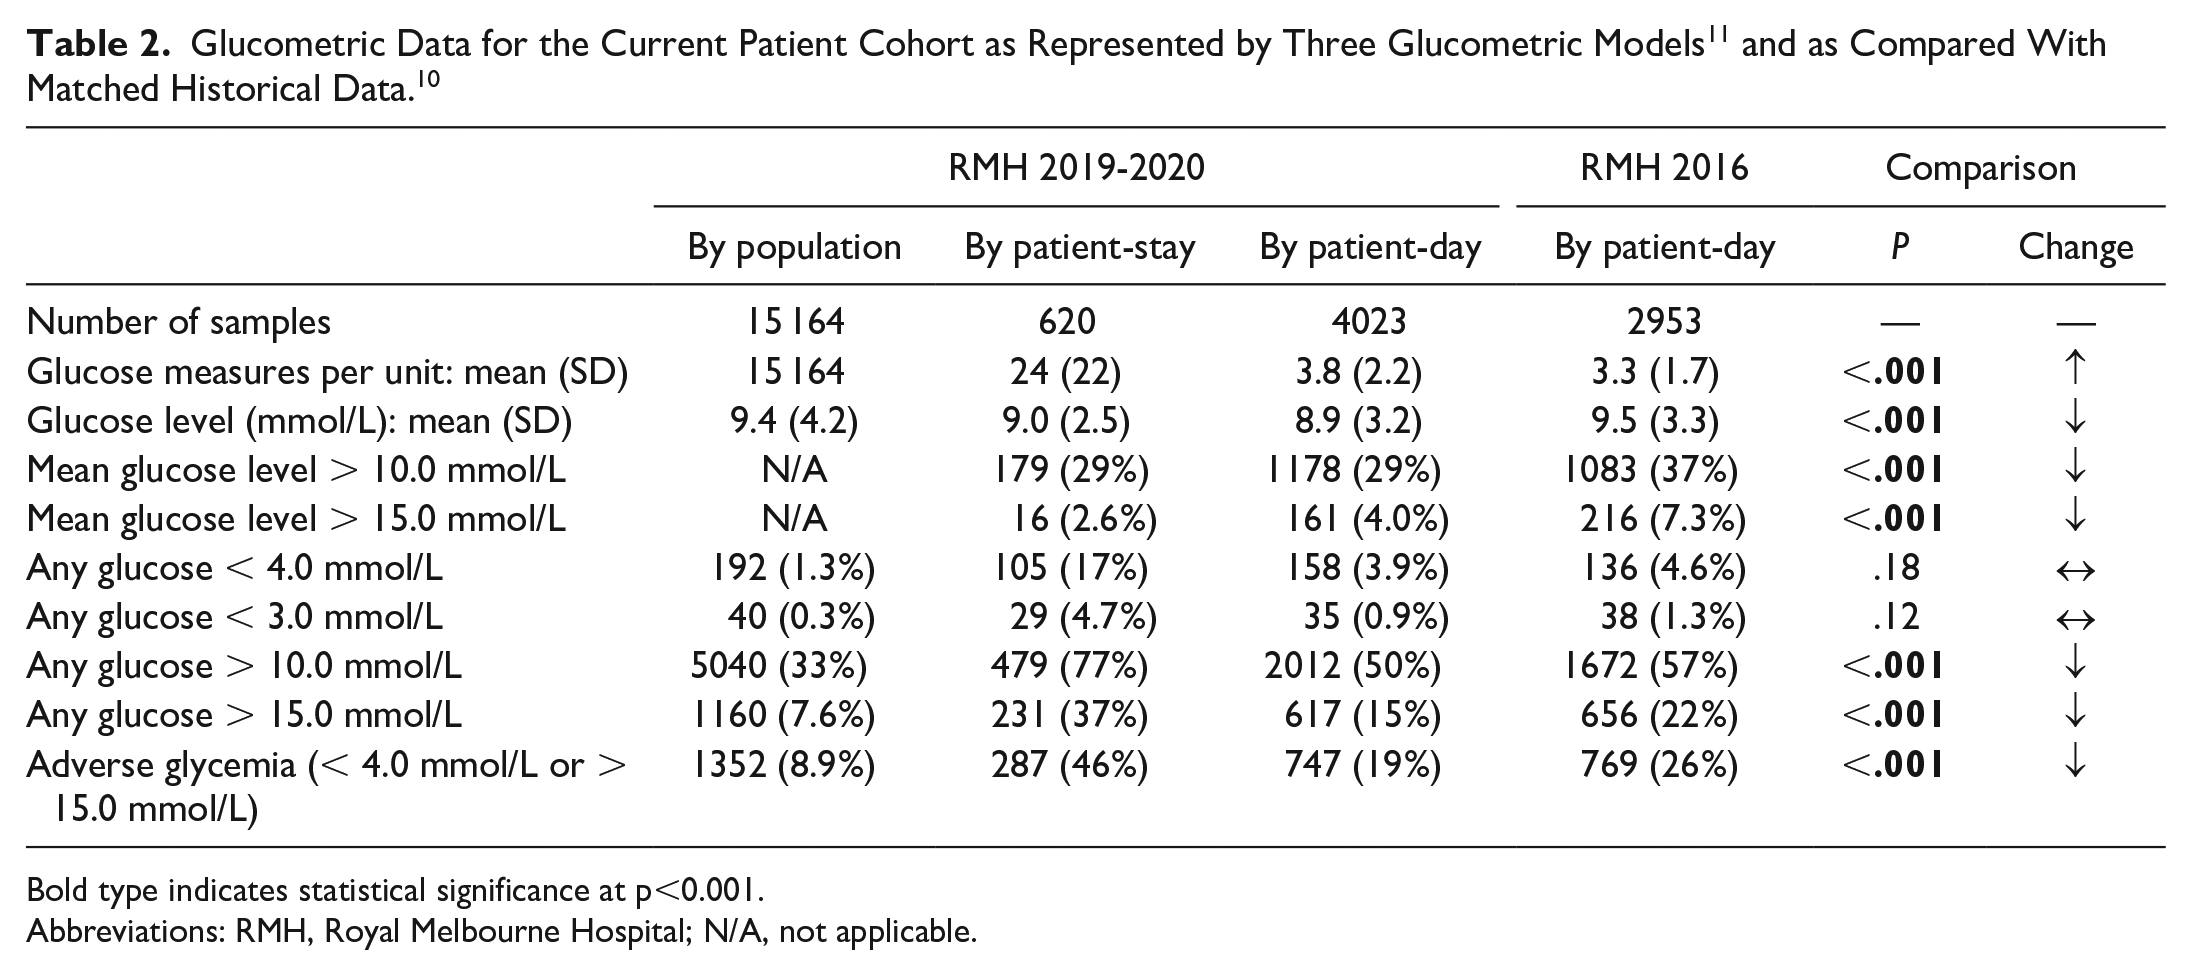
Bold type indicates statistical significance at p<0.001.
Abbreviations: RMH, Royal Melbourne Hospital; N/A, not applicable.
Local comparison of the current 2019-2020 cohort with the 2016 cohort using the patient-day model revealed an increase from 3.3 (SD 2.2) to 3.8 (SD 1.7) glucose measurements per patient-day (P < .001). Mean patient-day mean glucose (PDMG) reduced from 9.5 mmol/L (SD 3.3) to 8.9 mmol/L (SD 3.2) (P < .001). Both the proportion of patient-days with either a mean glucose or any glucose measure above 10.0 mmol/L and above 15.0 mmol/L had reduced (P < .001 for all). Adverse glycemic days were less frequent in the current cohort (19%) than three years earlier (26%) (P < .001). Patient-days with any glucose measure below 3.0 and 4.0 mmol/L were not significantly different (P > .05).
Compared with published US benchmarks,10,12,13,17,21,22 our 2019-2020 cohort exhibited a comparable mean PDMG (Table 3). For hyperglycemia defined as a mean PDMG >13.9 or >16.7 mmol/L; our cohort had lower rates compared with all published benchmarks from 2009 to 2014. Similarly, our cohort exhibited a lower incidence of hypoglycemia for all three levels (<3.9, <2.8, <2.2 mmol/L).
Glucometric Data Described Using the Patient-Day Model for the Current Patient Cohort and Published NonIntensive Care Unit (Non-ICU) Benchmarks.
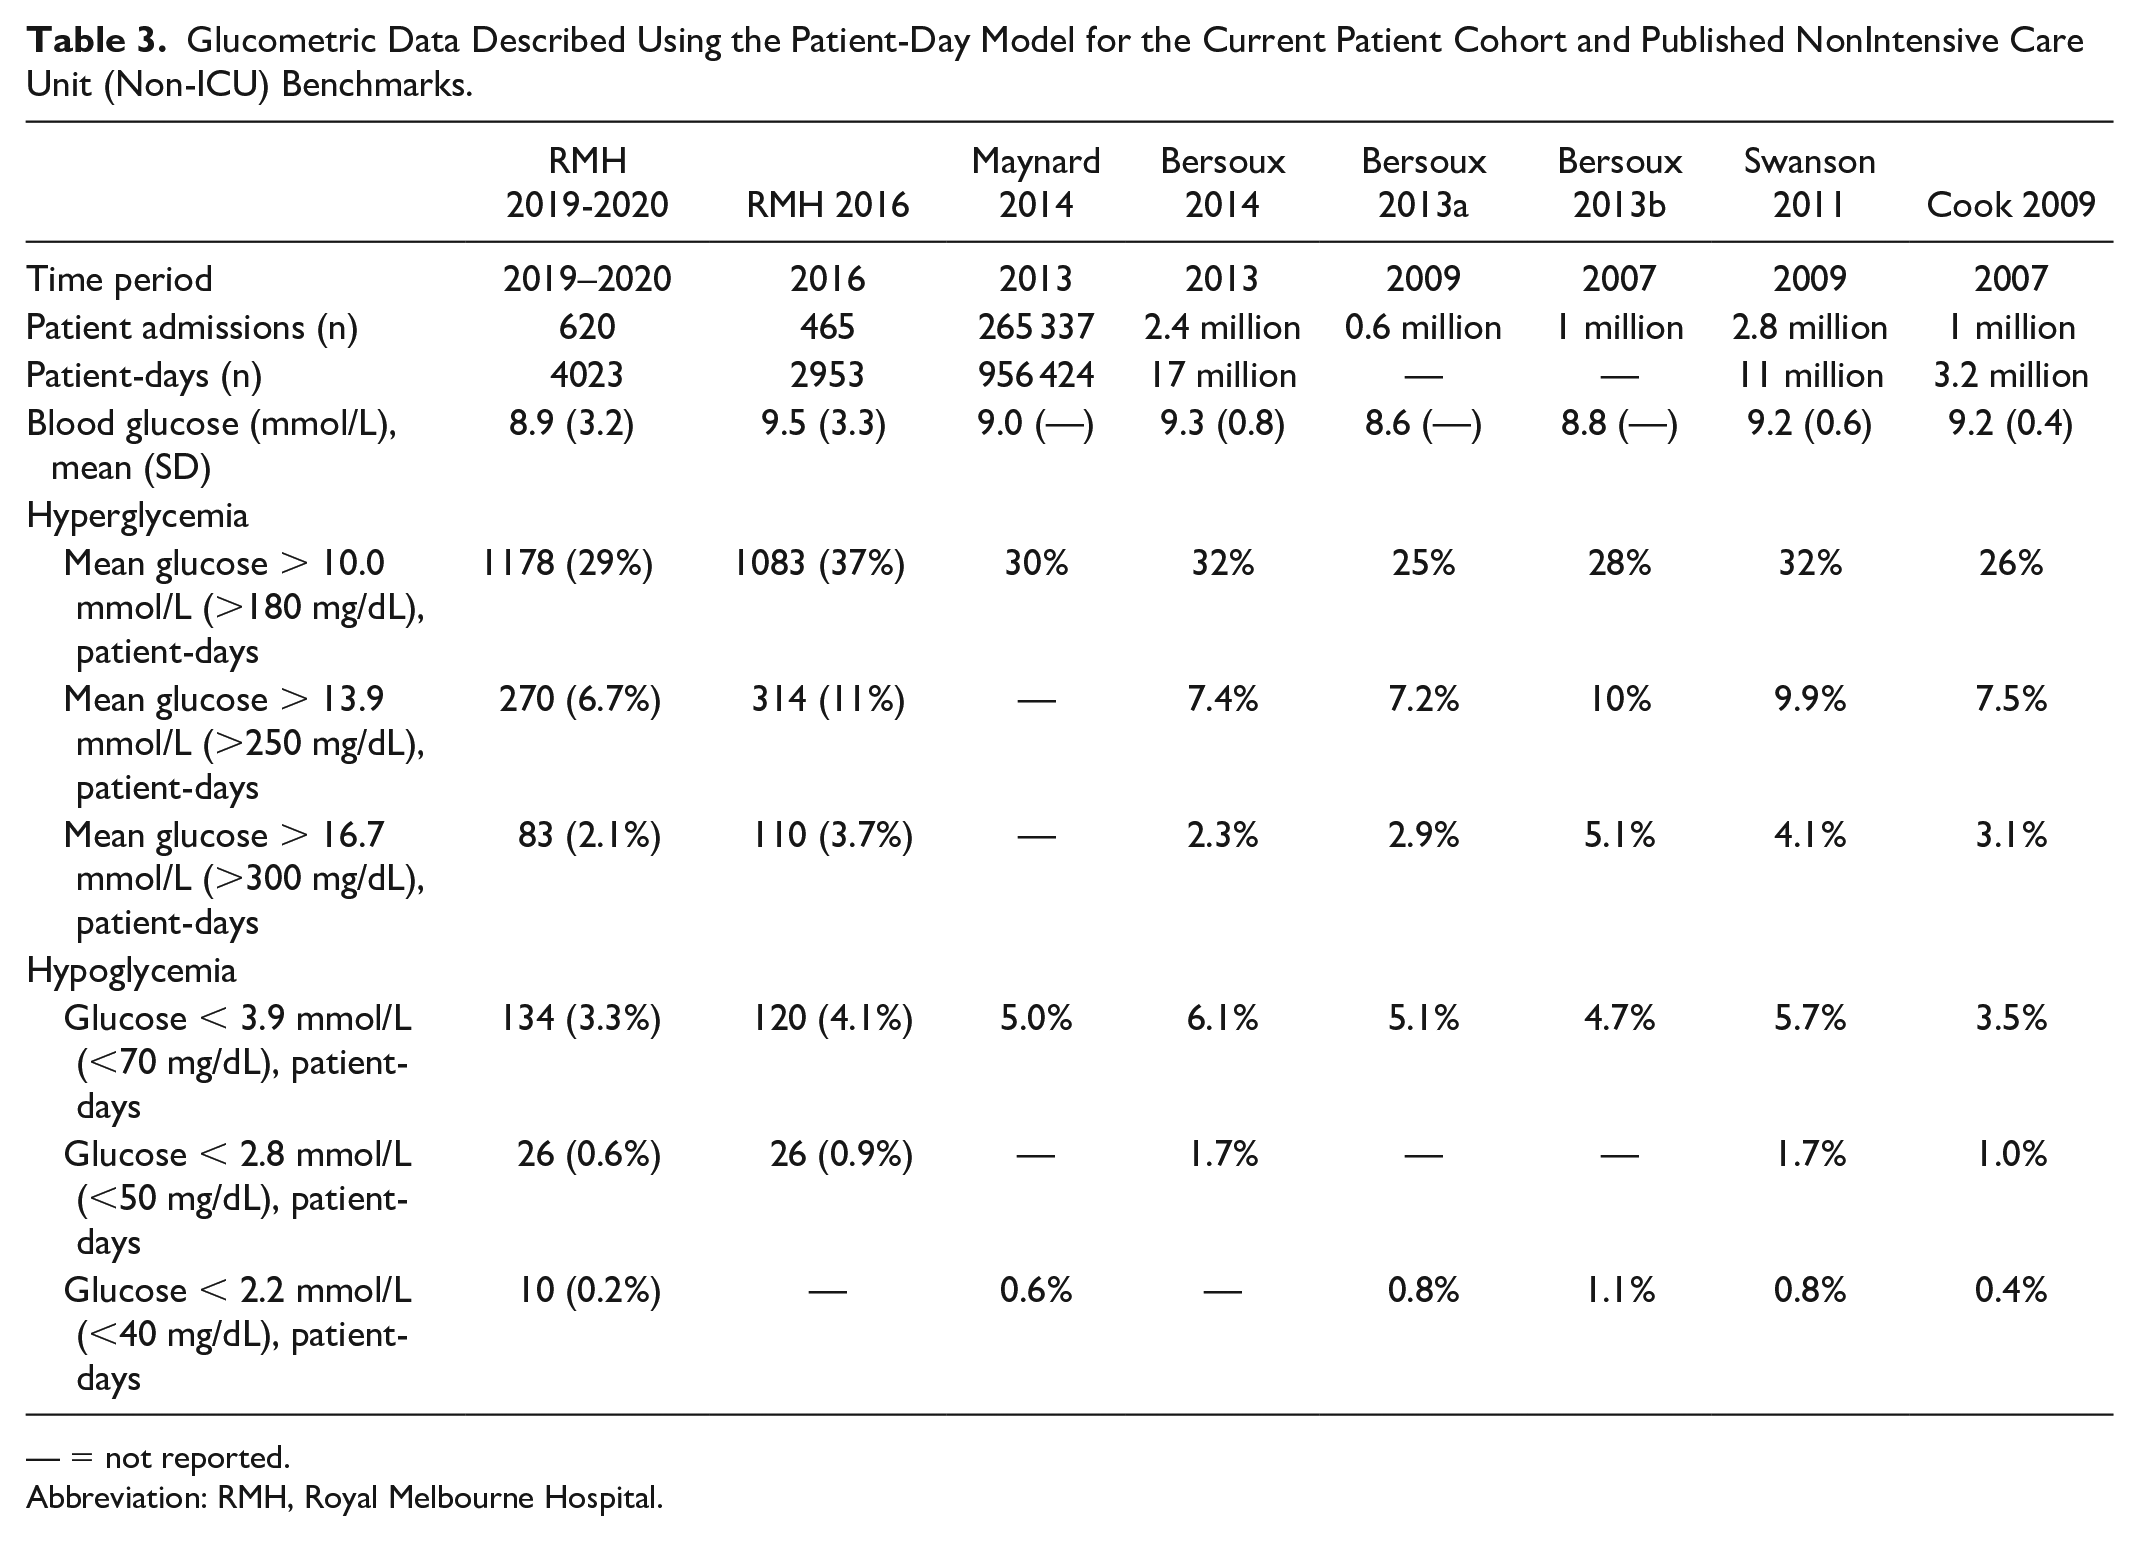
— = not reported.
Abbreviation: RMH, Royal Melbourne Hospital.
Discussion
Glucometric benchmarking is increasingly recognized as an integral element of evaluating glucose management programs. 23 Through the insights gained from benchmarking, an institution desiring to improve glucose management may identify suboptimal aspects of their program, tailor and implement improvement initiatives, then monitor progress to ensure initiatives are having the desired effects. This study represents, to the authors’ knowledge, the first attempt to associate longitudinal intra-institutional glucometric benchmarking with contemporary diabetes quality improvement changes, to assess their safety and effect.
Enabled by the implementation of a hospital-wide NBGM system making digital-based, comprehensive, longitudinal glucometric benchmarking possible, between 2016 and 2019-2020, we observed a reduction in both hyperglycemia and hypoglycemia in the eight study wards of our institution. Although modest, differences of a comparable magnitude have been shown in a clinical trial setting to be associated with an improvement in clinical outcomes. 5 This assessment used established measures of comparison as developed by more mature US benchmarking programs. However, direct comparisons with US benchmark values should be undertaken cautiously as adjusting for patient population, the era (which determines glucose-lowering agent availability and management paradigms), and other factors is required for an accurate comparison.
Over the period since first establishing our institutional glucometric benchmark, we implemented a number of quality improvement changes aimed at optimizing glucose, including an inpatient diabetes nurse practitioner role in a proactive model of care (2016), 5 the Melbourne GAP (2016), 16 a peri-operative diabetes management plan (2017), 15 and hospital-wide NBGM (2019). 14 It is likely that these changes are at least in part responsible for the observed reduction in adverse glycemia, particularly as there is evidence for the individual components independently improving inpatient diabetes management.5,24 Although, it must be noted that any causative role for these quality improvements in the glucose changes remains speculative given the observational nature of this study. In 2019-2020, we also noted an increase in patients with newly detected hyperglycemia compared with the 2016 cohort, potentially reflective of these quality improvement changes improving the assessment of glucose and thus increasing hyperglycemia detection, particularly as ward composition was otherwise largely similar.
Glucose management changes do not always have universally positive effects. In the only other published temporal comparison, between 2007 and 2009, the included US hospitals experienced decreased hyperglycemia but at the cost of increased hypoglycemia (Figure 2). 17 The precise reasons for this are unknown, but a potential contributor is hypothesized as the trend away from sliding-scale insulin toward more intensive basal-bolus insulin regimens following the 2007 publication of the influential RABBIT 2 trial, 25 a management change shown to be associated with increased hypoglycemia in larger cohorts.6,24 It is thus consistent that this linked glycemic treatment phenomenon is similarly manifest when considering groups of individuals at the scale of a hospital.
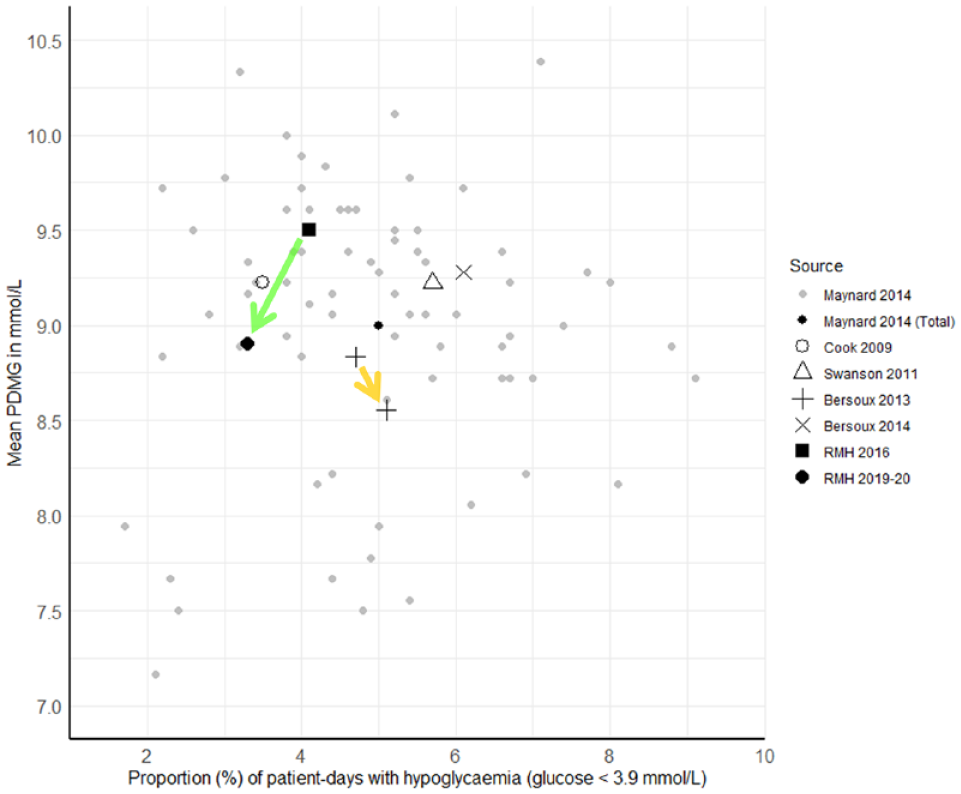
PDMG versus proportion of patient-days with hypoglycemia. Data derived from published glucometric benchmarks.10,12,13,17,21,22 Gray dots represent individual institution benchmarks redrawn from Maynard et al. 13 Transparent green arrow represents change at the RMH from 2016 10 to 2019-2020 (current patient cohort). Transparent yellow arrow represents change in a US hospital benchmark from 2007 to 2009. 17 Abbreviations: PDMG, mean patient-day mean glucose; RMH, Royal Melbourne Hospital.
An emerging opportunity for accelerating glucose optimization is through synergistic use of glucometric benchmarking alongside bedside inpatient glucose management auditing. Audits such as NaDIA and the Queensland Inpatient Diabetes Survey (QuIDS) provide insight into inter-institutional similarities and differences in glucose management practices and patient population clinical characteristics.8,9 Glucometric benchmarking thus enables quantification of the effects of these differences and, in an inter-institutional co-operative learning environment, gold-standard practices to be identified and widely adopted, as allowed by local budgetary and operational constraints. 26
By comparing longitudinal trends in mean PDMG with the proportion of patient-days with hypoglycemia, an institution may at a glance understand the net glycemic effect of a change in practice (Figure 3). A direction of change toward the bottom left of the figure indicates a global improvement in both hyperglycemia and hypoglycemia, while movement toward the top right indicates deterioration of both. Movement toward the bottom right suggests an indiscriminate increased intensity of glycemic management, such that hyperglycemia is reduced at the cost of increased hypoglycemia. Conversely, movement to the top left suggests reduced glycemic management intensity, reducing hypoglycemia but increasing hyperglycemia.
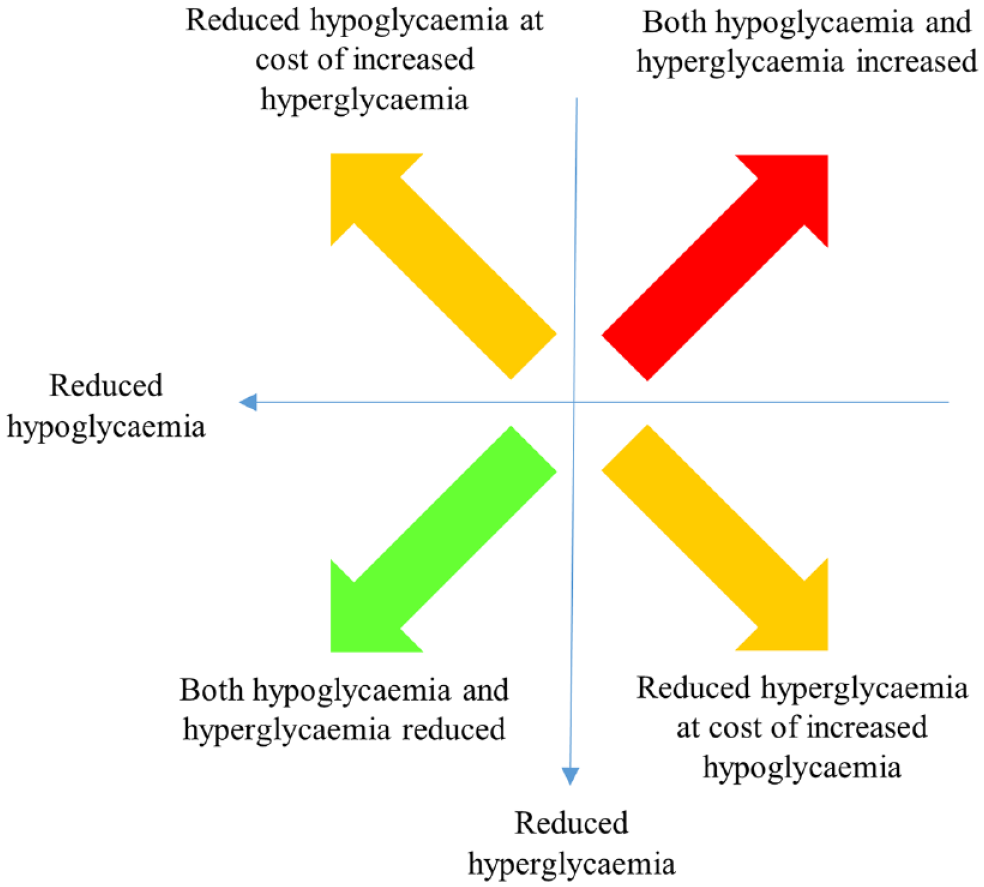
Schematic interpretation of directional change in plot position for mean patient-day mean glucose versus proportion of patient-days with hypoglycemia.
A strength of the methods employed in this study were the automatic digital capture and inclusion (up to day 14 of admission) of each time-stamped glucose result. This methodology allows glucometrics using different time units and population bases to be calculated efficiently and, through using a fully specified analytic script as available with modern statistical software, reproducibly. Such detailed glucometric audits analyzing continuous and threshold glucose data are not feasible in bedside clinical audits,8,9 consistent with the differing goals of such audits. Given the limited glucometric data assessments possible with bedside clinical audits, there is a clear need for comprehensive digital glucose benchmarking.
This study is limited by its retrospective single-center nature. As the only Australian institution using NBGM across all inpatient wards and an EMR at the time of the comparison, no other institutions were able to be included in our analysis. Comparisons with published US benchmarks are indicative only as they are limited by differences in patient populations, era, use of alternative BG measuring devices/methods, and other factors. The intra-institution comparison is unable to differentiate the potential contribution of each of the four quality improvement changes over the five-year period under consideration. Furthermore, limiting analyses to just individuals reviewed by the nurse practitioner to assess for the independent effect of this factor would be unrevealing, given the significant biasing by indication of this population, in that those individuals referred for nurse practitioner review have more adverse glycemia than average by definition. In addition, the relevance of glucose levels 3.5 to 3.9 mmol/L in individuals not receiving glucose-lowering therapy is unclear. Future comparisons would preferably distinguish between definitions of hypoglycemia based on glucose-lowering therapy.
Of note, while glucometric benchmarking is made more efficient by the use of digital technologies such as NBGM devices and related software as well as an EMR, these are by no means absolute pre-requisites. The methods employed in this comparison, comparative representations (Figure 2), and interpretation (Figure 3) remain relevant and accessible to those institutions yet to employ such technologies. Manual or semi-automated (eg, intermittent download of results from a nonnetworked glucose meter) methods of glucose data acquisition are readily summarized and assessed using the methods described, albeit less efficiently than with digital-based systems.
Based on these results, we strongly recommend that hospitals (including endocrinology units and inpatient diabetes services) and other stakeholder organizations with an interest in optimizing inpatient diabetes management to realize the promise of co-ordinated glucometric benchmarking with inpatient glucose management auditing. This will likely entail
promoting the uptake of NBGM and EMR technologies that enable automatic glucose data transfer to facilitate digital glucometric benchmarking, currently a barrier to efficient glucometric use in Australia, 27
adopting an evidence-based approach to selecting preferred glucometric measures, and
developing a consensus approach to selecting items for inclusion in clinical service audits to enable national inpatient glucometric benchmarking.
Conclusions
Digital-based glucometric benchmarking systems could enable efficient and comprehensive longitudinal monitoring of institutes’ glucose management performance. We showed, following the implementation of four significant quality improvement initiatives over three years, a universal improvement in glucometrics for both hyperglycemia and hypoglycemia, with favorable international comparison. We describe a method of glucometric comparison using established measures and further propose a simple schematic interpretation to assess the overall glycemic effect of glucose management practice changes. Such benchmarking activities allow the effects of glucose management interventions in hospital to be quantified. Furthermore, through simultaneous glucometric and clinical auditing initiatives for benchmarking, institutions may share knowledge, identify, and implement optimal diabetes care strategies.
Footnotes
Acknowledgements
The authors acknowledge the assistance from the entire Australasian Medical & Scientific Limited Point-of-Care team for installation, training, and technical support of networked blood glucose meters as well as the support from Nova Biomedical. We are also grateful to Candice Hall and Vicky Gonzalez for their assistance with auditing glucose data.
Abbreviations
AGD, adverse glycemic day; BG, blood glucose; DNP, diabetes nurse practitioner; EMR, electronic medical record; GAP, Glucose Alert Pathway; NaDIA, National Inpatient Diabetes Audit; NBGM, networked blood glucose meter; PDMG, patient-day mean glucose; PDMP, peri-operative diabetes management plan; QuIDS, Queensland Inpatient Diabetes Survey; RMH, Royal Melbourne Hospital.
Declaration of Conflicting Interests
The author(s) declared no potential conflicts of interest with respect to the research, authorship, and/or publication of this article.
Funding
The author(s) received no financial support for the research, authorship, and/or publication of this article.