
Abstract
Glucometrics (defined as the systemic analysis of blood glucose data) can be used as a benchmarking tool/ quality indicator of glycemic control in hospital or a patient care unit of the hospital.1,2 Metrics generated are utilized to compare the quality of care provided to patients along with other indicators like rates of pressure sores and catheter related blood stream infections. 2 The study of glucometrics entails use of automated glucometers 3 and automated data management systems. 4 In hospitals with limited internal information technology (IT) resources and capability, accessing and assessing the large amount of glucose data generated, remains a challenge. In our hospital with resource limited IT capability, we wanted to evaluate if chart abstraction technique, 5 can be used to effectively generate glucometrics. We also studied use of the generated metrics to evaluate in-patient glycemic control in ICU patients and its use as a benchmarking tool, to compare it with other hospitals and centers of excellence.
Indoor records of all patients admitted to ICU of our hospital from July 2011 to September 2011 were evaluated. Data regarding blood glucose level (BSL), its timing, its relation to feeding, as well as insulin dose and type given at that time, along with patient characteristics were noted. All this data was entered into a spreadsheet and then analyzed to generate metrics. A Glucometrics Report (Table 1) was prepared for the period of assessment. The glucometrics data was compared with data from other hospitals. 4
Glucometrics Report of Our Study.
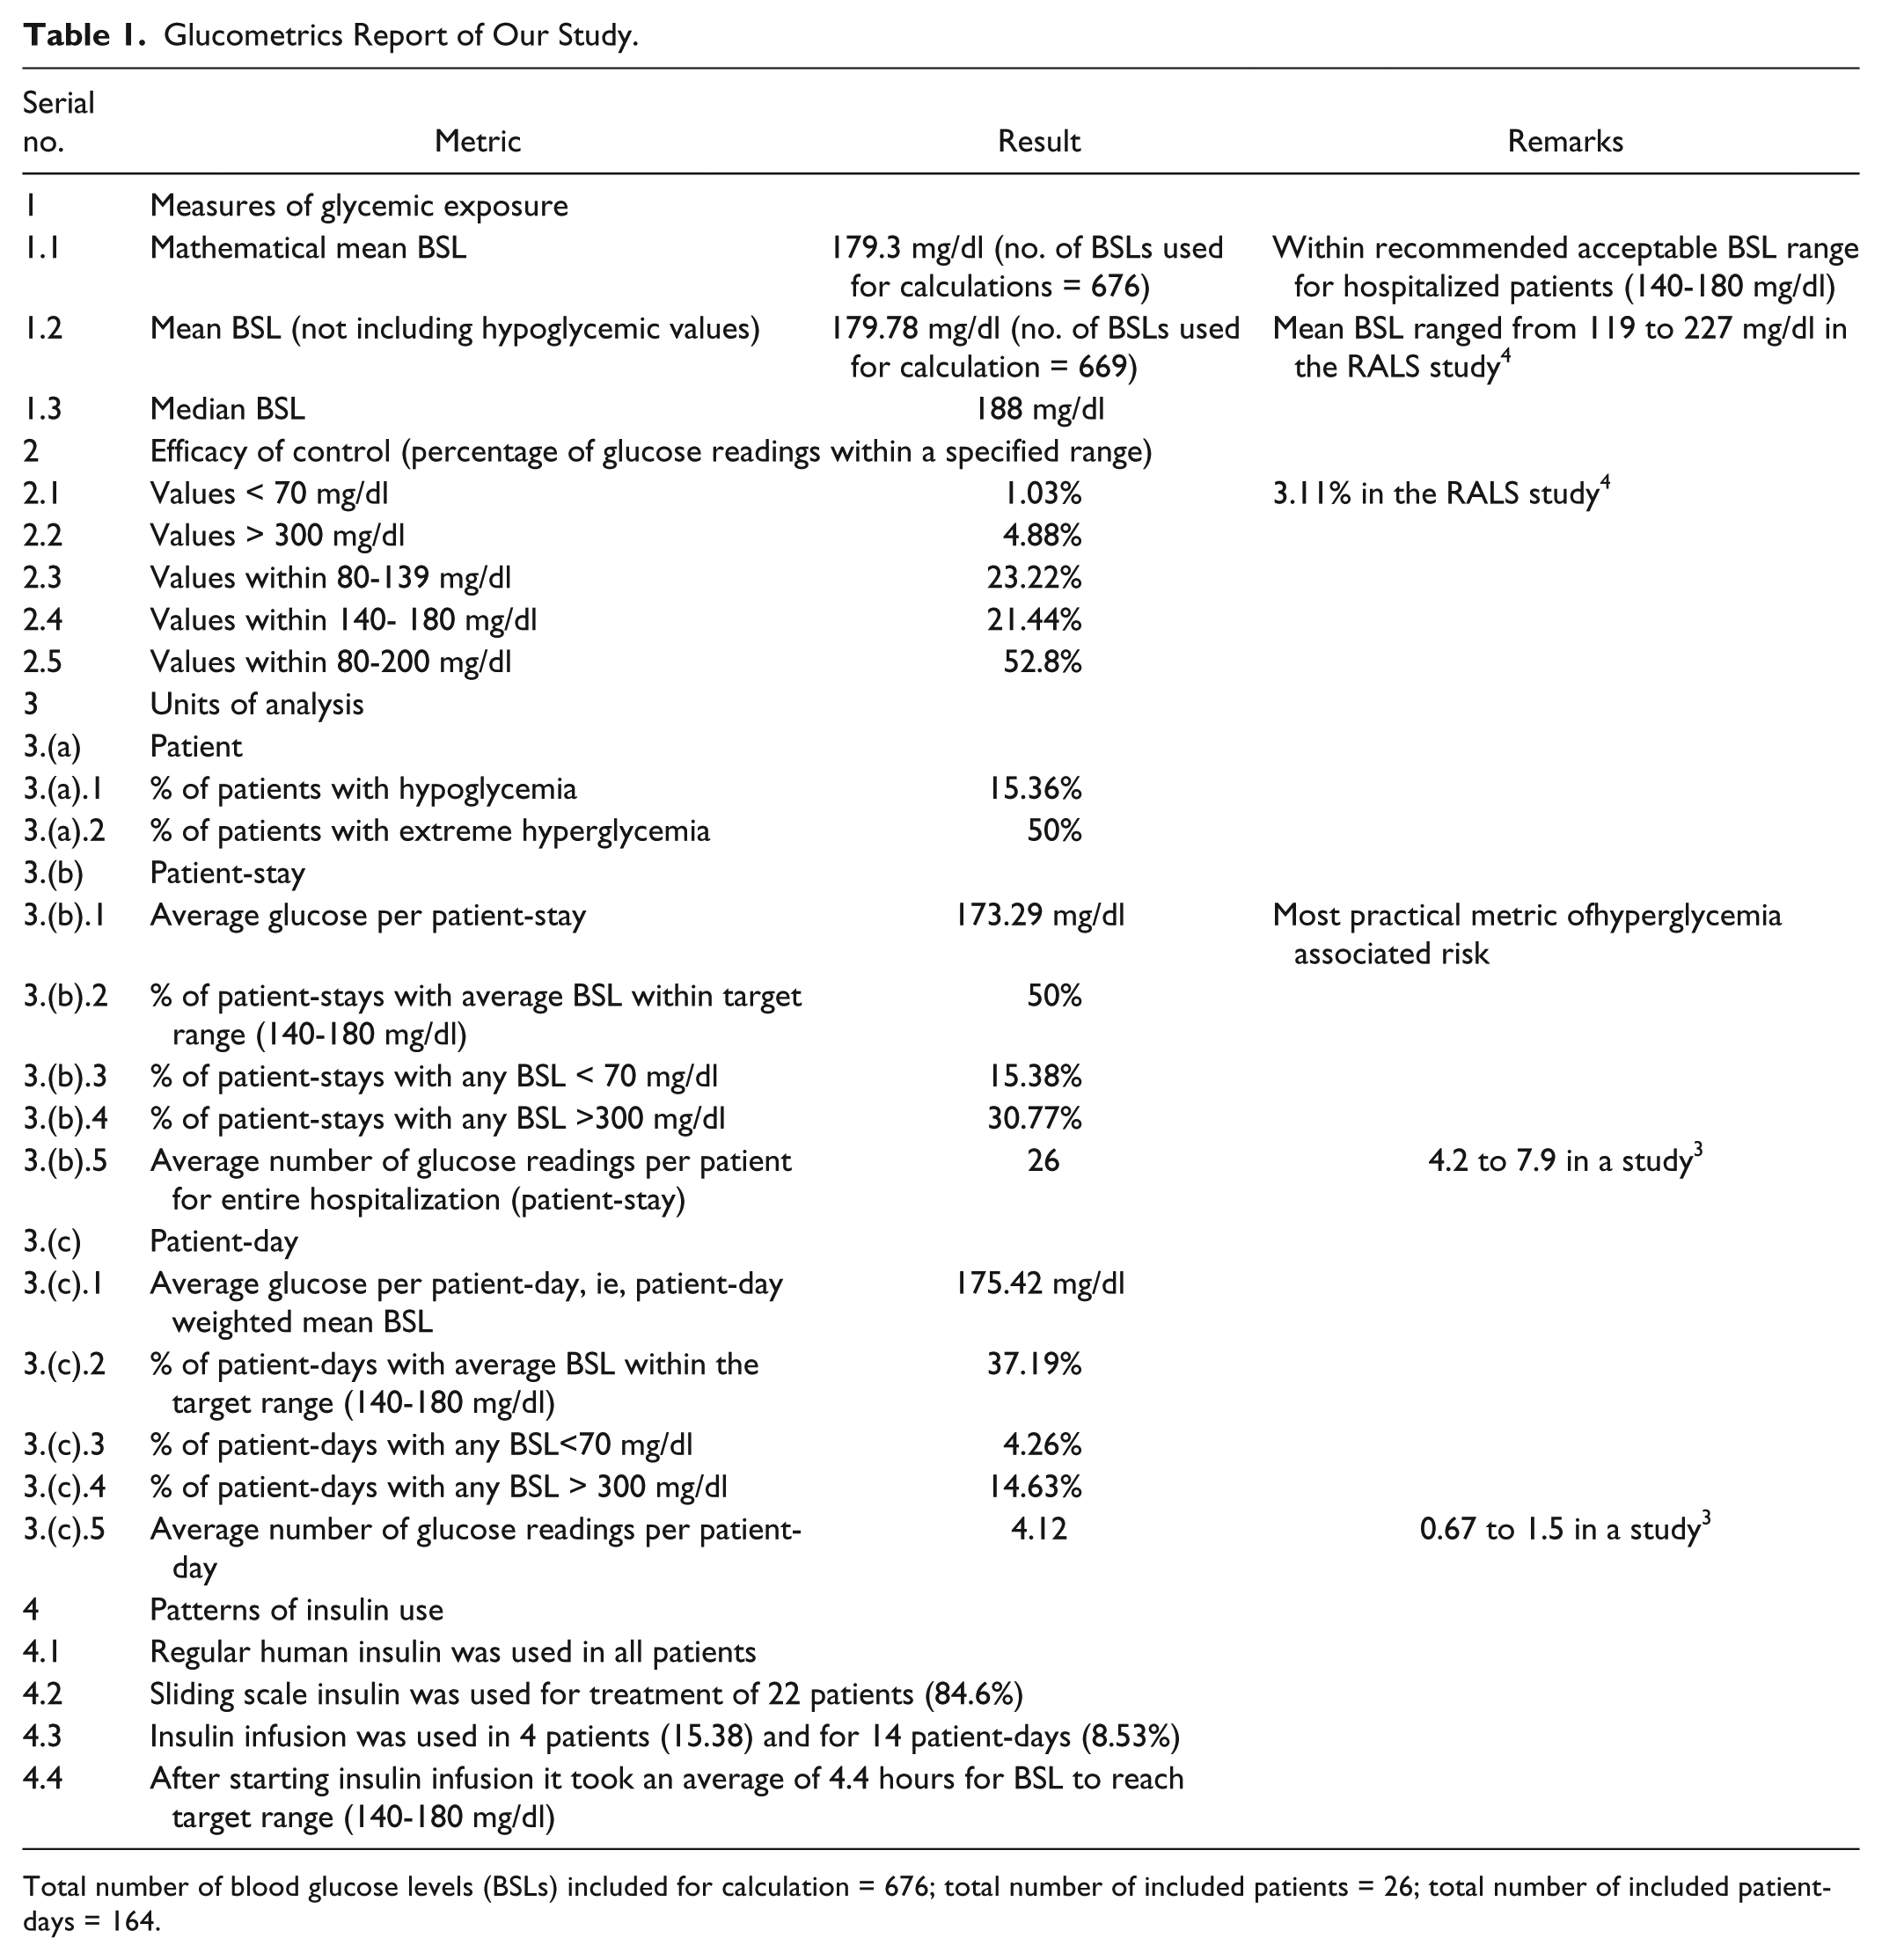
Total number of blood glucose levels (BSLs) included for calculation = 676; total number of included patients = 26; total number of included patient-days = 164.
The data required to generate glucometrics for a hospital or unit of the hospital can be collected by the following methods:
Analysis of the actual medical records (chart abstraction technique):
5
Analysis of data from automated lab information systems:3
-5
Hospitals with limited IT resources can connect to and import their data to external data management systems. 4 For hospitals with limited IT resources and who are unable to connect to these external data management systems due to their geography or other limitations, the chart abstraction technique remains the only option. As the process is labor-intensive, only a convenience sample of records can be analyzed. But, this technique offers a chance for institutes to assess their in-patient glycemic control. The glucometrics report offers a glimpse into the world of glycemic control at that hospital during the period of the study and to compare it with results from other hospitals and centers of excellence. 4 The limitations of our study are that it was a single unit study, with a small sample size.
Thus, in hospitals with limited IT support, chart abstraction technique can be used to generate these metrics. Even in the United States, more than half (59%) of the hospitals do not have an automated capability to extract and analyze glucose data. 6 Our study can be useful for all these hospitals.
Footnotes
Abbreviations
IT, information technology; BSL, blood glucose level; ICU, intensive care unit.