
Abstract
Background:
The accuracy of continuous glucose monitoring (CGM) systems is crucial for the management of glucose levels in individuals with diabetes mellitus. However, the discussion of CGM accuracy is challenged by an abundance of parameters and assessment methods. The aim of this article is to introduce the Continuous Glucose Deviation Interval and Variability Analysis (CG-DIVA), a new approach for a comprehensive characterization of CGM point accuracy which is based on the U.S. Food and Drug Administration requirements for “integrated” CGM systems.
Methods:
The statistical concept of tolerance intervals and data from two approved CGM systems was used to illustrate the CG-DIVA.
Results:
The CG-DIVA characterizes the expected range of deviations of the CGM system from a comparison method in different glucose concentration ranges and the variability of accuracy within and between sensors. The results of the CG-DIVA are visualized in an intuitive and straightforward graphical presentation. Compared with conventional accuracy characterizations, the CG-DIVA infers the expected accuracy of a CGM system and highlights important differences between CGM systems. Furthermore, it provides information on the incidence of large errors which are of particular clinical relevance. A software implementation of the CG-DIVA is freely available (https://github.com/IfDTUlm/CGM_Performance_Assessment).
Conclusions:
We argue that the CG-DIVA can simplify the discussion and comparison of CGM accuracy and could replace the high number of conventional approaches. Future adaptations of the approach could thus become a putative standard for the accuracy characterization of CGM systems and serve as the basis for the definition of future CGM performance requirements.
Keywords
Introduction
Long-standing research in continuous glucose monitoring (CGM) has highlighted the importance of CGM system performance and reliability. One of the most crucial aspects of CGM performance is accuracy, which will be the focus of this article. In particular, it will deal with point accuracy, that is, the closeness of agreement between CGM and corresponding data from a comparator device assumed to be of higher measurement quality at a single point in time, as opposed to trend accuracy focusing on rate of change agreement.
Many different approaches to characterize CGM point accuracy have been utilized over the years. Despite ongoing criticism,1-4 the mean absolute relative difference (MARD) between CGM and comparator measurements remains widely accepted. Another common parameter is the agreement rate (AR), which provides the percentage of CGM measurements within certain limits, for example, ±20%, of their paired comparator measurements. Additionally, the calculation of correlation coefficients in the context of linear regression analysis is common. Furthermore, the error grid analysis, originally developed for blood glucose monitoring systems (BGMS) but also applied to CGM systems, is very common. It provides another parameter as well as a graphical visualization.5-7 A dedicated error grid analysis for CGM systems that includes the rate of change in glucose levels has been proposed in 2004. 8 However, as its calculation and interpretation are considered to be very complex, it is rarely used today.9,10 To determine CGM precision, the mean deviation between paired measurements of two sensors in the same subject (PARD) is commonly used. However, a more useful characterization of the variability of accuracy between sensors can be provided with a histogram of sensor-specific MARD values.11-13
From this brief overview of parameters, it should become clear that the discussion of CGM accuracy is complicated by the abundance of existing approaches. 10 In this context, the Clinical and Laboratory Standards Institute (CLSI) has published the POCT05 guideline on “performance metrics for continuous interstitial glucose monitoring,” 14 which seems to be at least partially implemented in user manuals of current CGM systems.15,16 Here, extensive tables with AR results for different limits (eg, ±15%, ±20%, ±30%, and ±40%) and MARDs in various glucose ranges are provided and accompanied by concurrence tables between CGM and comparator measurements in an even larger number of glucose ranges. This, however, fails to alleviate the previously mentioned issue of abundance and it is questionable whether this method of accuracy characterization is suitable for the readers of user manuals, that is, clinicians and patients.
In 2018, the United States Food and Drug Administration (FDA) released special control regulations, which, for the first time, included the definition of minimum acceptance requirements for “integrated” CGM systems (Table 1).17,18 In terms of point accuracy, the FDA requirements were mainly defined on the parameter of AR, in particular its lower one-sided 95% confidence bound, thus reducing the primary outcome to a single parameter. However, ARs alone fail to provide separate information on bias and imprecision and a distinct analysis of sensor-to-sensor variability is not demanded at all.
FDA Requirements for Point Accuracy. 17
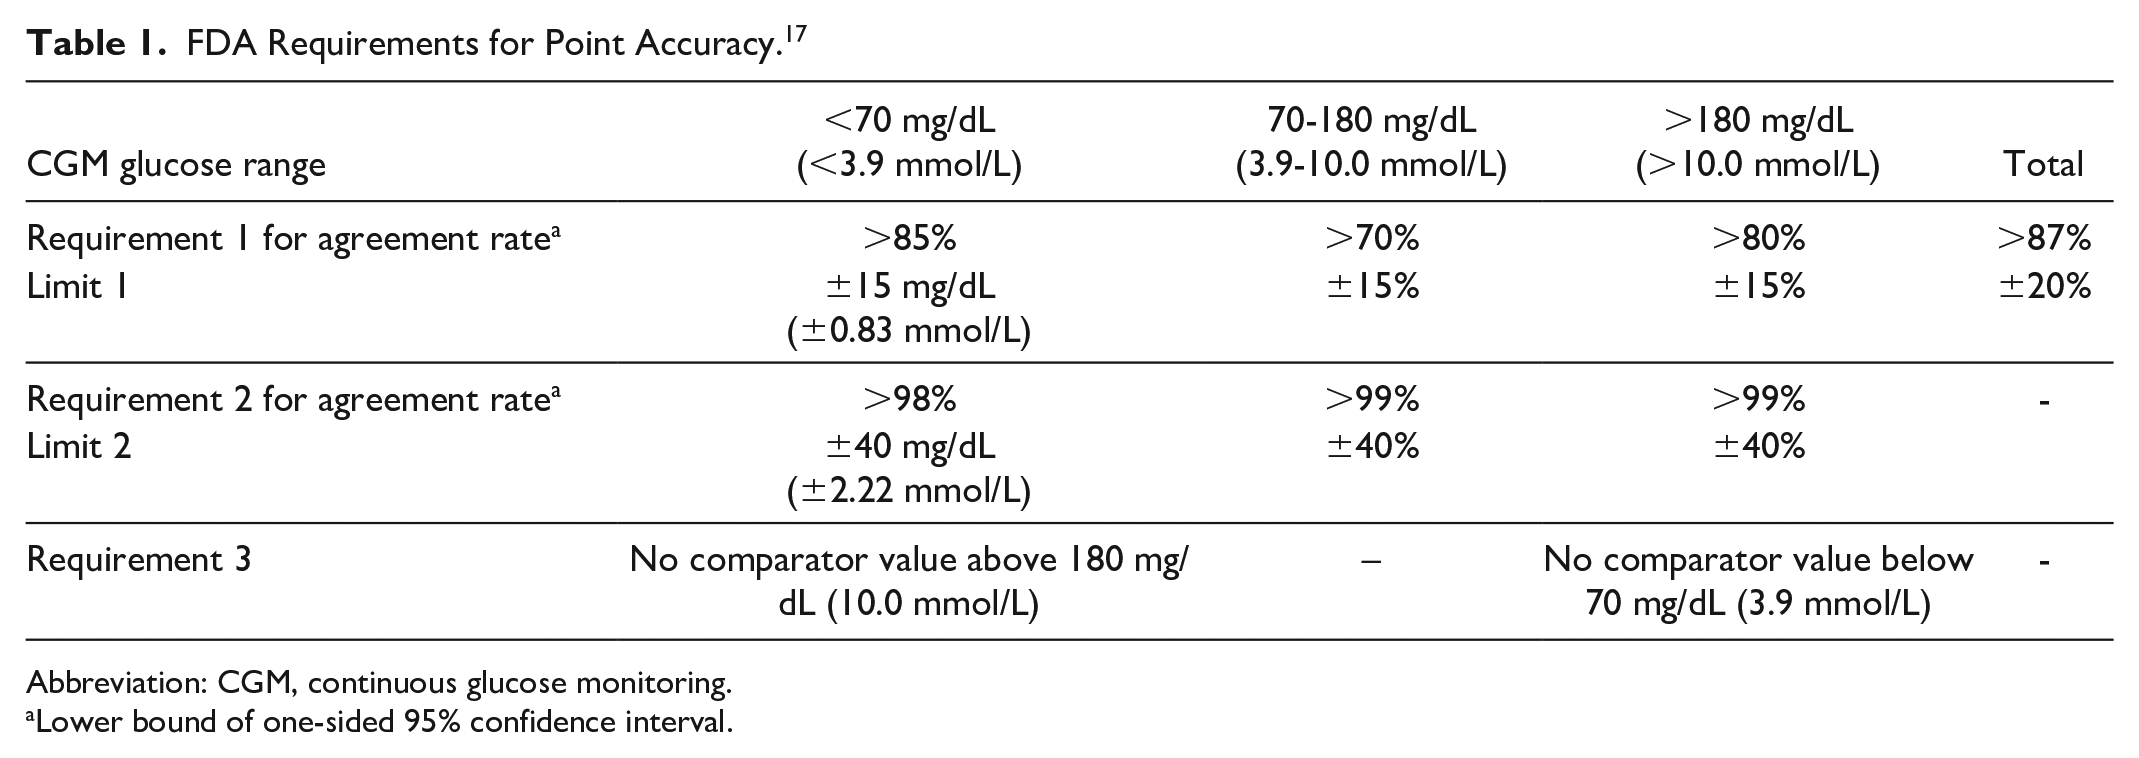
Abbreviation: CGM, continuous glucose monitoring.
Lower bound of one-sided 95% confidence interval.
With the aim of further standardizing and simplifying the characterization of CGM accuracy while also increasing its accessibility, this article introduces the Continuous Glucose Deviation Interval and Variability Analysis (CG-DIVA). It is based on the FDA requirements but provides additional characteristics that cover all relevant aspects of CGM point accuracy while allowing a straightforward evaluation and interpretation. It should thus mainly appeal to manufacturers, researchers and regulators but clinical practitioners should also be able to interpret it.
The present article supports the activities of a working group on CGM (WG-CGM) established by the Scientific Division of the International Federation of Clinical Chemistry and Laboratory Medicine (IFCC). 19
Methods
Statistical Methodology
The CG-DIVA focuses on the analysis of deviations between paired CGM and comparator measurements, which can provide independent information on precision and bias. A suitable approach for describing the distribution of these deviations would be to use the well-known boxplot where the median (representing bias) and the central 50% interval between the 25th and 75th percentiles (representing precision) of the deviations are calculated. To consolidate this approach with the FDA requirements for point accuracy (Table 1), the statistical concept of tolerance intervals was utilized, 20 as it has two main advantages over the classical boxplot. First, it allows the calculation of an interval by which any percentage of deviations is covered, not just 50% in case of the boxplot. We can therefore use of the minimum requirements for the ARs, for example, 87%, to define the coverage of the intervals. Second, tolerance intervals incorporate the statistical uncertainty that comes with any data collection process, thus implementing the FDA requirement of using confidence intervals on their ARs. In particular, the tolerance intervals make a statement about the range of deviations generally expected from the CGM system (with a confidence of 95%), not just the particular range found in the data set of one clinical study.
For the calculation of the tolerance intervals a bias-corrected and accelerated bootstrap method21,22 accounting for the clustered structure of the data was employed. This was necessary as the data recorded within individual sensors cannot be considered statistically independent. Instead, each CGM sensor forms a distinct cluster, which has to be preserved during the bootstrapping process. More details on the statistical calculations are provided in the Supplementary Materials.
The novel approach was compared with conventional accuracy parameters by calculating ARs and their lower 95% confidence limits (using the same bootstrapping procedure as described above) as well as aggregate MARDs (averaged over all CGM-comparator pairs).
Data Description
A detailed description of the study used to exemplify the CG-DIVA has been published previously.23,24 In short, data was collected from 24 subjects using two approved CGM devices. CGM system A required manual calibrations, whereas system B was factory-calibrated. The systems are pseudonymized because this article focuses on the CG-DIVA as a methodology and not the performance of the CGM systems, which has been discussed previously.23,24 Comparator measurements were obtained from capillary samples using a commercially available blood glucose monitoring system (BGMS) that was also used to calibrate CGM system A according to manufacturer’s instructions. A total of 3989 and 3619 CGM-comparator measurement pairs were available for CGM system A and B, respectively, with approximately 7%, 63%, and 30% of comparator measurements falling in the ranges <70, 70-180 and >180 mg/dL (<3.9, 3.9-10.0 and >10.0 mmol/L), respectively.
Results
Conventional Accuracy Characterization
The results of a conventional accuracy characterization including ARs and MARDs are provided in Table 2. Furthermore, a histogram of individual sensor MARDs is provided in Figure 1.
Accuracy Parameters of CGM Systems A and B.
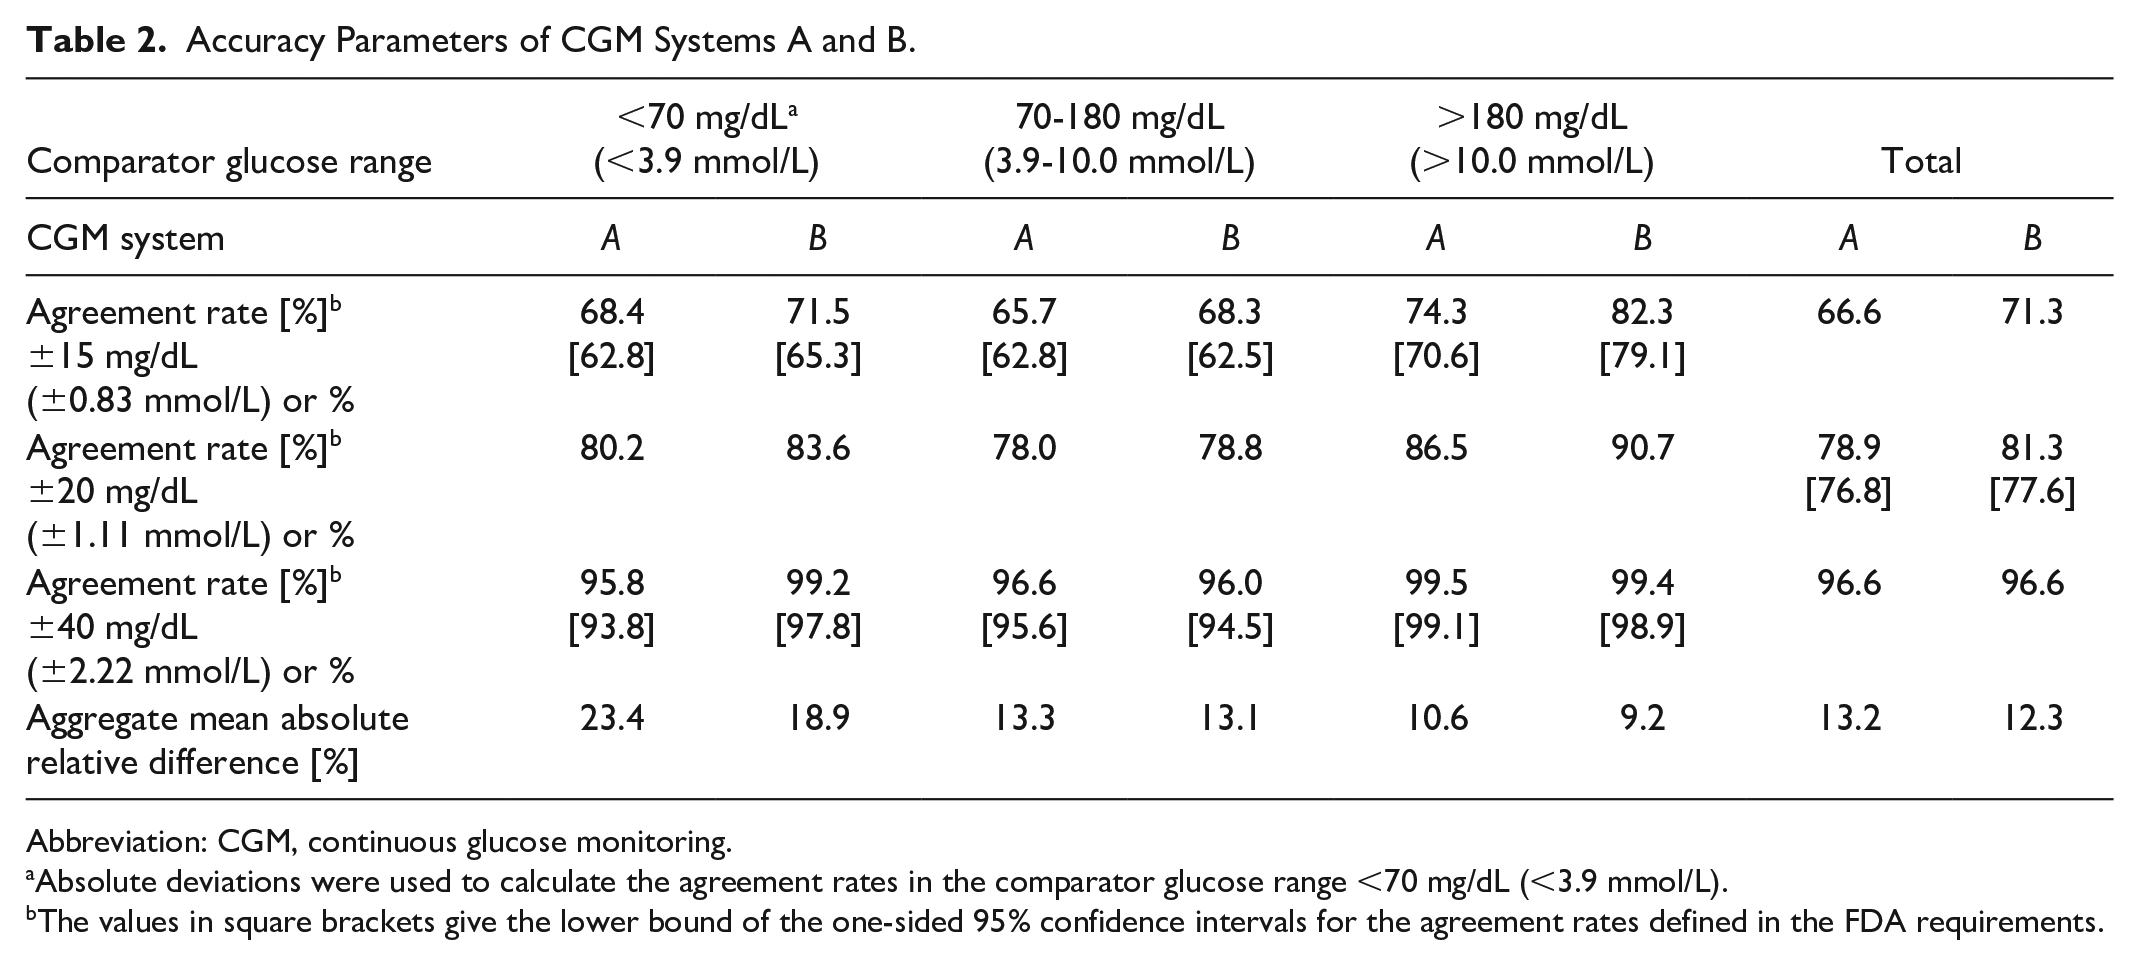
Abbreviation: CGM, continuous glucose monitoring.
Absolute deviations were used to calculate the agreement rates in the comparator glucose range <70 mg/dL (<3.9 mmol/L).
The values in square brackets give the lower bound of the one-sided 95% confidence intervals for the agreement rates defined in the FDA requirements.
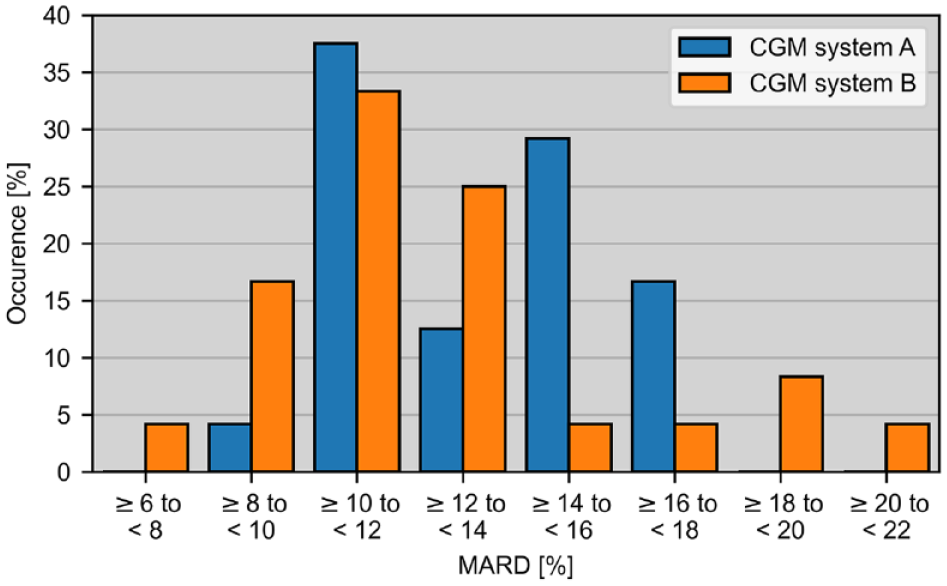
Histogram of mean absolute relative deviations (MARD) calculated over each of the 24 sensors of CGM systems A (manually calibrated) and B (factory-calibrated) each. Aggregate MARD results (average of all CGM-comparator pairs) are 13.2% and 12.3% for CGM systems A and B, respectively.
Continuous Glucose Deviation Interval and Variability Analysis (CG-DIVA) and Graphical Presentation
As mentioned before, the CG-DIVA presented in this article is based on the FDA requirements for point accuracy in Table 1. However, the CG-DIVA divides the glucose range according to the comparator, not CGM measurements, while keeping the same stratification into hypo-, normo-, and hyperglycemia, <70, 70-180, >180 mg/dL (<3.9, 3.9-10.0, >10.0 mmol/L). Furthermore, instead of ARs alone, the focus is put on deviations to provide direct information on bias and precision of the CGM system, which could be clinically more relevant than AR alone. In accordance with the FDA requirements, absolute deviations are calculated for comparator glucose levels <70 mg/dL (<3.9 mmol/L) and relative deviations for all others. Furthermore, a prerequisite for the application of FDA requirements as well as the CG-DIVA is the availability of a robust dataset obtained from a clinical study designed to fully represent the performance of the CGM system across the intended use population and measuring range.
The CG-DIVA itself is divided into two parts. Its results are displayed in two separate plots (Figure 2) and in Table 3.
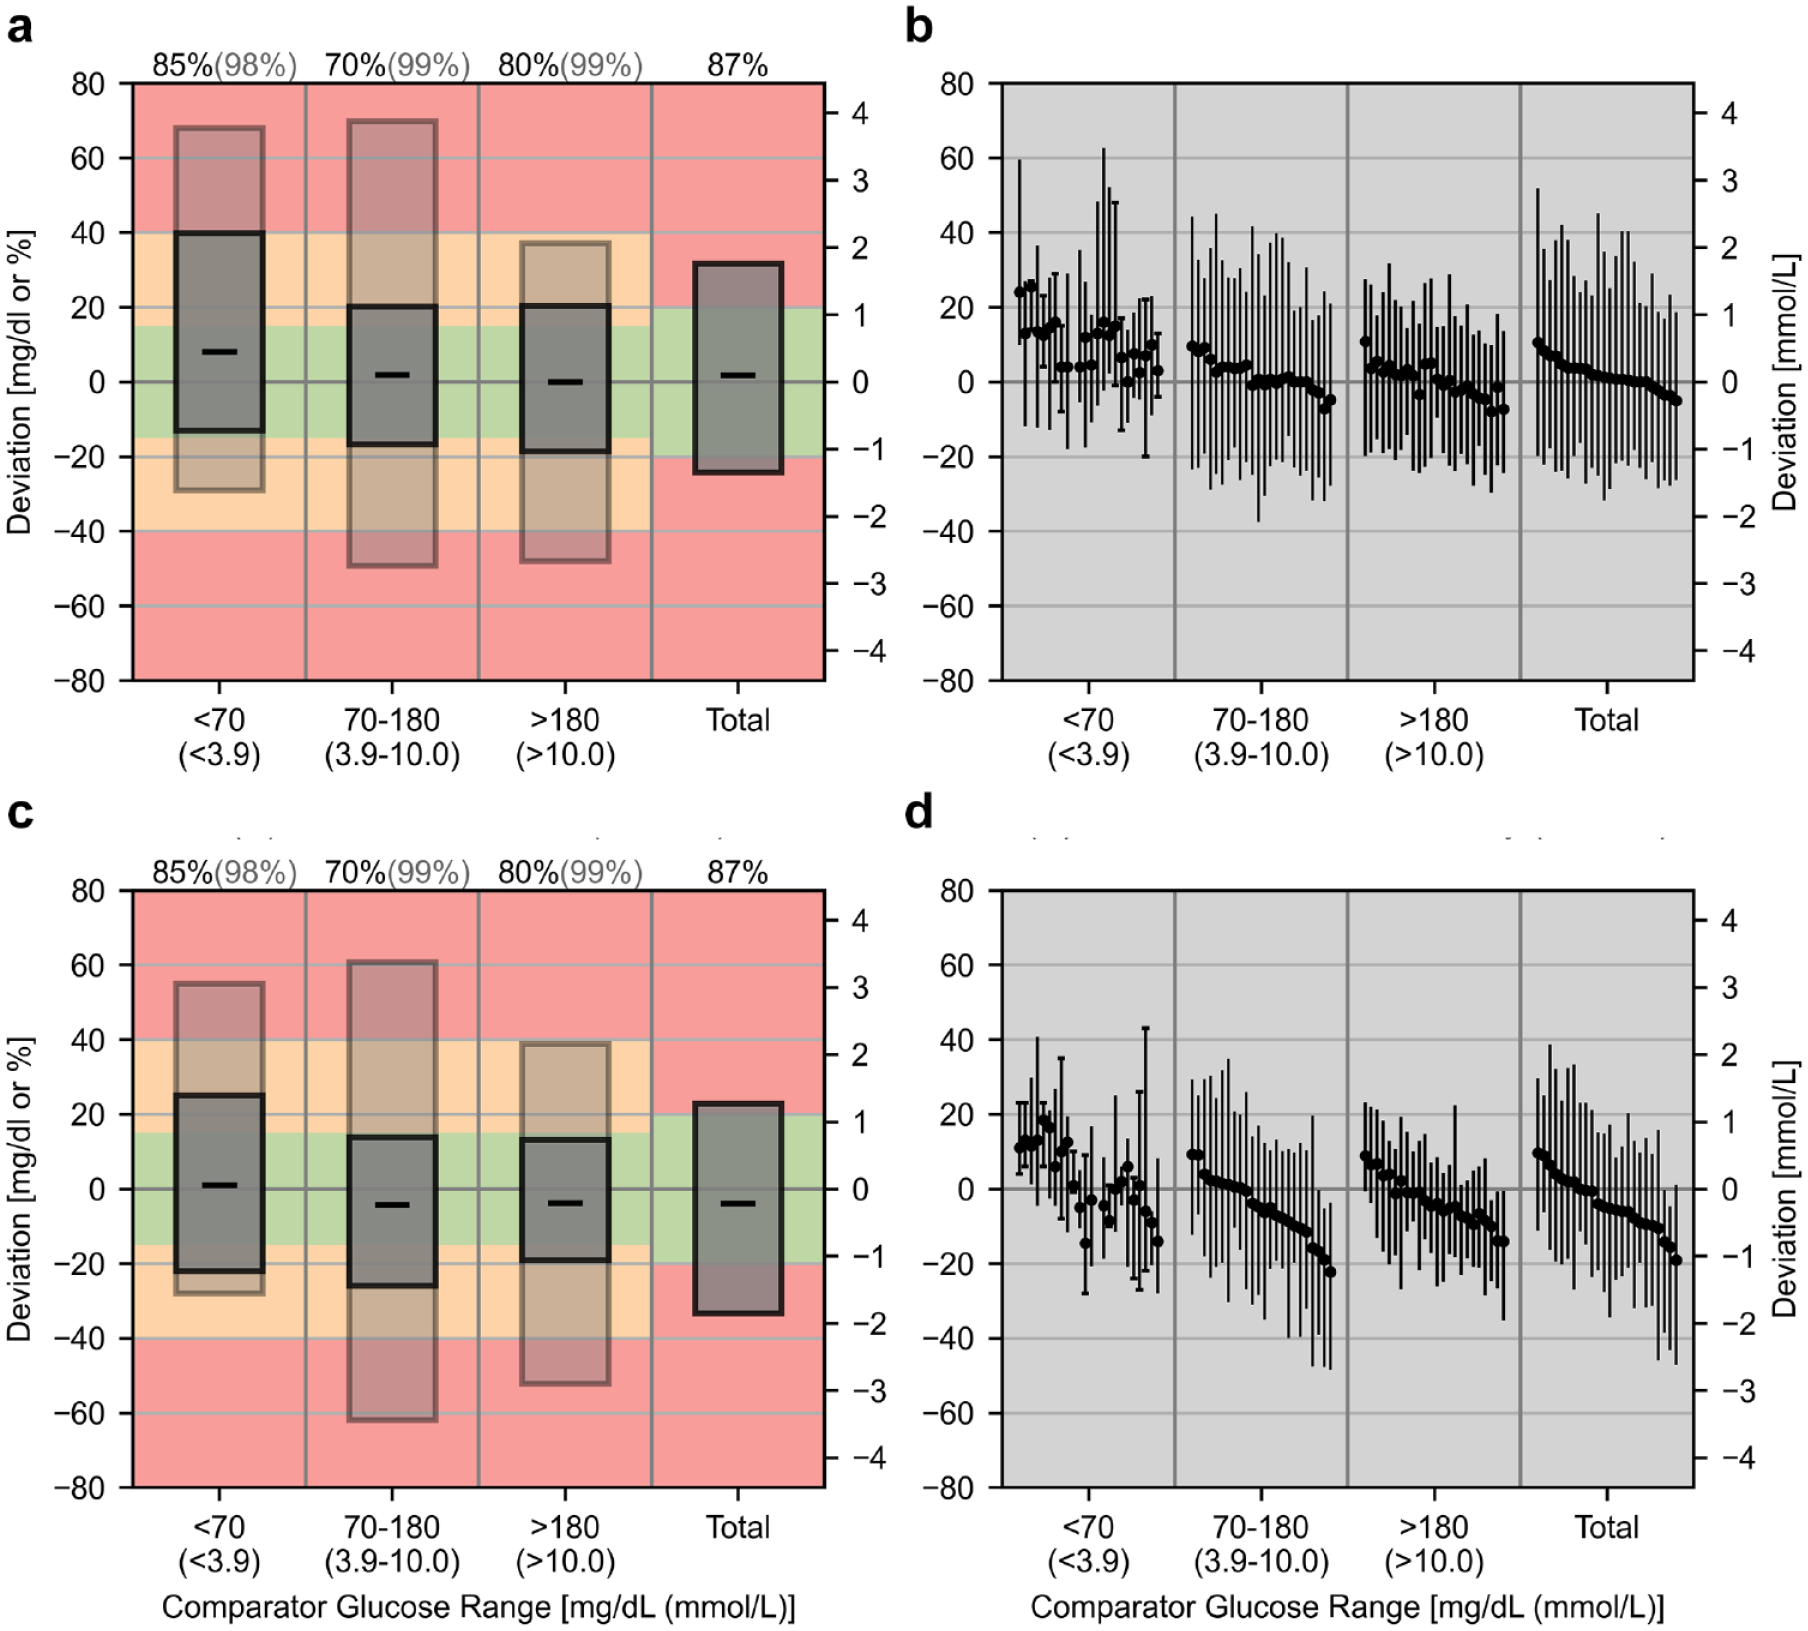
Results of the Continuous Glucose Deviation Interval and Variability Analysis (CG-DIVA) for datasets of CGM system A (manually calibrated) (a), (b) and CGM system B (factory-calibrated) (c), (d). Absolute deviations (in mg/dL on left y-axis and mmol/L on right y-axis) are provided for comparator glucose levels <70 mg/dL (<3.9 mmol/L) and relative deviations for all other levels (in percent on left y-axis). (a), (c) Deviation intervals, that is, the expected range of deviations, in different comparator glucose ranges. The median deviations are shown by the black dashes. The coverage of the deviation intervals, that is, the percentage of deviations falling within the intervals were set according to the requirements defined by the U.S. Food and Drug administration (FDA) and printed above the plot. The dark gray box represents FDA requirement 1 and the light gray box represents requirement 2. The colored background indicates the extent of the deviations and was based on limit 1 and 2 of the FDA requirements. (b), (d) Characterization of the sensor-to-sensor variability. Each sensor is described by its median and 90%-range of deviations and sensors are ordered according to the median deviation in the total glucose range. If less than ten data points within a range are available for a sensor, the full range of deviations is displayed and indicated with caps.
Numerical Results of the CG-DIVA.
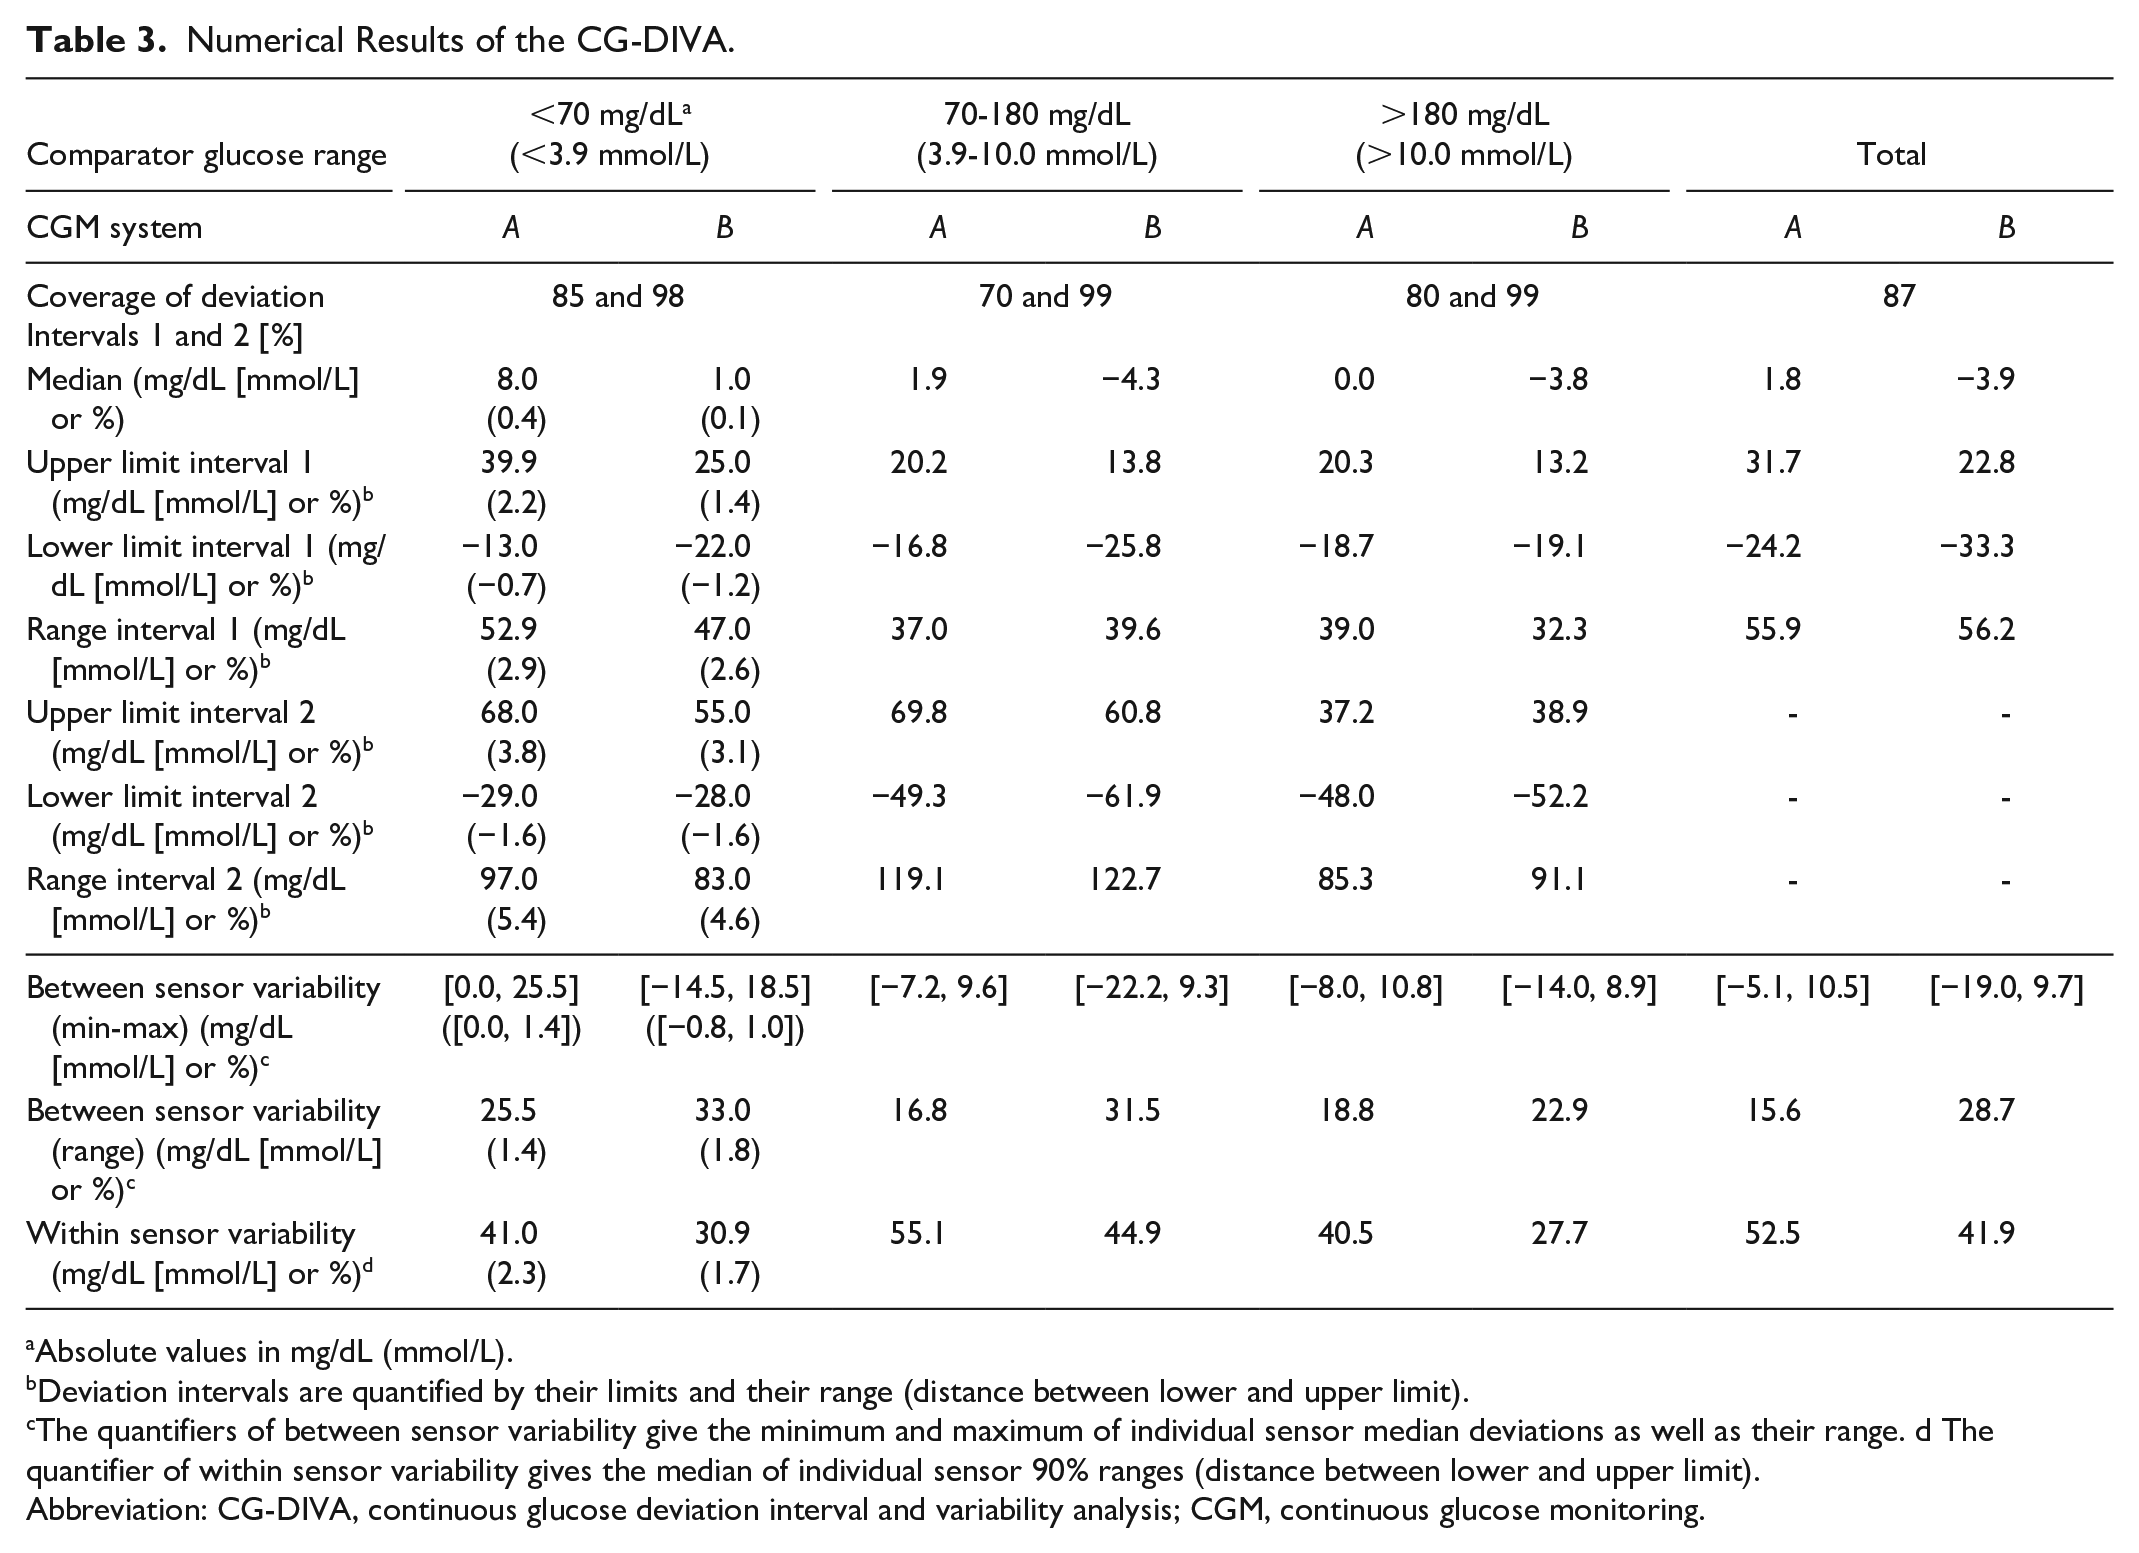
Absolute values in mg/dL (mmol/L).
Deviation intervals are quantified by their limits and their range (distance between lower and upper limit).
The quantifiers of between sensor variability give the minimum and maximum of individual sensor median deviations as well as their range. d The quantifier of within sensor variability gives the median of individual sensor 90% ranges (distance between lower and upper limit).
Abbreviation: CG-DIVA, continuous glucose deviation interval and variability analysis; CGM, continuous glucose monitoring.
Deviation Intervals
The first part of the CG-DIVA uses the previously described concept of tolerance intervals to infer so-called deviation intervals, that is, the range of deviations from a comparator that can be expected from the CGM system in general. They are depicted by the boxes in Figure 2a and c. The median deviations are shown by the black dashes, thus a dash above zero (positive median deviation) would mean a systematic overestimation of glucose levels and vice versa. The coverage of the deviation intervals, that is, the percentage of deviations falling within the intervals were set according to the AR requirements defined by the FDA (Table 1) and printed above the plot. The dark gray box represents FDA requirement 1 and the light gray box represents requirement 2. The colored background indicates the extent of the deviations and was based on limit 1 and 2 of the FDA requirements. The corresponding numerical values for the limits of the deviation intervals as well as the range they cover are provided in Table 3. For example, the CG-DIVA results for CGM system A can be interpreted as follows: When glucose levels are >180 mg/dL (>10.0 mmol/L) we can expect that 80% of deviations lie between +20.3% and −18.7% (dark gray box). As this interval is centered around the median, it directly follows that 10% of deviations are expected to be greater than +20.3% and the remaining 10% of deviations greater than −18.7%. Analogously to that, the second interval (light gray boy) gives the information that 99% of deviations are expected to lie between +37.2% and −48.0%, and therefore, 0.5% or one in 200 deviations are expected to fall above and below this interval, respectively.
Additionally to this information on the extent of deviations, the CG-DIVA results can also be interpreted in relation to the corresponding ARs and their lower confidence bounds in Table 2.In both CGM systems, the deviation intervals for the total glucose range clearly extend into the red areas, which correctly indicates that corresponding lower AR confidence bounds are below the threshold of 87%. In general, the AR confidence bound requirements are likely not met whenever the corresponding deviation interval, that is, the upper and lower edges of the boxes, extends into the yellow and red areas, respectively. Conversely, if the deviation intervals lie within these areas, the requirements are most likely met. If only one interval edge is above the limit, like, for example, for deviation interval 2 (light gray box) in the hyperglycemic range of system A, it is possible for the corresponding AR confidence bound (99.1%) to meet the respective requirement (99%). Here, it should be mentioned that, in contrast to the FDA, the CG-DIVA uses the comparator glucose measurements to stratify the glucose range, meaning that the results cannot be directly interpreted in terms of compliance with FDA criteria.
Sensor-to-Sensor Variability
The second part of the CG-DIVA characterizes the variability in accuracy between and within individual sensors of the same CGM system, exemplified in Figure 2b and d. For that, each sensor is described by its median and central 90% range of deviations within every comparator glucose range. Specifically, a positive median deviation means that the sensor systematically overestimates the glucose level and vice versa. The sensors are ordered by their median deviations across the total glucose range. If less than ten data points are available for a sensor, which only occurs in the glucose range <70 mg/dL (<3.9 mmol/L) in the examples, a determination of the 90% range is not sensible. In this case, the full range of deviations is displayed and indicated by the capped bars. The corresponding numerical results of between and within sensor variability are summarized in Table 3. Here, the minimum/maximum and range of median sensor deviations and the median of 90% ranges are provided. In contrast to the first part of the CG-DIVA, it should be emphasized that this is a purely descriptive analysis of the collected data not accounting for the statistical uncertainty.
Discussion
The CG-DIVA is based on the FDA requirements for integrated CGM systems,17,18 and focuses on the analysis of deviations between CGM and comparator measurements to characterize the accuracy of a CGM system. In particular the deviation intervals go beyond a basic description of the dataset and infer the system performance in general. For this, it is assumed that the data set obtained from the CGM performance evaluation study is robust. The properties of the data set used in this article can be considered as a minimum with regards to number of sensors and number of data points per comparator glucose range. The example data sets presented in this article were chosen to explain and illustrate the CG-DIVA and its interpretation rather than to discuss the accuracy of the examined CGM systems.
Diverging from the FDA requirements, the CG-DIVA uses the comparator instead of CGM measurements to stratify glucose levels into different ranges. This choice was made as the stratification with respect to the examined measurement system is highly unusual in the field of clinical chemistry and inconsistent to the FDA requirements for BGMS, for both over-the-counter and point-of-care use.25,26 Furthermore, it means that the method for stratifying the data for accuracy assessment depends on the accuracy of the CGM system, while it should only depend on the accuracy of the comparator method. As a result, the AR, for example, <70 mg/dL (<3.9 mmol/L), does not directly characterize the accuracy during hypoglycemia, but rather when the CGM system indicates hypoglycemia, which, depending of the system performance could be quite different from true hypoglycemia. It thus hinders the comparison of different CGM systems amongst each other.
In comparison to the conventional ARs and MARDs, the deviation intervals in the CG-DIVA can provide a more comprehensive picture of CGM accuracy and reveal important differences between various systems. For example, the AR and MARD results of CGM systems A and B in the normoglycemic range, provided in Table 2, are very similar suggesting a comparable accuracy. However, comparing the corresponding results of the CG-DIVA from Figure 2a and c and Table 3, it is revealed that system A shows a difference between approximately 5% and 10% in median and deviation interval limits compared to system B, which could affect clinical decision making. Inspecting the accuracy in the hypoglycemic range, the conventional parameters indicate better performance of system B, which is confirmed by the results of the CG-DIVA, especially through the decreased upper limit of deviation interval 1 in system B, 25.0 vs 39.9 mg/dL (1.4 vs 2.2 mmol/L). However, the CG-DIVA provides the additional information that system A has a considerable positive bias, thus increasing the risk of delayed or missed hypoglycemia treatment. Similar to previous works,1-4 these results demonstrate that conventional accuracy parameters, especially the MARD, are not suitable to provide a comprehensive picture of the point accuracy of a CGM system.
Beyond bias, imprecision and AR, the CG-DIVA provides information on the incidence of particularly large deviations by allowing the statement that, for example, one in 10 deviations of CGM system A are expected to be larger than +39.9 mg/dL (+2.2 mmol/L) in the hypoglycemic range. This information is clinically more meaningful than information on the average performance, because these large deviations can lead to severe errors in therapy decisions or automated insulin dosing. In fact, analyses of adverse event databases with respect to CGM inaccuracies have shown that large deviations occurring during CGM use outside clinical studies have been related to serious outcomes,27,28 calling for a greater focus on large errors that occur only sporadically. In this context, the AR might be an unsuitable parameter to characterize these types of errors because deviations outside their limits (±15 and ±40 mg/dL or %) are treated independent from their magnitude. This could be the rationale for the inclusion of requirement 3 by the FDA (Table 1). Furthermore, the AR treats positive and negative deviations equally, which might be inappropriate for the hypo- and hyperglycemic glucose ranges. In contrast, the CG-DIVA characterizes positive and negative deviations separately and is more sensitive to outliers thus providing a better characterization of large but sporadic deviations.
A further advantage of the CG-DIVA is that its results are presented in graphical form, which increases their interpretability and accessibility in comparison with ARs and MARDs usually presented in tabular form. Comparing the presentation of the deviation intervals with conventional graphical summaries such as the difference or the error grid plots, the information is presented more concisely, allowing the identification of the most important accuracy characteristics and differences between CGM systems. The graphical presentation should therefore be accessible to people with a limited statistical background.
The second part of the CG-DIVA characterizes variability in accuracy from sensor to sensor, a crucial aspect of CGM performance that is often neglected and not demanded by the FDA. Examining the conventional approach of displaying a histogram of MARDs in Figure 1, it can be suspected that CGM system B has a higher variability between sensors; however, the impact of this variability on the measurement results is not clear. In contrast, Figure 2b and d and Table 3 give a more comprehensive characterization of sensor-to-sensor variability. Here, the larger variability between sensors in CGM system B is clearly shown by the differences in median sensor deviations across all comparator glucose ranges, which can be explained through the fact that system B is factory-calibrated. Furthermore, the results from the hypoglycemic range <70 mg/dL (<3.9 mmol/L) show that, despite a median bias close to zero, individual sensors of CGM system B can have a considerable positive bias, similar to system A. Additionally, it is demonstrated that, despite the larger variability in median deviations of system B, the within sensor variability (90% range indicated by the antennae in the plot range and summarized in the last row of Table 3) is smaller in comparison with the manually calibrated system A.
Despite the described advantages of the CG-DIVA, there are several improvements to discuss. The stratification of the glucose range into hypo-, normo-, and hyperglycemic ranges was based on the FDA requirements, which were in turn based on the clinical “Time in Range” limits. 29 While these ranges are well-established and can be used to characterize the status of glycemic control, they are not ideal for assessing the accuracy of a CGM system. For example, hypoglycemia prevention measures like automatically suspending basal insulin infusion or raising a respective alert are typically made at glucose levels above 70 mg/dL (3.9 mmol/L), especially when glucose levels are decreasing. However, the glucose range relevant for hypoglycemia prevention, which might be between 70 and 100 mg/dL (3.9 and 5.55 mmol/L), is currently incorporated in the 70 to 180 mg/dL (3.9-10.0 mmol/L) range, disallowing a distinct assessment of accuracy in the crucial 70 to 100 mg/dL (3.9-5.55 mmol/L) range. It might thus be sensible to extend the first glucose range to glucose levels of up to 100 mg/dL (5.55 mmol/L). This would also solve the issue that there is a discontinuity in the quantification of deviations, when switching from absolute to relative deviations at glucose levels of 70 mg/dL (3.9 mmol/L).
An additional improvement could be made by adapting the coverage percentages of the deviation intervals, that is, the share of deviations they display. In its current form, the coverage percentages are different for each comparator glucose range, thus making it difficult to compare the accuracy, in particular imprecision, across ranges. These percentages were chosen according to FDA requirements 1 and 2 for the ARs; however, the clinical rationale for these requirements is unclear. For example, to allow clinically useful statements about deviations with an incidence of one in 10 or one in one 100, it might be pertinent to consistently choose the coverage of deviation intervals 1 and 2 to 80% and 98%, respectively. This, however, would also require an adaptation of the acceptance limits, for example, ±15% or ±40%, depicted with the colored background of the deviation interval plot.
It should also be mentioned that the introduced methodology is, for the moment, only focused on point accuracy. However, CGM systems also provide information on the rate of change of glucose which is used for therapy decisions as well as automated insulin delivery. A reliable assessment of trend accuracy requires frequent comparator sampling over longer periods of time. Furthermore, the study design, in particular the fraction of data points obtained during rapid changes in glucose concentration, affects the point accuracy. Future work will focus on extending the CG-DIVA with a similar characterization of rate accuracy. Additionally, an extension to include a description of sensor stability, that is, the accuracy over the sensor use life, is planned.
To enable both a scientific and clinical discourse and to promote the use of CG-DIVA, a free and open-source software package allowing easy utilization of the approach on multiple platforms is published alongside this article (https://github.com/IfDTUlm/CGM_Performance_Assessment). Here, further details on the use of the software can be found.
Conclusions
The present article introduced the CG-DIVA, a novel approach for the comprehensive assessment of CGM point accuracy that focuses on the analysis of deviations, while also characterizing the variability in accuracy between sensors. By leveraging techniques from inferential statistics, the CG-DIVA provides universal information about the examined CGM system, beyond a simple description of the data collected in clinical studies. Furthermore, the approach summarizes the results in an easily accessible graphical form and incorporates all relevant aspects of CGM point accuracy, including the incidence of large deviations affecting clinical outcomes. We therefore argue that the CG-DIVA, especially its graphical display, represents an attractive alternative to the conventional approach of tabulating point accuracy parameters such as MARD and AR in extensive tables, thus simplifying the discussion and comparison of CGM point accuracy.
The first version of the CG-DIVA presented in this article was heavily influenced by the FDA requirements. However, several improvements and adaptations such as the harmonization of deviation interval coverage or the inclusion of a trend accuracy characterization have been discussed and will be subject of future publications. In the long term, we thus argue that further developments of the CG-DIVA could become a standard for the accuracy characterization and presentation of CGM systems, which is facilitated by the continuing publishing of freely accessible software implementations. Furthermore, it could serve as the basis for the definition of CGM performance standards, which is the main aim of the previously mentioned working group on CGM (WG-CGM) of the IFCC.
Supplemental Material
sj-docx-1-dst-10.1177_19322968221134639 – Supplemental material for Continuous Glucose Deviation Interval and Variability Analysis (CG-DIVA): A Novel Approach for the Statistical Accuracy Assessment of Continuous Glucose Monitoring Systems
Supplemental material, sj-docx-1-dst-10.1177_19322968221134639 for Continuous Glucose Deviation Interval and Variability Analysis (CG-DIVA): A Novel Approach for the Statistical Accuracy Assessment of Continuous Glucose Monitoring Systems by Manuel Eichenlaub, Peter Stephan, Delia Waldenmaier, Stefan Pleus, Martina Rothenbühler, Cornelia Haug, Rolf Hinzmann, Andreas Thomas, Johan Jendle, Peter Diem and Guido Freckmann in Journal of Diabetes Science and Technology
Footnotes
Acknowledgements
The authors would like to thank the members of the working group on continuous glucose monitoring established by the International Federation of Clinical Chemistry and Laboratory Medicine for their feedback and discussion regarding the content of this article. Furthermore, the authors thank the Diabetes Center Berne for their financial support.
Abbreviations
AR, agreement rate; BGMS, blood glucose monitoring system; CG-DIVA, continuous glucose deviation interval and variability analysis; CGM, continuous glucose monitoring; CLSI, Clinical and Laboratory Standards Institute; FDA, United States Food and Drug Administration; IFCC, International Federation of Clinical Chemistry and Laboratory Medicine; MARD, mean absolute relative difference; PARD, paired absolute relative difference.
Declaration of Conflicting Interests
The author(s) declared the following potential conflicts of interest with respect to the research, authorship, and/or publication of this article: G.F. is general manager and medical director of the IfDT (Institut für Diabetes-Technologie Forschungs-und Entwicklungsgesellschaft mbH an der Universität Ulm, Ulm, Germany), which carries out clinical studies on the evaluation of BG meters, with CGM systems and medical devices for diabetes therapy on its own initiative and on behalf of various companies. G.F./IfDT have received speakers’ honoraria or consulting fees from Abbott, Ascensia, Berlin-Chemie, Beurer, BOYDsense, CRF Health, Dexcom, i-SENS, Lilly, Metronom, MySugr, Novo Nordisk, PharmaSens, Roche, Sanofi, Sensile, Terumo, and Ypsomed. ME, DW, SP, and CH are employees of the IfDT. P.S. is an advisor to the IfDT. M.R. is an employee of Diabetes Center Berne. R.H. is an employee of Roche Diabetes Care GmbH. J.J. has received speakers’ honoraria or consulting fees from Abbott, Ascensia, Eli Lilly, Medtronic, Novo Nordisk, and Sanofi. A.T. is an independent consultant for diabetes technology. He was Scientific Director at Medtronic Diabetes Germany until 2020. He participated in advisory boards of the company Dexcom. He has received honoraria for lectures from Dexcom, Abbott and Berlin-Chemie (Menarini), among others. P.D. is a board member of PharmaSens.
Funding
The author(s) disclosed receipt of the following financial support for the research, authorship, and/or publication of this article: This study was supported by Diabetes Center Berne, Switzerland.
Supplemental Material
Supplemental material for this article is available online.
References
Supplementary Material
Please find the following supplemental material available below.
For Open Access articles published under a Creative Commons License, all supplemental material carries the same license as the article it is associated with.
For non-Open Access articles published, all supplemental material carries a non-exclusive license, and permission requests for re-use of supplemental material or any part of supplemental material shall be sent directly to the copyright owner as specified in the copyright notice associated with the article.