
Abstract
Background:
The insulin ordering process is an opportunity to provide clinicians with hypoglycemia risk predictions, but few hypoglycemia models centered around the insulin ordering process exist.
Methods:
We used data on adult patients, admitted in 2019 to non-ICU floors of a large teaching hospital, who had orders for subcutaneous insulin. Our outcome was hypoglycemia, defined as a blood glucose (BG) <70 mg/dL within 24 hours after ordering insulin. We trained and evaluated models to predict hypoglycemia at the time of placing an insulin order, using logistic regression, random forest, and extreme gradient boosting (XGBoost). We compared performance using area under the receiver operating characteristic curve (AUCs) and precision-recall curves. We determined recall at our goal precision of 0.30.
Results:
Of 21 052 included insulin orders, 1839 (9%) were followed by a hypoglycemic event within 24 hours. Logistic regression, random forest, and XGBoost models had AUCs of 0.81, 0.80, and 0.79, and recall of 0.44, 0.49, and 0.32, respectively. The most significant predictor was the lowest BG value in the 24 hours preceding the order. Predictors related to the insulin order being placed at the time of the prediction were useful to the model but less important than the patient’s history of BG values over time.
Conclusions:
Hypoglycemia within the next 24 hours can be predicted at the time an insulin order is placed, providing an opportunity to integrate decision support into the medication ordering process to make insulin therapy safer.
Introduction
Approximately, 40% of hospitalized patients have hyperglycemia, which is associated with increased mortality. 1 Thus, using insulin to control blood glucose (BG) levels for hospitalized patients is a mainstay of clinical care. 2 However, hypoglycemia, the most common complication of insulin therapy, 3 is potentially dangerous, with possible outcomes including cardiovascular events, seizure, coma, and death.4,5 For this reason, insulin therapy is on the Institute for Safe Medication Practices’ list of high-risk medications. 6
Interruptive or “pop-up” medication alerts have been a central strategy for preventing medication errors ever since awareness of errors increased in the 1990s and electronic health record (EHR) adoption became widespread. 7 However, such alerts are increasingly viewed as suboptimal, for several reasons. 8 First, most medication alerts are rule-based alerts that rely on tables, such as those pertaining to allergies, potential interactions between medications, or duplicative therapy. 9 They rarely incorporate patient-specific data, such as diagnoses, vitals, and laboratory values. Simple rule-based alerts suffer from low positive predictive values (PPVs). For example, one common type of medication alert warns clinicians of the risk of torsades de pointes, a dangerous heart rhythm, when ordering medications that prolong the QT interval. However, a real-world analysis, looking at how often propofol administration really leads to torsades de pointes found a very low incidence of 1.93 per million. 10 In our analysis, this would correspond to a PPV far below 0.01 for drug-drug interaction alerts warning of propofol’s potential additive effect on other QT-prolonging medications. 11
Second, interruptive medication alerts, by definition, must interrupt clinical workflows. Interruptions add to cognitive load and may lead to task shortening and even failure to return to the original task, raising patient safety concerns. 12
One consequence of showing clinicians a large volume of interruptive alerts with low PPVs is “alert fatigue,” where clinicians who are repeatedly shown warnings become less likely to pay attention to them. 13 This can contribute to users’ dissatisfaction with the EHR, which may increase clinician burnout. 14 Insulin dosing alerts are especially problematic because patients may have differing levels of tolerance/resistance to insulin. A dose of insulin that is insufficient for one patient could be lethal for another patient. Machine learning-based clinical decision support (CDS) offers a solution for higher PPVs and increased usefulness for clinicians.15-18
Over the past decade, technologies aimed at preventing iatrogenic hypoglycemia in the inpatient setting have been developed. Commercial solutions exist but require significant financial investment. 19 Groups have developed predictive models around hypoglycemia.20-30 These models have typically not been workflow-informed; some have predicted hypoglycemia within the entire admission, which may not be actionable by the clinician. Others predict hypoglycemia whenever there is a BG result of <70 mg/dL within 24 hours after ordering insulin, requiring an interruptive alert to notify the clinician. Few studies have predicted hypoglycemia at the time a medication order is placed.
Integrating CDS into the medication ordering process has a major advantage in that the clinician is already thinking about the patient and considering how much insulin to order. This means that the clinician does not need to be interrupted at a different time in her workflow when she is caring for a different patient, which could increase cognitive load. Furthermore, CDS developed around the ordering process can be displayed at the time of the order, within the ordering interface, which precludes the need for an interruptive alert. One recent study into the desired features and functionality of a hypoglycemia alert found that providers seek unobtrusive and accurate alerts communicated in real time to the ordering provider. 31
Thus, our objective for this study was to develop a predictive model for inpatient hypoglycemia, using a workflow-informed approach as a first critical step toward eventual deployment and evaluation of a CDS tool.
Methods
Study Site and Population
This study was conducted at Vanderbilt University Medical Center (VUMC), a large urban academic medical center in Nashville, Tennessee. The VUMC’s EHR, Epic, was implemented in November 2017 and includes a data warehouse, Clarity, which houses clinical data including medications and laboratory results (2021 Epic Systems Corporation). We included in our study population all patients aged 18 years or older who had orders placed during an inpatient admission between January 1, 2019 and December 31, 2019, after the first 24 hours of admission. We excluded patients in intensive care units or palliative care units. This study was approved by the VUMC institutional review board.
The Medication Ordering Safety System (MOSS)
MOSS is a platform we developed to facilitate the time-consuming process of generating predictive models for medication safety. 11 MOSS runs in the R programming language and consists of five modules: a cohort creation module, feature extraction module, data set creation module, model training module, and model evaluation module. MOSS functions automatically generate structured query language (SQL) code to retrieve data from Clarity and transform data into a format utilized by common machine learning packages. The cohort creation module creates an “event” data frame, which is a set of medication orders. Features are then extracted for this set of medication orders to build a predictive model around an outcome of interest.
Workflow Review
We reviewed the workflow for managing inpatient insulin dosing, which includes gathering patient information and reviewing results, placing an order for insulin, following up patient glucose results, and adjusting insulin as necessary. We determined that the time of placing an insulin order, rather than the time of a BG result, is an opportune moment in the workflow to display CDS as the provider is already focused on making the clinically pertinent decision (i.e., adjusting the relevant patient’s insulin regimen.)
Outcome
We defined insulin-induced hypoglycemia as a low BG (<70 mg/dL) within 24 hours after ordering insulin.
Features
We selected features based on previous hypoglycemia models and consideration of what data elements would be available for most patients. We also performed chart reviews of cases where patients had hypoglycemia, to identify candidate features. We initially considered over 80 features (supplemental material). Our features fell into the following categories: patient characteristics and measurements, vitals, diagnoses, laboratory values, medication orders and administrations, and diet orders. We calculated an insulin order score, which was the predicted total units of insulin administered per 24 hours based on all active insulin orders for a patient. We calculated this prior to and at the time of the new order to determine whether the new order corresponded to an increase, decrease, or no change in the total insulin to be administered. For insulin orders that included a range of glucose, we input both the minimum and maximum of the range as features in the model.
Missing Data
Medication orders with missing data were excluded, using case-wise deletion, as preliminary data showed that these missing data were primarily BG measurements. We determined that any future CDS predicting hypoglycemia was unlikely to be useful in patients for whom BG data were not available.
Model Development and Evaluation
We used logistic regression to rank and select predictors. We randomly split data at the patient level into a training set (80%) and test set (20%). Models were trained with the training set and tested both on the training set and the test set. We performed a tenfold cross-validation within the training set. We compared the performance of logistic regression, random forest, and extreme gradient boosting (XGBoost). We initially also included k-nearest neighbor algorithms, but during preliminary analyses found its performance to be inferior to the others for this task. For each model, we determined the area under the receiver operating characteristic curve (AUC). We also graphed precision-recall curves and determined the sensitivity (recall) for a PPV (precision) of approximately 0.30 based on our institution’s CDS target of above 0.30 for acceptance rate. We determined the top 10 most significant predictors, ranked by the absolute value of the z score.
Results
A flow diagram is presented in Figure 1. There were 36 214 subcutaneous insulin orders placed for adult patients hospitalized at VUMC in 2019. After excluding orders were placed for patients in intensive and palliative care units, and those with missing data, we included 21 052 orders for model training and testing. Selected characteristics for patients at the time of the insulin order are listed in Table 1.
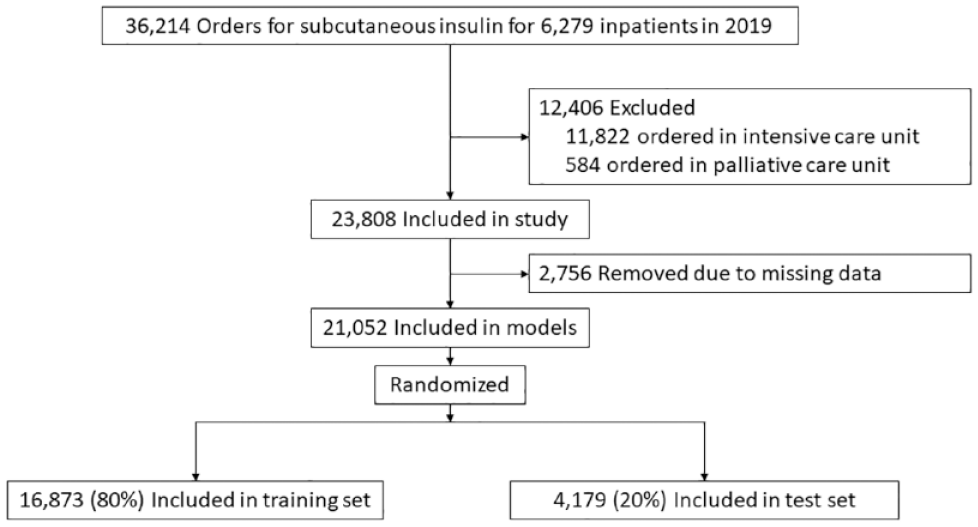
Study flowchart.
Cohort Characteristics.
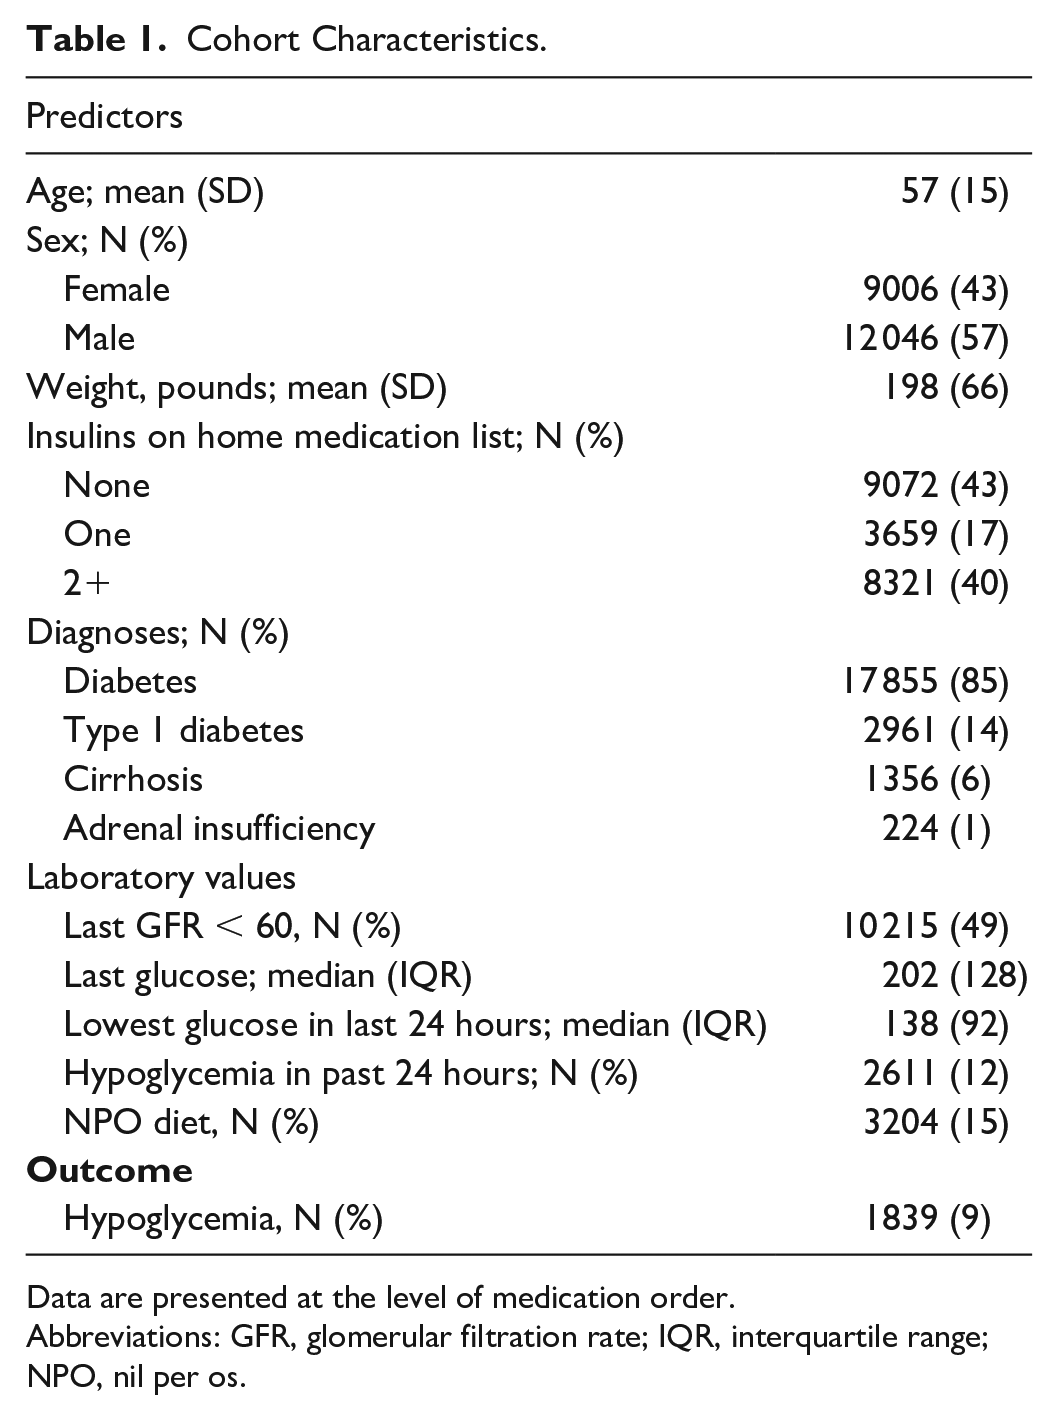
Data are presented at the level of medication order.
Abbreviations: GFR, glomerular filtration rate; IQR, interquartile range; NPO, nil per os.
Of 21 052 orders placed for subcutaneous insulin, 12 046 (57%) were placed for male patients, 17 855 (85%) were placed for patients with diabetes, 2611 (12%) had been preceded by a hypoglycemic event in the past 24 hours, and 1839 (9%) were followed by a hypoglycemic event in the next 24 hours.
Model Performance
The performance for the logistic regression, random forest, and XGBoost models on the test set is shown in Figures 2 and 3 and in Table 2. All three models had similar AUCs.
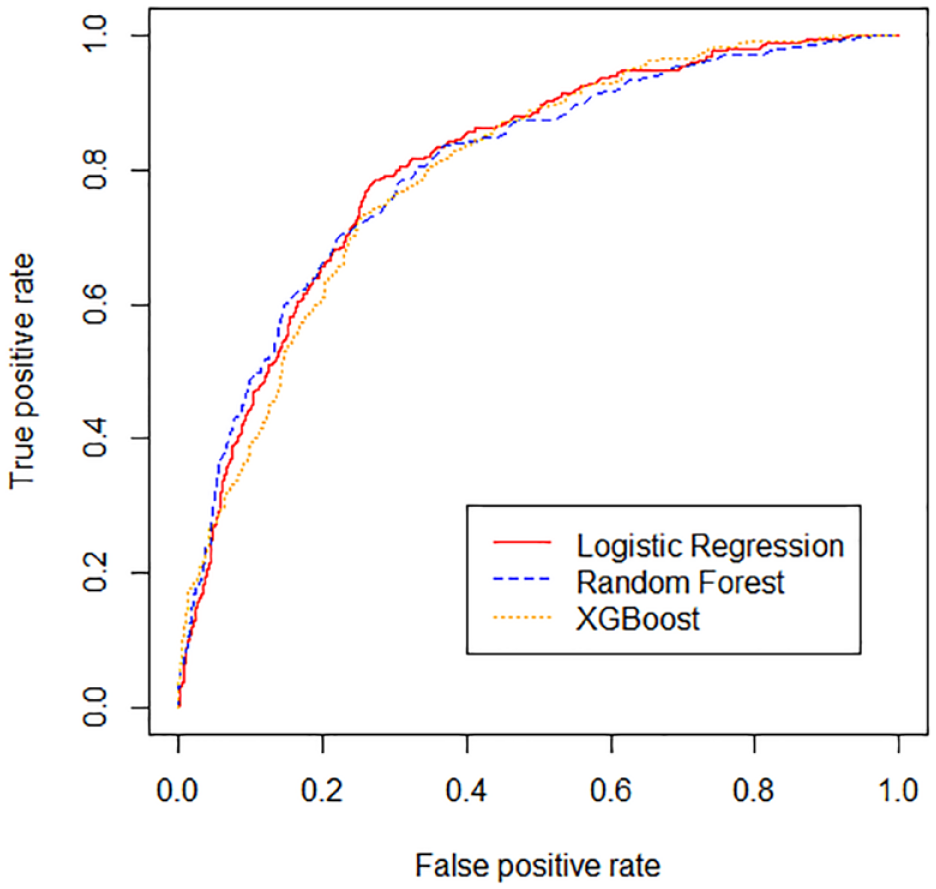
Receiver operating characteristic (ROC) curves are shown for the logistic regression, random forest, and extreme gradient boosting (XGBoost) models.
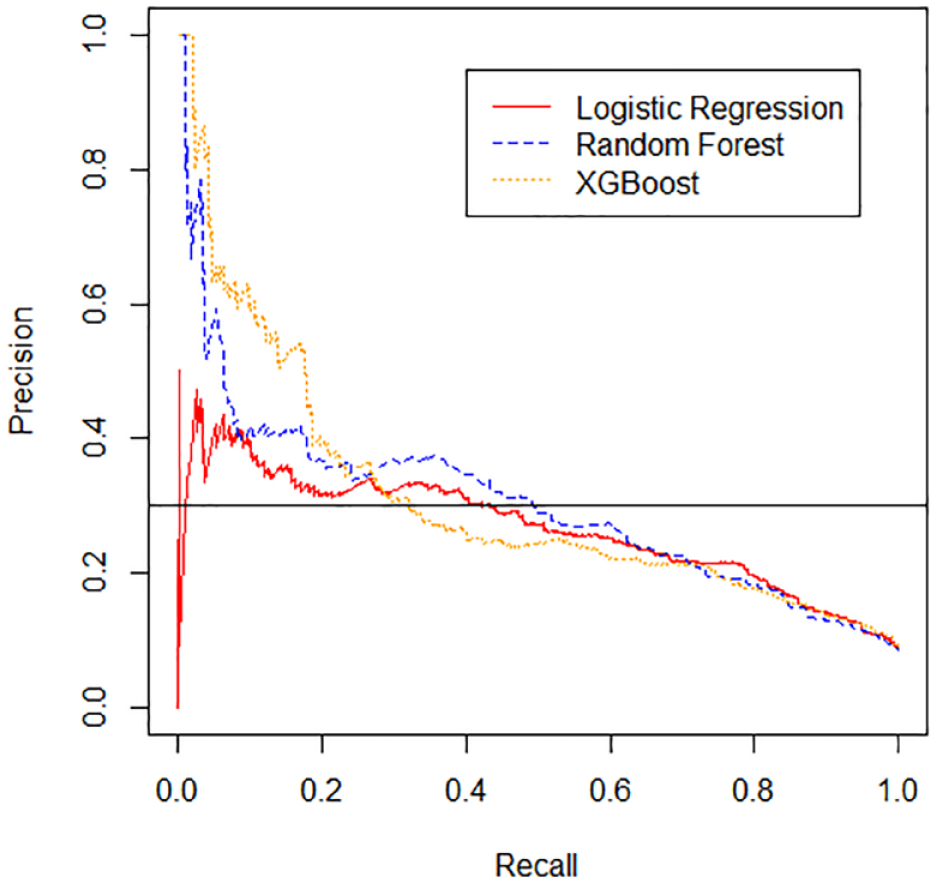
Precision-recall (P-R) curves are shown for the logistic regression, random forest, and extreme gradient boosting (XGBoost) models. Horizontal black line represents precision goal of 0.3.
Model Performance on Test Set.
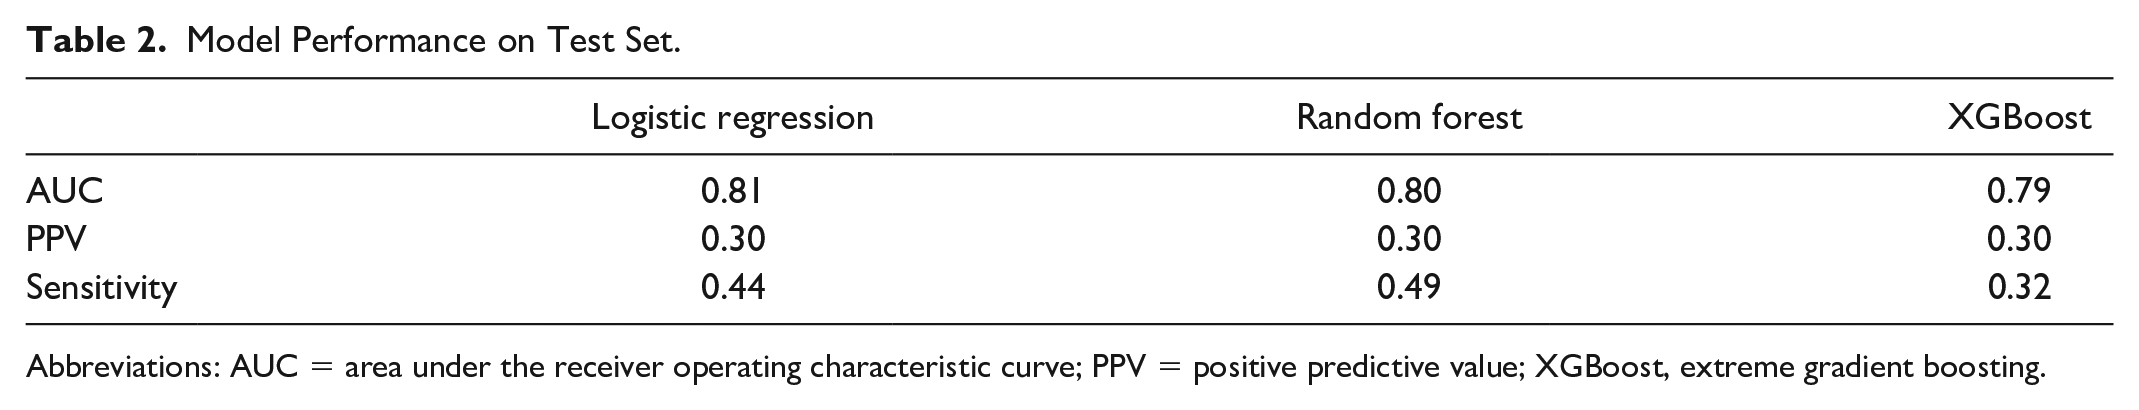
Abbreviations: AUC = area under the receiver operating characteristic curve; PPV = positive predictive value; XGBoost, extreme gradient boosting.
Precision-recall curves are shown in Figure 3. At a PPV of 0.30, the random forest model had the highest sensitivity, 0.49, logistic regression had the second highest sensitivity, 0.44, and XGBoost had the lowest sensitivity, 0.32.
Our final model included 56 features (supplemental material). Important predictors for the random forest model are shown in Figure 4. The most significant predictors were the lowest and average BG value within the 24 hours preceding the insulin order, the last BG, and the coefficient of variation of BG since admission and in the past 24 hours. Predictors relating to the insulin order being placed at the time of the prediction, such as the dose of the insulin order, were helpful to the models, but less helpful than predictors relating to the patient’s history of BG values.
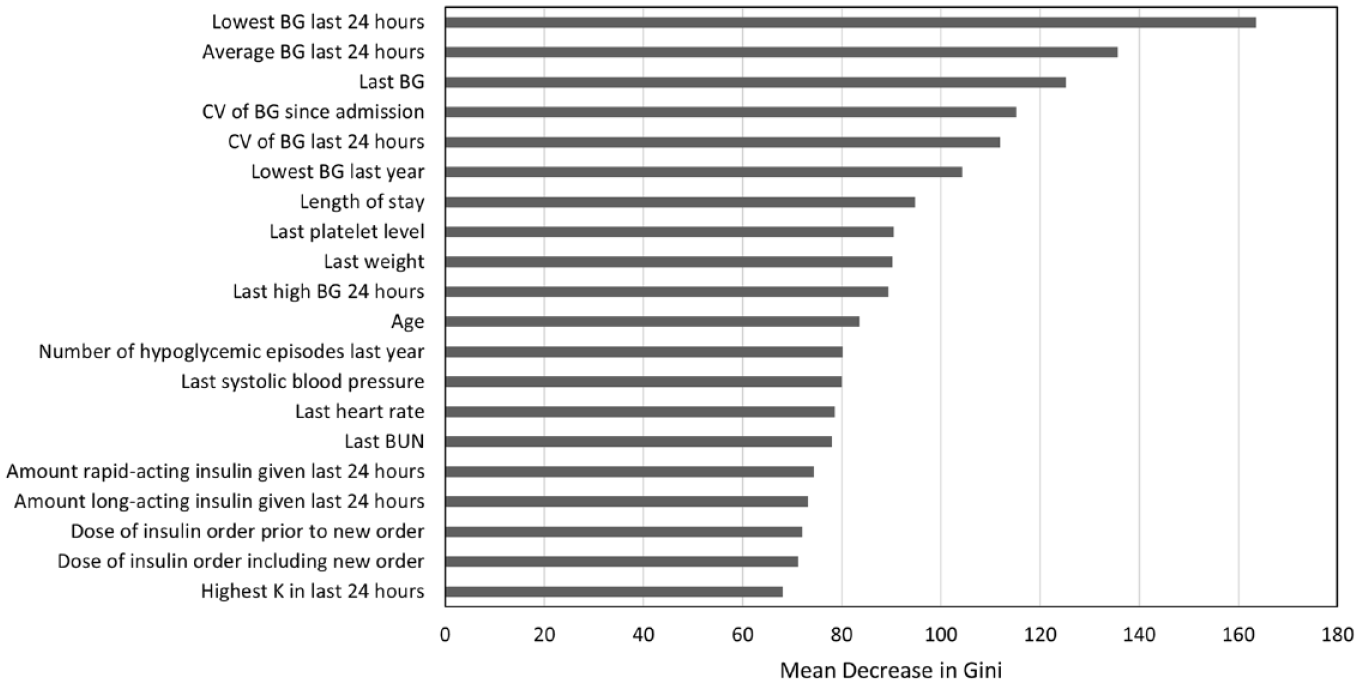
Importance of Top 20 features for random forest. Features for the random forest model are ranked by the mean decrease in Gini, which is a measure of variable importance. Abbreviations: BG, blood glucose; BUN, blood urea nitrogen; CV, coefficient of variation; K, potassium.
Discussion
Adding support to previously published studies, our results demonstrate that hypoglycemia is an adverse outcome of insulin therapy, which can be predicted using statistical and machine learning algorithms. In contrast to other studies that have predicted hypoglycemia within the entire admission, or within a certain time frame after a glucose level results, we have framed the prediction problem around the insulin order. Good CDS must fit into the user’s workflow 32 because the utility and effectiveness of predictive models is not simply related to their performance as measured by AUCs, but also relies on how they are deployed. A key strength of our model is its close alignment to workflow. In developing an alert centered around the ordering process, we found that details of the order being placed, such as the dose of the insulin order, were useful for predicting hypoglycemia in the 24 hours following the order (Figure 4). Most of the existing CDS in modern EHRs is rule-based, such as alerts pertaining to allergies or potential interactions between medications. Our results emphasize the potential value of using machine learning–based CDS, which incorporates patient-specific factors.
We found that our logistic regression, random forest, and XGBoost models all had similar AUCs. This is in contrast to other machine learning prediction models in the inpatient setting, which have shown that gradient boosting algorithms have outperformed logistic regression.25,26 Random forest and gradient boosting algorithms have an advantage over logistic regression in their capacity to handle nonlinear interactions in the data. However, gradient boosting can be more prone to overfitting. 33 We surmise that for our particular use case, where hypoglycemia can largely be predicted by prior glucose data, linear combinations achieved through logistic regression were sufficient. The additional capture of nonlinear dimensions to the data provided by gradient boosting may not have been significant enough to outweigh overfitting.
The AUCs of our models are in the range of previously published models. The first published models that used logistic regression to predict hypoglycemia reported AUCs ranging from 0.71 to 0.77.23-25 The AUCs improved as groups trialed newer machine learning algorithms, with AUCS ranging from 0.80 to 0.96.25,27 However, these models predicted hypoglycemia within the entire admission, which is less clinically actionable than models predicting hypoglycemia within a shorter prediction horizon, such as the next 24 hours. Recently, Mathioudakis et al. 26 expanded to using 43 clinical predictors and achieved an AUC up to 0.88, using stochastic gradient boosting. However, PPVs remained low at a range of 0.12 to 0.13. The generation of hypoglycemia models has far outpaced their implementation, representing a gap between innovative machine learning methods and the technologies implemented in the EHR. Increasing the PPV of model predictions is critical to developing predictive models that are accepted into clinical practice as users may already be suffering “alert fatigue” from frequent interruptive alerts with low PPV. 31 We targeted a PPV of 0.30 as our goal acceptance rate for CDS is 0.30. Interestingly, while ROC curves were similar among the three models we compared (Figure 2), precision-recall curves varied considerably (Figure 3), demonstrating the importance of looking beyond simple AUCs when deciding which predictive models to use for building CDS.
We identified random forest as having an optimal combination of precision and recall for our use case. However, the performance advantage of random forest over logistic regression must be balanced with the speed and interpretability of logistic regression when deciding which model to implement as CDS. Logistic regression has the benefit of being interpretable, as opposed to random forest and XGBoost that are “black box” methods. Miller and Masarie 34 write that the most important intellect brought to any CDS system is that of the clinician. Medication alerts that provide useful information to the clinician, such as by displaying patient characteristics that increase risk, will make the best use of the clinician’s valuable intellect.
Other groups have found the most important predictors for their hypoglycemia models to be related to glycemic measures. The results of our random forest model reinforce these findings (Figure 4). In particular, our top three predictors (lowest 24 hour BG, average 24 hour BG, and last BG) were also the top three variables reported by Zale et al. 28 In contrast, the amount of long-acting insulin given in the past 24 hours was the most important feature for our logistic regression hypoglycemia model (supplemental material). This result is consistent with the top predictor reported by Mathioudakis et al. 26 Patients receiving larger amounts of long-acting insulin may be at greater risk of hypoglycemia in the event of reduced intake, such as can happen when patients become NPO for procedures. Regarding other variables previously reported to be important, such as length of stay, weight, systolic blood pressure, and heart rate, our results confirm these as important variables, although importance level varied. We identified the last platelet level as an important feature in our model, which has not been identified in previous models. We suspect low platelet level may be serving as a proxy for hepatic dysfunction, which puts patients at risk for hypoglycemia.
Our study has a number of strengths, including the close alignment to workflow, comparison of multiple model types, the large number of features considered, and the size of the study; however, we are limited by validation at a single institution. In addition, while the PPV of our models may be 0.30, actual alert acceptance may differ from this rate, depending on clinician interpretation of the alert.
For our next steps, we aim to further improve our model by incorporating additional features. As patients who become NPO may be at particular risk of hypoglycemia, we plan to further incorporate features related to NPO status, such as variance in patient NPO status, BG status at initiation of NPO orders, and reason for NPO status into our model. In addition, we aim to deploy natural language processing to mine features from unstructured EHR data such as notes. We also aim to deploy this model through a CDS intervention study to evaluate its ability to improve safety around insulin prescribing.
Conclusions
We found that random forest, logistic regression, and XGBoost had similar performance for predicting hypoglycemia in the 24 hours following placement of an insulin order. We identified random forest as having an optimal combination of precision and recall for this prediction task. Predictors related to the insulin order being placed at the time of the prediction were useful to the model but less important than the patient’s history of BG values over time. Hypoglycemia within the next 24 hours can be predicted at the time an insulin order is placed, providing an opportunity to integrate decision support into the medication ordering process.
Supplemental Material
sj-docx-1-dst-10.1177_19322968221119788 – Supplemental material for Development and Validation of Inpatient Hypoglycemia Models Centered Around the Insulin Ordering Process
Supplemental material, sj-docx-1-dst-10.1177_19322968221119788 for Development and Validation of Inpatient Hypoglycemia Models Centered Around the Insulin Ordering Process by Aileen P. Wright, Peter J. Embi, Scott D. Nelson, Joshua C. Smith, Alexander Turchin and Dara E. Mize in Journal of Diabetes Science and Technology
Footnotes
Abbreviations
AUC, area under the receiver operating characteristic curve; BG, blood glucose; BUN, blood urea nitrogen; CDS, clinical decision support; CV, coefficient of variation; EHR, electronic health record; GFR, glomerular filtration rate; ICU, intensive care unit; IQR, interquartile range; K, potassium; MOSS, Medication Ordering Safety System; PPV, positive predictive value; ROC, receiver operating characteristic; SQL, structured query language; VUMC, Vanderbilt University Medical Center; XGBoost, extreme gradient boosting.
Declaration of Conflicting Interests
The author(s) declared no potential conflicts of interest with respect to the research, authorship, and/or publication of this article.
Funding
The author(s) disclosed receipt of the following financial support for the research, authorship, and/or publication of this article: This study was supported by the National Library of Medicine of the National Institutes of Health under award number T15LM007450 (APW).
Supplemental Material
Supplemental material for this article is available online.
References
Supplementary Material
Please find the following supplemental material available below.
For Open Access articles published under a Creative Commons License, all supplemental material carries the same license as the article it is associated with.
For non-Open Access articles published, all supplemental material carries a non-exclusive license, and permission requests for re-use of supplemental material or any part of supplemental material shall be sent directly to the copyright owner as specified in the copyright notice associated with the article.