
Abstract
Objective:
The objective was to identify root causes of hypoglycemia on medicine inpatient units using an automated tool. Data collected will guide educational interventions aimed at improving patient care and safety by decreasing rates of hypoglycemia.
Methods:
A survey was conducted among RNs to identify risk factors for hypoglycemia. Survey data were used to create a hypoglycemia root cause survey tool in the EMR. RNs were prompted to utilize the tool when blood glucose (BG) < 70 mg/dL. Once the most common modifiable cause of hypoglycemia was identified, an educational intervention for safe and effective use of insulin was launched. This strategy was designed to empower the care team to reduce the insulin dose when appropriate to prevent future hypoglycemic episodes.
Results:
BG data were compared from March and April in 2016 and 2017. Rates of hypoglycemia (BG < 70 mg/dL) decreased from 2.3% to 1.5%; BG values in target range (70-180 mg/dL) increased from 59.4% to 65.7%; hyperglycemia (BG > 180 mg/dL) decreased from 38.3% to 32.8% (all P values < .001). The number of patients with recurrent hypoglycemia (3 or more episodes) decreased from 5.7% to 2.2% (P = .044).
Conclusions:
The two most frequent modifiable causes of hypoglycemia (insulin and nutrition) were identified by an RN survey and confirmed by chart review. A targeted educational intervention addressing safe and effective insulin dosing resulted in a significant decrease in both hypoglycemia and recurrent hypoglycemia. This was associated with an improvement in overall glycemic control. Ongoing clinician education regarding insulin and nutrition accompanied by discussions between RNs and prescribers to address hypoglycemic events in real-time could continue to lower the rate of occurrence.
Adverse drug events (ADEs) are the most common cause of inpatient complications, affecting 1.9 million stays each year at a cost of $4.2 billion per year.1-3 These events are responsible for one-third of hospital acquired conditions and prolong hospital stays by 1.7 to 4.6 days. 4 Insulin and other antihyperglycemic agents account for more than half of ADEs. 5 More than 10% of patients on an antihyperglycemic agent suffer at least one hypoglycemic ADE during each hospitalization. 6 It is estimated that 50% of hypoglycemic events (<70 mg/dL) and 50-80% of severe hypoglycemic events (<40 mg/dL) are preventable. 7 Fear of hypoglycemia is a key limiting factor in achieving glycemic targets in the inpatient setting.8,9
In an analysis of iatrogenic hypoglycemia in an academic medical center in California, the most powerful predictor for an inpatient to experience a hypoglycemic event was a prior hypoglycemic event during the same hospital stay. 10 This increased risk of hypoglycemia in patients who have already had a hypoglycemic episode has been confirmed in other studies. 11 University of California, San Diego (UCSD) has successfully implemented a hypoglycemia reduction program that identified key risk factors for hypoglycemia in hospitalized patients. These risk factors were unexpected interruptions in nutrition, prior hypoglycemia during the hospital stay and lack of coordinated timing of nutrition and insulin administration. They also found that adherence to hypoglycemia management protocols and documentation of these events was poor. Strategies to improve adoption of hypoglycemia treatment protocols and proactive management of patients with key hypoglycemia risk factors were shown to reduce rates of both hypoglycemia and recurrent hypoglycemia. 12
The regulatory agency Centers for Medicare and Medicaid Services (CMS) has designated inpatient glycemic control as an important metric for patient safety. CMS recommends tracking rates of both hypo- and hyperglycemia to monitor progress over time. 13 Protocols that address and employ strategies to decrease rates of hypoglycemia is a critical component of glycemic initiatives in the inpatient setting. 14 Point of care laboratory blood glucose (BG) data can be collected and analyzed to compare rates of “malglycemia” defined as hyperglycemia, hypoglycemia, or increased glycemic variability among various inpatient units. (eg. surgery versus medicine units). 15
The primary aim of this study was to improve patient safety and quality of care by identifying root causes of hypoglycemia in an inpatient medicine population in an academic medical center using an automated electronic tool in the electronic medical record (EMR). This is a novel approach as prior studies investigating hypoglycemia have been done using chart reviews. Our secondary aim was to initiate active surveillance by incorporating a rapid real-time assessment of hypoglycemic events. This active surveillance was augmented with both triage tools and a targeted educational intervention based on what was identified as the top cause of hypoglycemia. Our third aim was to reduce rates of both hypoglycemia and recurrent hypoglycemia by improving situational awareness and communication among care team members. We utilized the model for quality improvement methodology of multiple Plan-Do-Study-Act (PDSA) cycles to pursue these aims (Figure 1).
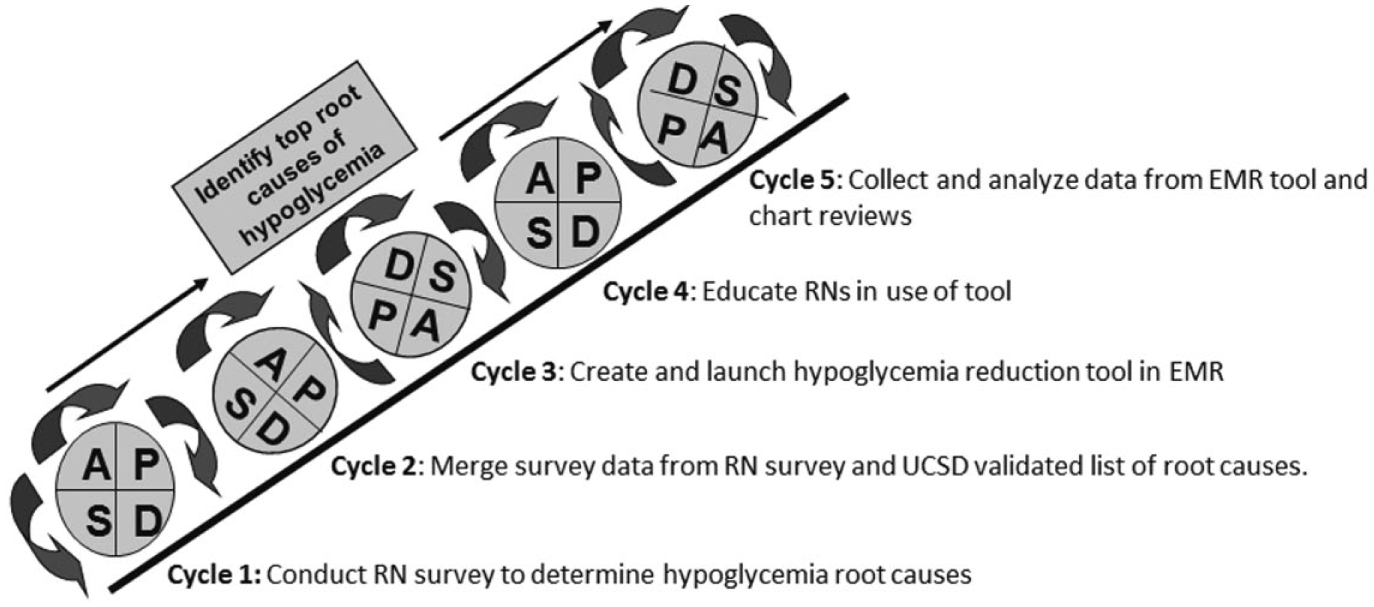
Plan-Do-Study-Act (PDSA) of steps to identify top root causes of hypoglycemia.
Methods
The study design was a quasi-experimental pre-post intervention study. The study population consisted of two inpatient general medicine units in an academic medical center. The rates of hypoglycemia and recurrent hypoglycemia were compared over the same two-month period in 2016 and 2017.
Development of Tool
In the fall of 2016, we conducted surveys with RNs from two medicine units to learn what they considered to be the top causes of inpatient hypoglycemia and to engage them in the project. The survey consisted of two parts. In part one, the RNs were asked to generate a list of reasons why patients may become hypoglycemic in the hospital. In part two, they were asked to review a list of possible causes of hypoglycemia from the UCSD study. 10 If the RN agreed with any UCSD reasons that they had not previously included in their own list, they were instructed to mark those as well. The most common causes identified by the RNs in the merged survey data were: incorrect dose of insulin (25.2%), poor nutrition (20.7%), NPO for procedure (14.4%). The “other” category (28.8%) was comprised of responses that occurred at a very low frequency (Figure 2).
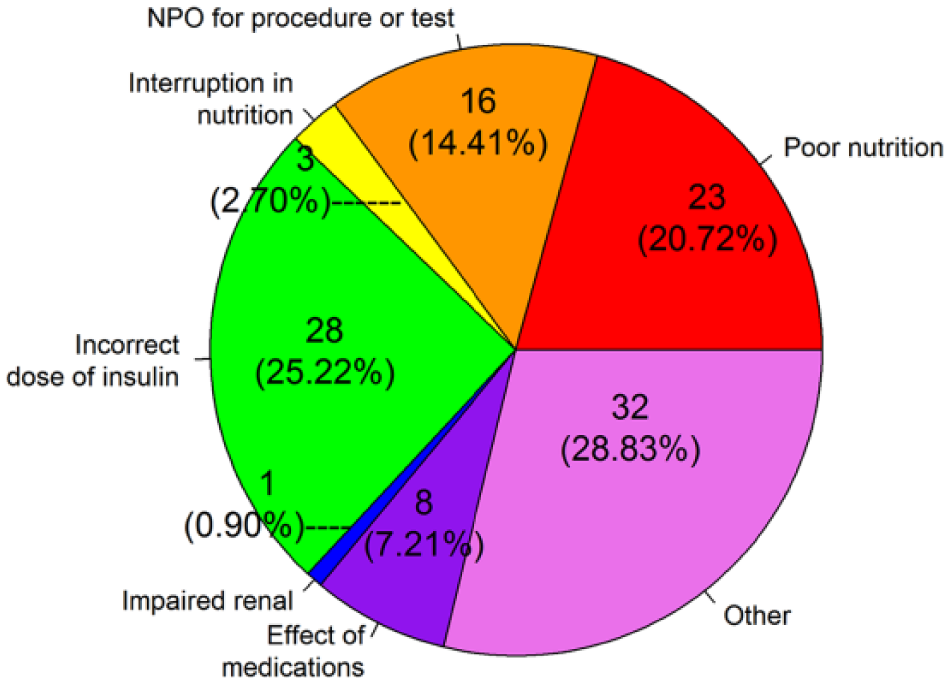
Causes of hypoglycemia identified in RN survey.
This complete list of potential causes from the merged survey data were used to create a novel hypoglycemia root cause survey tool (Figure 3). Our survey tool was built with Microsoft C#, and designed to integrate with Allscripts Sunrise Clinical Manager using their ObjectsPlus application programming interface. Each time pilot users logged into Sunrise Clinical Manager, a medical logic module (MLM) checked for recent hypoglycemic events among the users’ patients. If any events met our threshold for hypoglycemia (BG < 70 mg/dL), the MLM launched the survey tool. The nurses were instructed to complete the tool by selecting the causes of hypoglycemia that may have contributed to their patient’s hypoglycemic episode. The study was approved by the institutional review board at Weill Cornell Medicine with a waiver of consent.
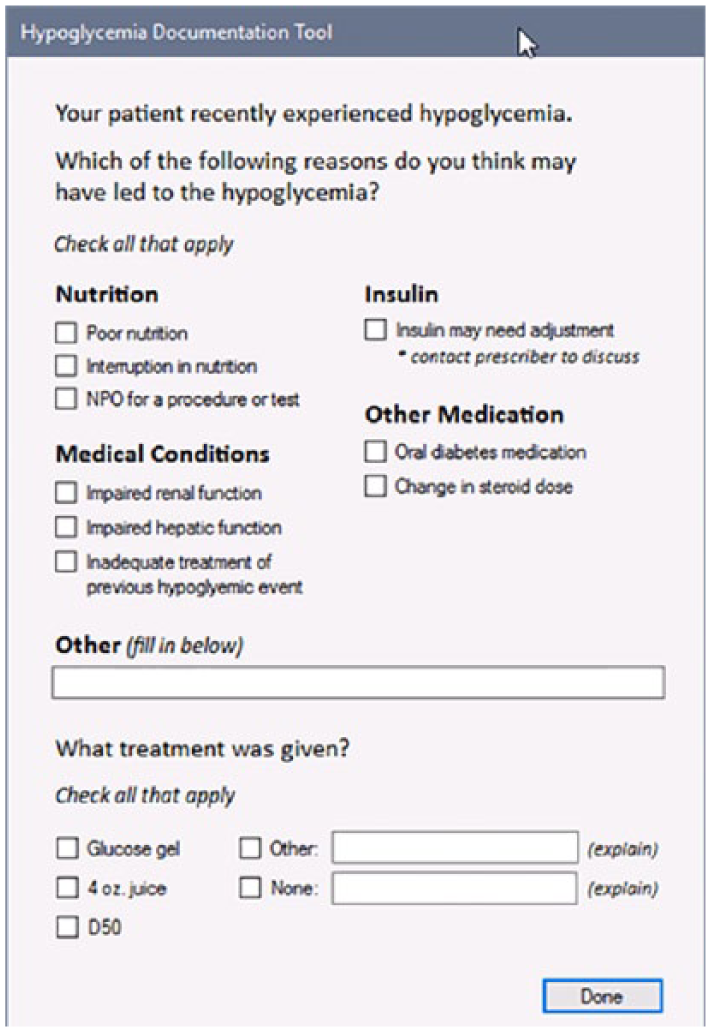
Hypoglycemia documentation tool in Electronic Medical Record (EMR).
Data Collection
Two months after the launch of the hypoglycemia root cause tool in the EMR, the RN responses were reviewed and categorized (Figure 4a). During this same time period, two second-year endocrinology fellows conducted a retrospective chart review of all patients experiencing hypoglycemic events on the two study units (Figure 4b). The data from the hypoglycemia root cause tool and chart reviews were compared. In both cases, the top two modifiable causes were related to insulin and alterations in nutrition.
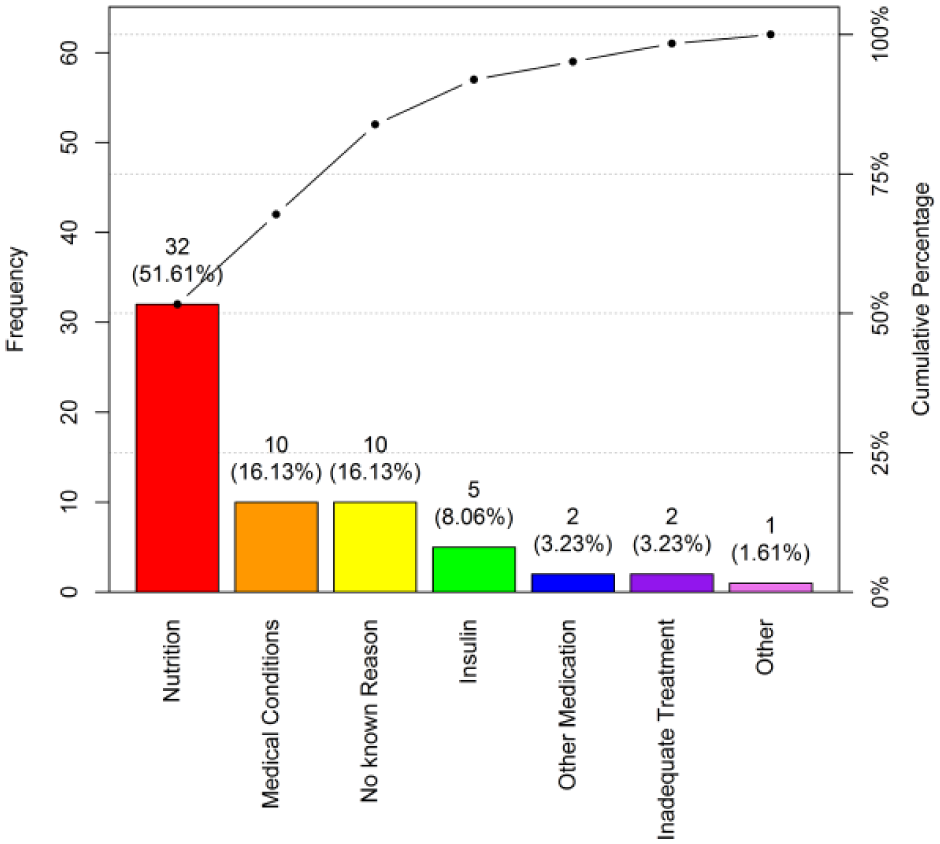
Pareto chart for RN hypoglycemia EMR survey results.
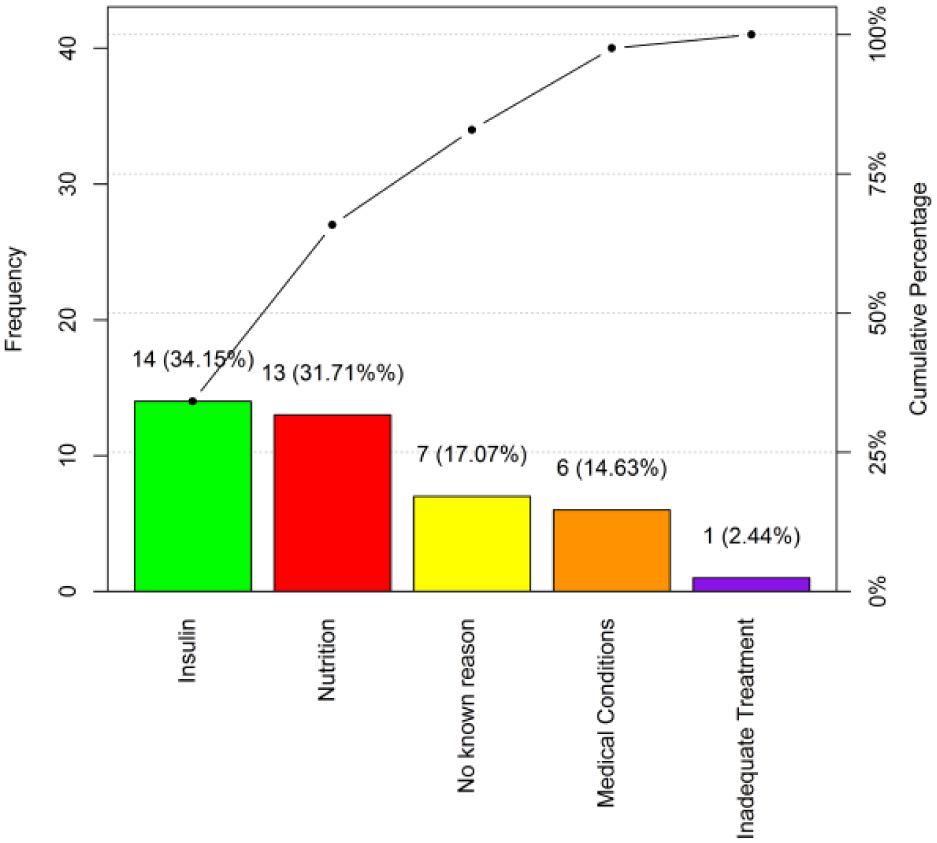
Pareto chart for MD chart review results.
Although the nurses chose nutrition more often than insulin as the root cause, chart reviews by physicians pointed to insulin as the primary cause. We believe this reflects not only the interconnected relationship between nutrition and insulin therapy as well as the difference in perception between disciplines. The nurses are actively involved in the BG monitoring, insulin administration and observation and tracking of nutritional intake whereas the physicians are solely responsible for the insulin dosing. This highlights the importance of communication across disciplines so that the physicians are well aware of the patients’ nutritional status when making dose adjustments.
Of note, all episodes of hypoglycemia were iatrogenic or induced by insulin or oral agents. There were no hypoglycemic events that were attributable to other known causes of hypoglycemia, ie. malnutrition, cachexia, liver or renal disease.
Unlike the UCSD study, we limited our data collection to real time hypoglycemic events. There were two reasons why we did this. The first was to ascertain that the nurse completing the EMR tool was indeed present at the time of the hypoglycemic event so that they could give an authentic opinion of the root cause. The second was to ensure the EMR survey tool would not pop up so frequently that users developed ‘alert fatigue’ and stopped taking the time to complete the survey in a thoughtful manner.
Educational Intervention-Nurses, Physicians, Physician Assistants
Data extracted from the MD Chart Reviews and the RN Hypoglycemia EMR Survey Tools revealed “insulin” and “alterations in nutrition” as the top two modifiable causes. The “insulin” category included lack of dose adjustments when the BG was trending downward. This was particularly evident as many episodes of hypoglycemia occurred when the BG the previous morning was < 100 mg/dL and the basal insulin dose was not reduced.
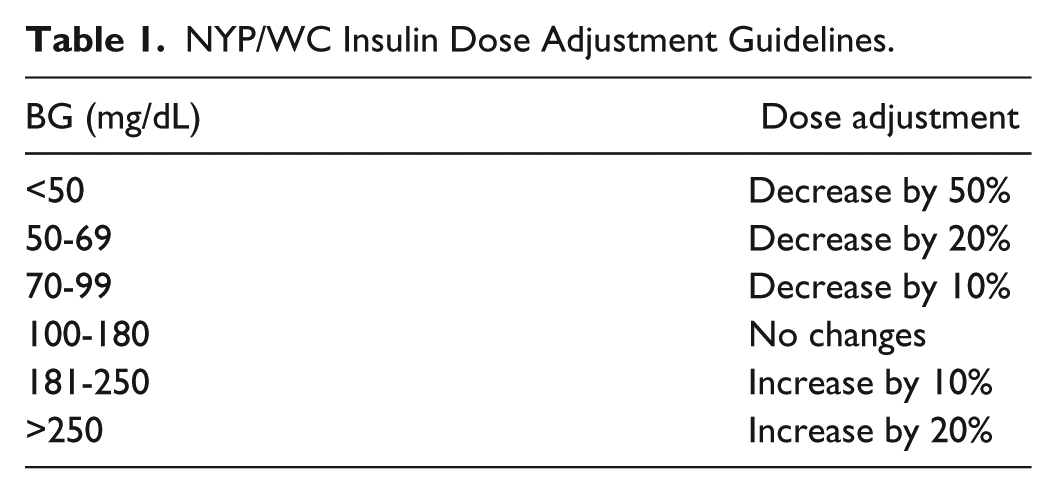
Insulin was chosen as the first targeted educational intervention to reduce rates of hypoglycemia on the medicine units. This decision was made as insulin is a major contributor to adverse drug events and promoting insulin safety may facilitate improved inpatient glycemic management. A brief educational intervention was developed titled “Reducing Hypoglycemia by Targeting a Root Cause: Too Much Basal Insulin.” This 10-minute PowerPoint presentation was presented to RNs, physicians, and physician assistants on the units using a one-page handout that outlined the main points. Content included information on insulin action and a dose adjustment algorithm to titrate insulin based on glycemic patterns (Table 1).
NYP/WC Insulin Dose Adjustment Guidelines.
Measures
The BG levels were measured via Accu-Chek Inform II system (Roche Diagnostics, Basel, Switzerland). The BG values were automatically downloaded in real time using wireless technology and became visible in the Data Visualization (DataVis) tab of the EMR. This DataVis glycemic control dashboard is a New York-Presbyterian built tool that consists of all the point-of care BG values populated into 4 time buckets representing meals and overnight time periods with the corresponding doses of insulin given during that time period. This allows the clinical ease of interpretation of BG values in relation to insulin usage by time of day and facilitates insulin dose adjustments. BG data were compared before and after the intervention on two medicine units (March and April in 2016 and 2017). Glucometrics were performed by analyzing BGs from the unit population then determining population rates of hypoglycemia and individual patient stay rates for recurrent hypoglycemia. These results were compared between the two time periods in 2016 and 2017.
Statistical Analysis
Analysis of demographics on both units during the same two months in 2016 and 2017 revealed no significant differences between the two groups (Table 2).
Patient Demographics.
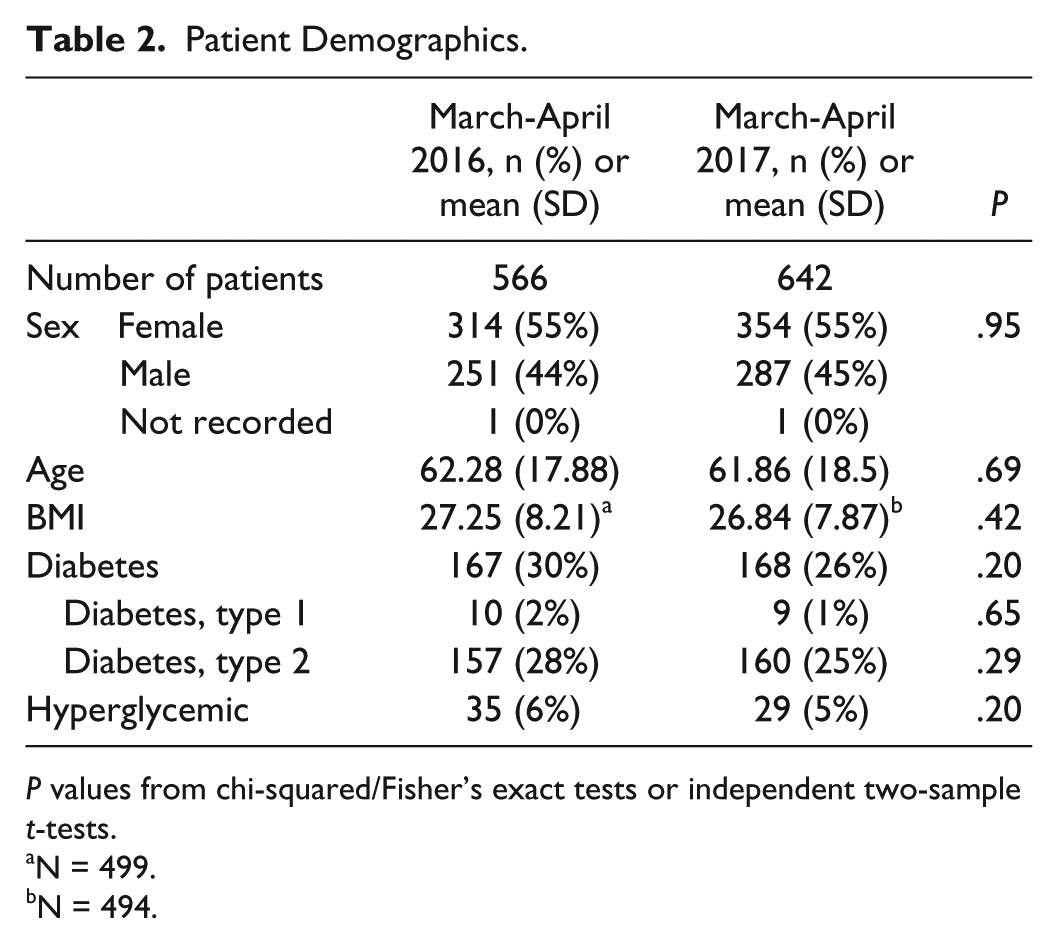
P values from chi-squared/Fisher’s exact tests or independent two-sample t-tests.
N = 499.
N = 494.
Items identified as root causes for hypoglycemia by the nurses in the initial survey were described as both frequency and percentage of responses to each perceived cause. Similarly, items recorded by the nurses in the hypoglycemia tool in the EMR were compared to causes identified by physician retrospective chart review. Pre- and postintervention glycemic values (categorized as 0-69, 70-180, and >180 mg/dL) were reported as n (%), with % representing percentage of the total number of glycemic events recorded. Similarly, pre- and postintervention recurrent hypoglycemic events (defined as 3 or more hypoglycemic events) were reported as n (%), with % representing percentage of the total number of admissions. Glycemic numbers as well as recurrent hypoglycemic events were compared pre- and postintervention by chi-square/Fisher’s exact tests. All P values were two-sided with statistical significant evaluated at the .05 alpha level. Analyses were performed in R version 3.4.1 (Vienna, Austria).
Results
The rates of hypoglycemia and recurrent hypoglycemia were compared between the two study periods. Rates of hypoglycemia (BG < 70 mg/dL) decreased from 2.3% to 1.5%; BG values in the target range (70-180 mg/dL) increased from 59.4% to 65.7%; and hyperglycemia (BG > 180 mg/dL) decreased from 38.3% to 32.8% (all P values < .001) (Figure 5a). In addition, the number of patients with recurrent hypoglycemia (3 or more episodes during the hospital stay) decreased from 5.7% to 2.2% (P = .044) (Figure 5b).
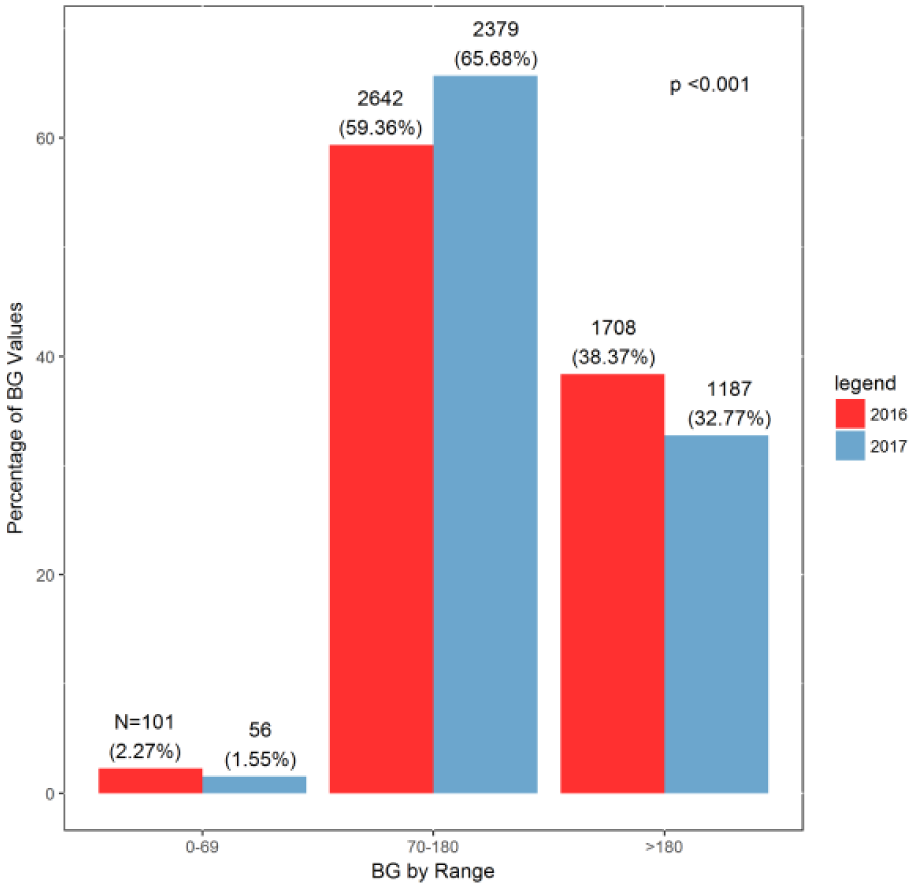
Blood glucose (BG) values March-April 2016 and March-April 2017.
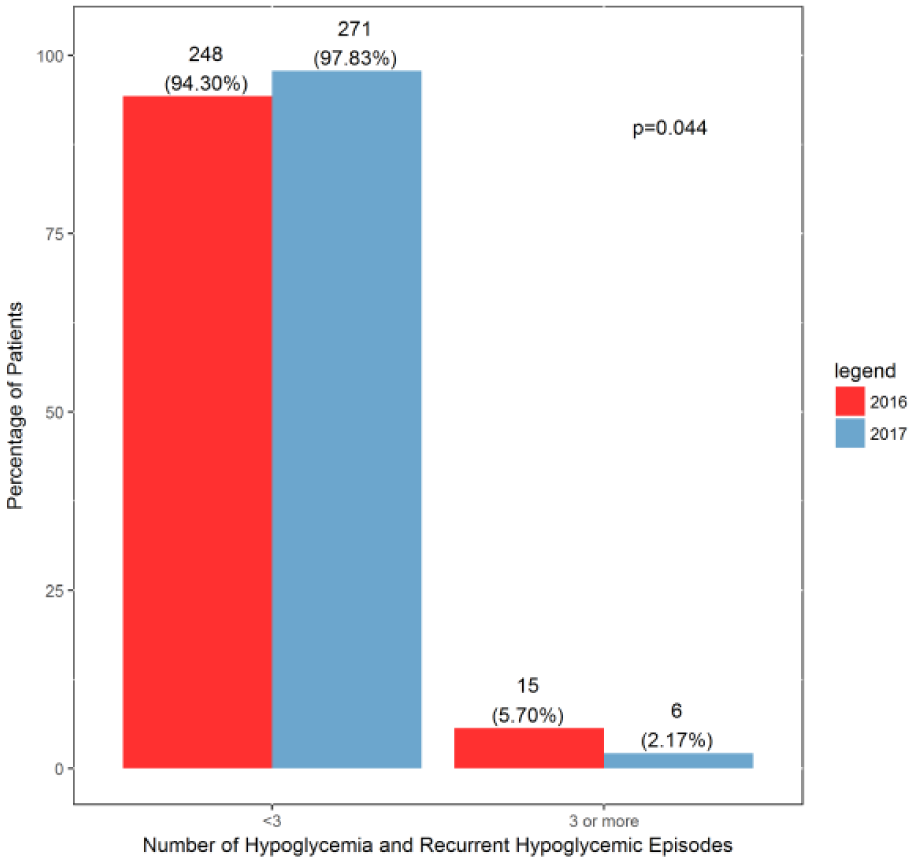
Frequency of hypoglycemic and recurrent hypoglycemic patients March-April 2016 and March-April 2017.
Discussion and Conclusion
Nutrition and insulin were identified as the top two modifiable causes of hypoglycemia by the RN survey and confirmed by the physician chart review. A targeted educational intervention addressing safe and effective insulin dosing resulted in a significant decrease in both hypoglycemia and recurrent hypoglycemia. In our prior studies, significant reductions in hypoglycemia had been associated with an increase in hyperglycemia. Of note, not only did the decrease in hypoglycemia observed in the current study not result in increased rates of hyperglycemia, in fact the number of patients in target BG range improved. A limitation of our study was the pre-post intervention study design with no control group. Our study cohort consisted of medicine patients, therefore generalizing our results to other patient populations such as surgical patients is limited.
Identifying the causes of hypoglycemia in real-time using an automated tool in the EMR fostered timely communication with the care team to make treatment changes to reduce the likelihood of future hypoglycemia. Nurses were empowered in their new role of glycemic control agents and became proactive in reporting events to the care team and obtaining insulin adjustment orders when needed. The previous study at UCSD that guided our current study differed in design by using a paper survey. It was our belief that an automated tool would simplify the nurse’s task and be both feasible and sustainable. Incorporating a tool to improve glycemic control into the nurse’s workflow increases the chance of success. Further considerations should be made to expand nursing involvement in inpatient glycemic control initiatives using such tools. Of note, the UCSD group has since built a nursing hypoglycemia documentation flowsheet into the EPIC EMR. Although the flowsheet is electronic, their active surveillance continues to be documented on paper using a hypoglycemia report form. 16
Future goals include house-wide nursing and prescriber education to heighten awareness of root causes of hypoglycemia to inform and promote prevention strategies. Another goal is to stimulate discussion between RNs and prescribers to address each hypoglycemic event in real-time and seek remedies to prevent future events. Finally, we plan to launch a new educational intervention targeting interruptions in nutrition that was found to be the second most common cause of hypoglycemia and will include recommendations for insulin adjustments in the education plan.
Footnotes
Acknowledgements
We would like to thank Dr Jennifer I. Lee for her continued mentorship.
Abbreviations
ADE, adverse drug event; BG, blood glucose; CMS, Centers for Medicare and Medicaid Services; DataVis, Data Visualization; EMR, electronic medical record; MLM, medical logic module; PDSA, Plan-Do-Study-Act; UCSD, University of California, San Diego.
Declaration of Conflicting Interests
The author(s) declared no potential conflicts of interest with respect to the research, authorship, and/or publication of this article.
Funding
The author(s) disclosed receipt of the following financial support for the research, authorship, and/or publication of this article: This study was supported by the Department of Medicine at Weill Cornell Medicine through the support of the Quality University.