
Abstract
Aims:
This study examined the psychosocial impact of Loop, an open-source automated insulin dosing system that has emerged from the diabetes technology “Do-It-Yourself” (DIY) movement.
Methods:
Subsamples of 239 adults, 115 children, and 243 parents completed data collection at the time of Loop initiation and 3 and 6 months later. Surveys collected demographic and clinical information, percent time-in-range, HbA1c, and validated psychosocial measures. Analyses included paired t tests and McNemar’s tests to compare psychosocial functioning at 3 and 6 months and regression models to assess baseline predictors of psychosocial outcomes at 6 months.
Results:
Adults reported significant improvements in diabetes distress (t = −7.20 P < .001; t = −8.01, P < .001), sleep quality (t = 6.81, P < .001; t = 2.98, P = .003), fear of hypoglycemia (t = −4.42, P < .001; t = −4.97, P < .001), and hypoglycemia confidence (t = 8.68, P < .001; t = 7.96 P < .001) from baseline to 3 months and 6 months, respectively. Significant improvements in parents’ and children’s sleep quality and parents’ fear of hypoglycemia were also observed. Several baseline characteristics were associated with psychosocial outcomes at 6 months.
Conclusions:
The current findings support the broad and sustained benefits of Loop across multiple aspects of psychosocial well-being. Advancement and dissemination of such technologies has the potential to improve mental and physiological health among people living with type 1 diabetes.
The chronic and rigorous demands of managing type 1 diabetes can threaten mental health and psychosocial functioning, leading to deteriorations in self-management and glycemic outcomes.1-4 Recently, automated insulin dosing (AID) systems have emerged. These systems are designed to target some of the most challenging aspects of diabetes self-management, such as synthesizing and interpreting glucose data, predicting glucose levels, and providing real-time insulin administration and adjustments. By automatically relaying and integrating information across diabetes devices, AID systems have the potential to reduce the behavioral and cognitive workload required for diabetes management. Diabetes device companies have taken strides in developing integrated systems but have been subject to delays due to regulatory processes and restrictions. In response, a group of people living with type 1 diabetes and their loved ones have developed a variety of open-source solutions to effectively and immediately address their unmet diabetes management needs. These individuals forged the “Do-It-Yourself” (DIY) movement that is routed in the principle of people living with type 1 diabetes helping each other to improve treatment and quality of life.
Loop is an open-source AID system comprising a smartphone app, continuous glucose monitor (CGM), insulin pump, and wireless communication bridge (eg, RileyLink). The smartphone app consolidates data and uses a predictive algorithm that adjusts insulin administration to optimize glucose. Loop has grown to be adopted by over 9000 users with emerging evidence of safety and effectiveness within real-world settings. Specifically, a study of 558 new Loop users demonstrated improved time-in-range (TIR) and minimal hypoglycemia after 6 months of use. 5 That evaluation is just part of the story, however, as the potential benefits of Loop could extend beyond glycemic outcomes to psychosocial well-being. That is the focus of this investigation.
Evaluating the impact of AID systems, such as Loop, on psychosocial outcomes provides valuable insight into the potential benefits or burdens of these systems. There are few published reports on the psychosocial benefits of AID and all are within standardized clinical trials. For example, a recent report of the Medtronic Advanced Hybrid Closed Loop system show improved satisfaction of glucose values and how they are monitored. 6 A qualitative study with the current sample revealed numerous psychosocial benefits and few drawbacks of Loop use. 7 More data are forthcoming on other systems.
In addition to evaluating psychosocial outcomes of Loop specifically, examining changes in psychosocial functioning following Loop uptake may also help to disentangle the complex relationship between diabetes management and psychosocial well-being. For instance, diabetes distress,8,9 sleep quality,10,11 and fear of hypoglycemia12,13 can have bidirectional relationships with self-management behaviors. And given that psychosocial assessment and support are recommended as a standard of diabetes care, 14 evaluating the potential psychosocial benefits of adopting cutting-edge diabetes technologies may provide critical insight into psychosocial risk and ways to promote resilience among people living with type 1 diabetes. In addition, identifying the factors that correlate with Loop users’ psychosocial functioning following Loop system uptake could also broaden our understanding of psychosocial risk, who tends to benefit most from adopting these systems, as well as how to best support new Loop users during the start-up process. To this end, the current study investigated psychosocial outcomes of Loop initiation among people living with type 1 diabetes as well as predictors of psychosocial outcomes over time.
Research Design and Methods
Procedures
People using Loop and in the process of starting Loop were recruited to participate in a large-scale observational study through social media postings and when ordering a pre-made wireless communication bridge (RileyLink at the time of the study). Interested individuals were directed to a website which included study details and electronic informed consent documents. Electronic informed consent was obtained from participants ≥18 years old and the legally authorized representative for participants <18 years old who provided assent. The original study’s inclusion criteria were adults and children with type 1 diabetes and parents of children with type 1 diabetes who were already using Loop or were in the process of starting Loop and were U.S. residents. However, the current sample included only participants who were initiating Loop at the time of enrollment. Enrollment was open between January 2019 and August 2019 and data collection ended in April 2020. The protocol was approved by the Institutional Review Board of the JAEB Center for Health Research. The protocol is available at https://public.jaeb.org/datasets and summarized on clinicaltrials.gov (NCT03838900).
Electronic surveys captured participants’ demographic and clinical information as well as self- and parent-reported outcomes on validated psychosocial survey measures at baseline, 3 months, and 6 months. Adults with type 1 diabetes and on Loop were administered all measures listed below. Parent report on parents’ sleep quality and parent fear of hypoglycemia was collected for all new Loop users under 18 years of age. Child report of their own sleep quality and fear of hypoglycemia was also collected among new Loop users ages 11 to 17 years.
Measures
Diabetes distress
Diabetes distress represents the frustration, helplessness, and other negative emotional experiences of managing diabetes and was measured in this study using the four-item diabetes management subscale of the Diabetes Distress Scale (DDS).15,16 Participants were asked how often they were bothered by each item over the past month. A sample item includes “Feeling that I am not as skilled at managing diabetes as I should be.” Response options range from 1 (not a problem) to 6 (a very serious problem), and all responses are averaged to create a total score, with higher scores reflecting greater diabetes distress. A clinical cutoff score of three or higher reflects at least moderate distress. Cronbach’s alphas are 0.79, 0.72, and 0.75 at baseline, 3 months, and 6 months, respectively.
Technology attitudes
Attitudes toward diabetes technology was assessed using a five-item Diabetes Technology Attitudes scale that captures the use of and comfort with diabetes devices and technologies (eg, “Diabetes technology has made my life better”). The response scale ranges from 1 (strongly disagree) to 5 (strongly agree). Item scores are summed to create a total score, with higher scores reflecting more positive attitudes toward diabetes technology. Cronbach’s alphas are 0.84, 0.85, and 0.89 at baseline, 3 months, and 6 months, respectively.
Fear of hypoglycemia
Fear of hypoglycemia was measured using the Worry subscale on the Hypoglycemic Fear Survey (HFS-Worry).17,18 Three versions of this subscale (15 items each) were used and each assessed the frequency of worry about each item based on the respective reporter. A sample adult item includes “Having a reaction while alone,” a sample parent item includes “No one being around to help my child during a low,” and a sample child item includes “Losing control because of a low blood sugar.” Response options range from 0 (never) to 4 (almost always). The scores were summed to create a total score, with higher scores reflecting greater fear of hypoglycemia. Cronbach’s alphas are 0.93, 0.93, and 0.91 for adults, 0.90, 0.93, and 0.91 for parents, and 0.87, 0.91, and 0.91 for children, at baseline, 3 months, and 6 months, respectively.
Hypoglycemia confidence
The eight-item Hypoglycemia Confidence Scale (HCS) 19 prompts participants to rate their level of confidence related to various situations and issues related to hypoglycemia. Sample items include “When you are exercising” and “Catch and respond to hypoglycemia before your blood sugars get too low,” with response options ranging from 1 (not confident at all) to 4 (very confident). Item scores are summed into a total score, with higher scores reflecting more confidence. Cronbach’s alphas are 0.88, 0.88, and 0.87 at baseline, 3 months, and 6 months, respectively.
Technology problem solving
The Technology Use for Problem Solving in Type 1 Diabetes (TUPS) 20 has nine items that measure the frequency that diabetes-specific and commonly available technologies are used to address problems with diabetes self-management. While this scale was initially developed for adolescents, the items are relevant to adults as well. Sample items include “I use graphs or averages from my meter or pump to help me see if I have been running too high or too low” and “I go online to talk to other people with diabetes in order to get help with diabetes problems.” The response scale ranges from 0 (never) to 5 (every day). Item scores are summed to create a total score, with higher scores reflecting more problem solving. Cronbach’s alphas are 0.71, 0.62, and 0.72 at baseline, 3 months, and 6 months, respectively.
Sleep quality
The Pittsburgh Sleep Quality Inventory 21 was used to measure sleep quality and disturbances over a one-month time interval. An index score is generated based on sleep times, difficulties initiating and maintaining sleep, and various factors related to sleep. Higher index scores reflect poorer sleep quality, with a cutoff of greater than 5 indicating poor sleep quality.
Demographic characteristics
The new Loop user’s baseline age (in years), gender identity (female vs male and nonbinary), education (associate/trade/bachelor’s degree or higher vs high school graduate and below), race/ethnicity (non-Hispanic, white vs minority), income (annual household income of $100 000 and above vs below $100 000) were based on self-report or parent report.
Glycemic measures
Percent time-in-range was based on CGM data obtained remotely from participants. The primary metric used was TIR between 70 and 180 mg/dL, which was the primary outcome in the observational study. HbA1c collected via fingerstick blood samples at baseline and after 3 and 6 months using at-home collection kits mailed directly to study participants and processed as a central laboratory (University of Minnesota Advanced Research and Diagnostic Laboratory).
Loop acceptability
Participants were asked several Loop-specific questions, including “How nervous were you to start using Loop?” with response options ranging from 1 (not at all nervous) to 5 (very nervous), “How hard was it to start Loop? It was . . . ” with response options ranging from 1 (easy) to 5 (hard), “Did you need any help starting Loop?” (yes/no), and “Do you trust Loop is working correctly?” (yes/no).
Analytic Approach
Paired t tests were used to compare psychosocial measures from baseline to 3 months and 6 months for all psychosocial measures. Dichotomous measures based on cutoffs for diabetes distress and sleep quality were also tested using McNemar’s test.
Regression models were constructed to assess predictors of 6-month psychosocial outcomes, while controlling for baseline levels of the corresponding outcome. Predictors included baseline age, gender, education, race/ethnicity, income, A1c, nervousness to start Loop, difficulties starting Loop, needing help to start Loop, and trusting Loop is working correctly. The trusting Loop survey item was missing data for the children subsample and thus was not included in the children subsample regression model.
Potential differences among participants with missing data at follow-up were assessed using independent t tests. Results revealed few differences between participants with 6-month follow-up data and those with missing data, which varied across subsamples. Adults with data present at 6 months had better baseline sleep quality (6.18 vs 7.72, P = .001) and less of a hard time starting Loop (2.62 vs 2.25, P = .006) compared with those with data missing. Parents with data present at 6 months were more likely to have younger children (9.41 vs 10.76, P = .008) with a younger age at diagnosis (4.66 vs. 5.80, P = .007). Children with data present at 6 months were less likely to have parents with a trade/associate/bachelor’s degree or higher than children without 6-month data (88.9% vs 97.7%, P = .049). No other differences were detected across baseline measures and sample characteristics, including time-in-range or A1c.
Results
Our subsamples, based on data available and baseline and follow-ups, included 239 adults on Loop, 243 parents of children (ages 18 years and younger) on Loop, and 115 children (ages 11-18 years) on Loop. These subsamples, however, were not mutually exclusive as both parent and child report were available for 112 families (46.1% of the parent subsample and 97.4% of the child subsample). Baseline characteristics of the adult, parent, and child subsamples are reported in Table 1.
Baseline Characteristics of Adult, Parent, and Child Subsamples.
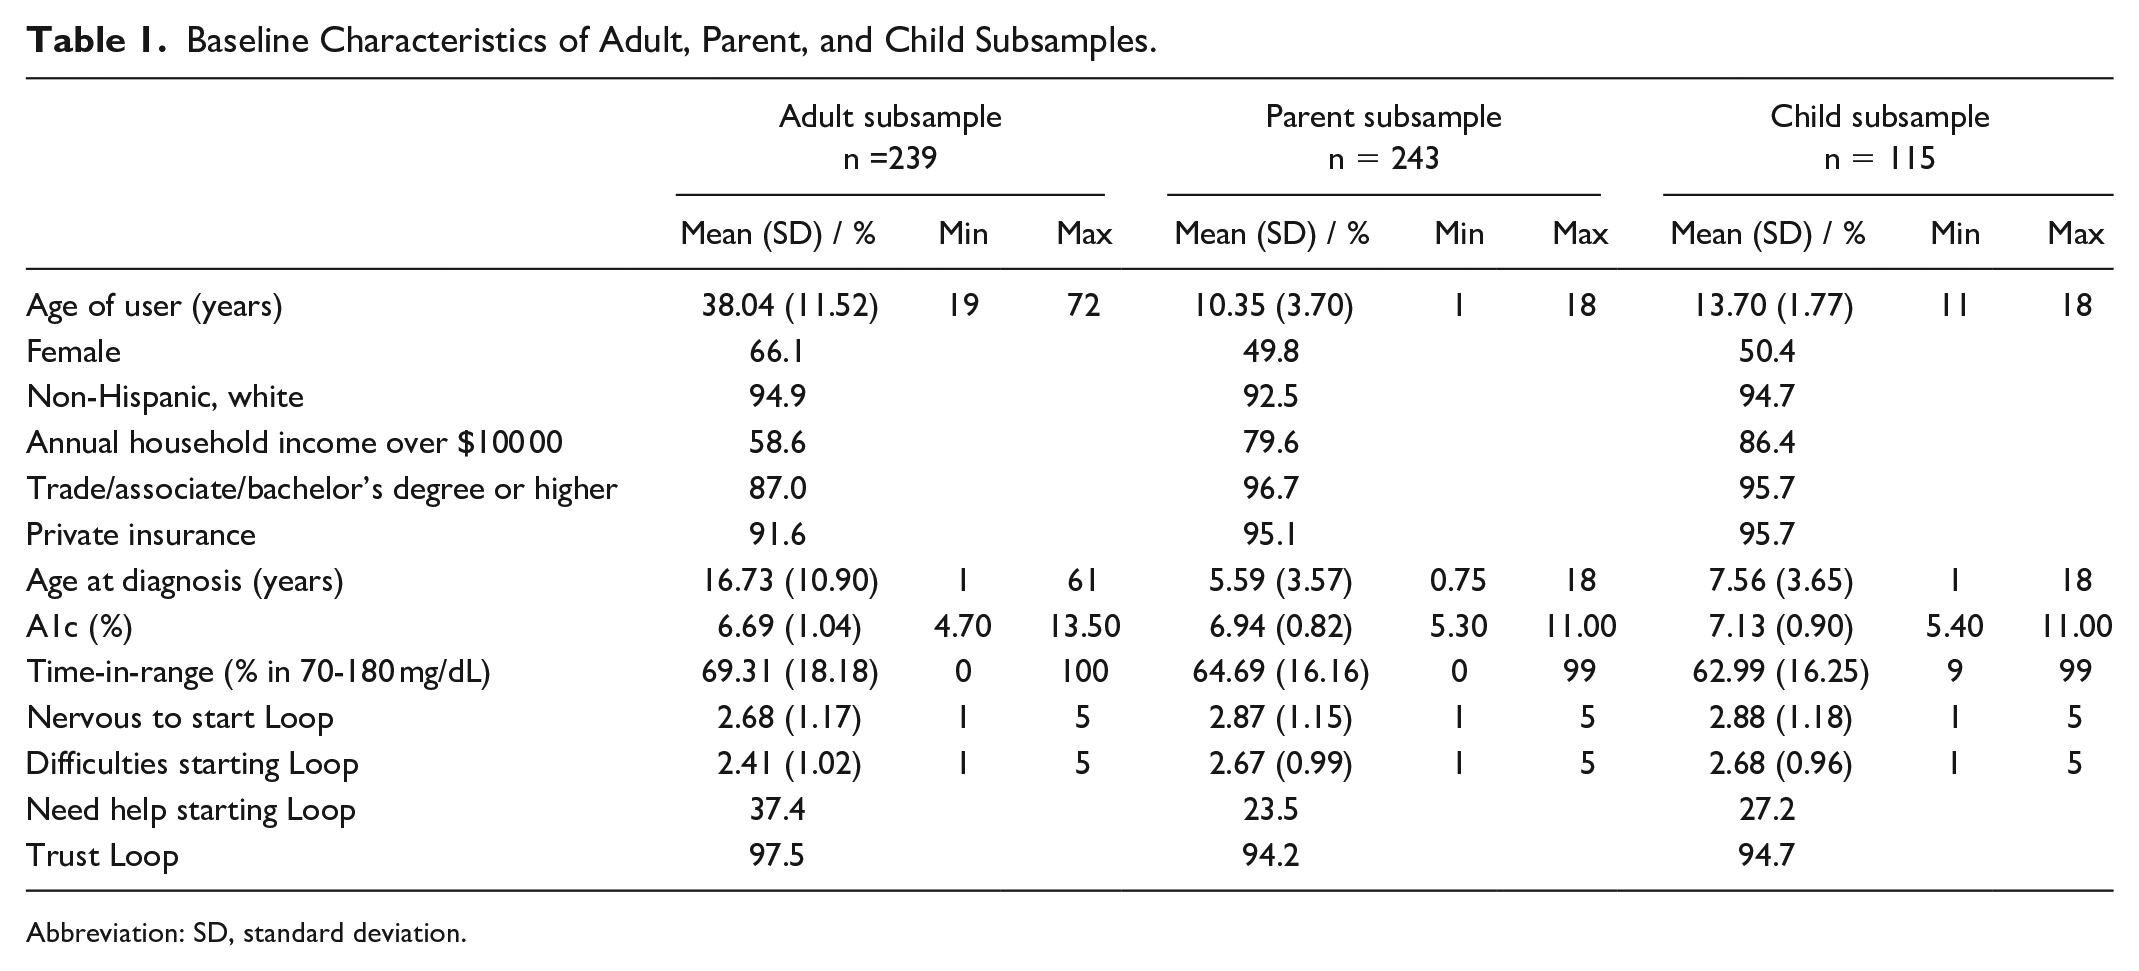
Abbreviation: SD, standard deviation.
Paired t tests revealed several improvements in psychosocial well-being (see Table 2). Adults reported significant reductions in diabetes distress from baseline to 3 months (t = −7.20 P < .001, d = −0.46) and 6 months (t = −8.01, P < .001, d = −0.60). The DDS can be used to indicate clinical elevations of distress, and the McNemar’s test revealed that, over time, fewer people met this threshold for diabetes distress from baseline to 3 months (18.0% vs 7.5%, P < .001) and baseline to 6 months (17.2% vs 3.7%, P < .001). Paired t tests also revealed increases in adult hypoglycemia confidence from baseline to 3 months (t = 8.68, P < .001, d = 0.56) and 6 months (t = 7.96 P < .001, d = 0.70). Significant improvements in adults’ sleep quality were observed from baseline to 3 months and baseline to 6 months, respectively (t = 6.81, P < .001, d = 0.42; t = 3.63, P < .001, d = 0.29). Adults were also found to have significant reductions in rates of exceeding the cutoff for poor sleep quality from baseline to 3 months (57.1% vs 41.9%, P < .001), but not 6 months. Adults also reported reductions in fear of hypoglycemia from baseline to 3 (t = −4.42, P < .001, d = 0.23) and 6 (t = −4.97, P < .001, d = 0.40) months. No significant changes in technology attitudes were detected at any time points.
Paired t Tests of Validated Patient-Reported Outcome Measures Over Time.
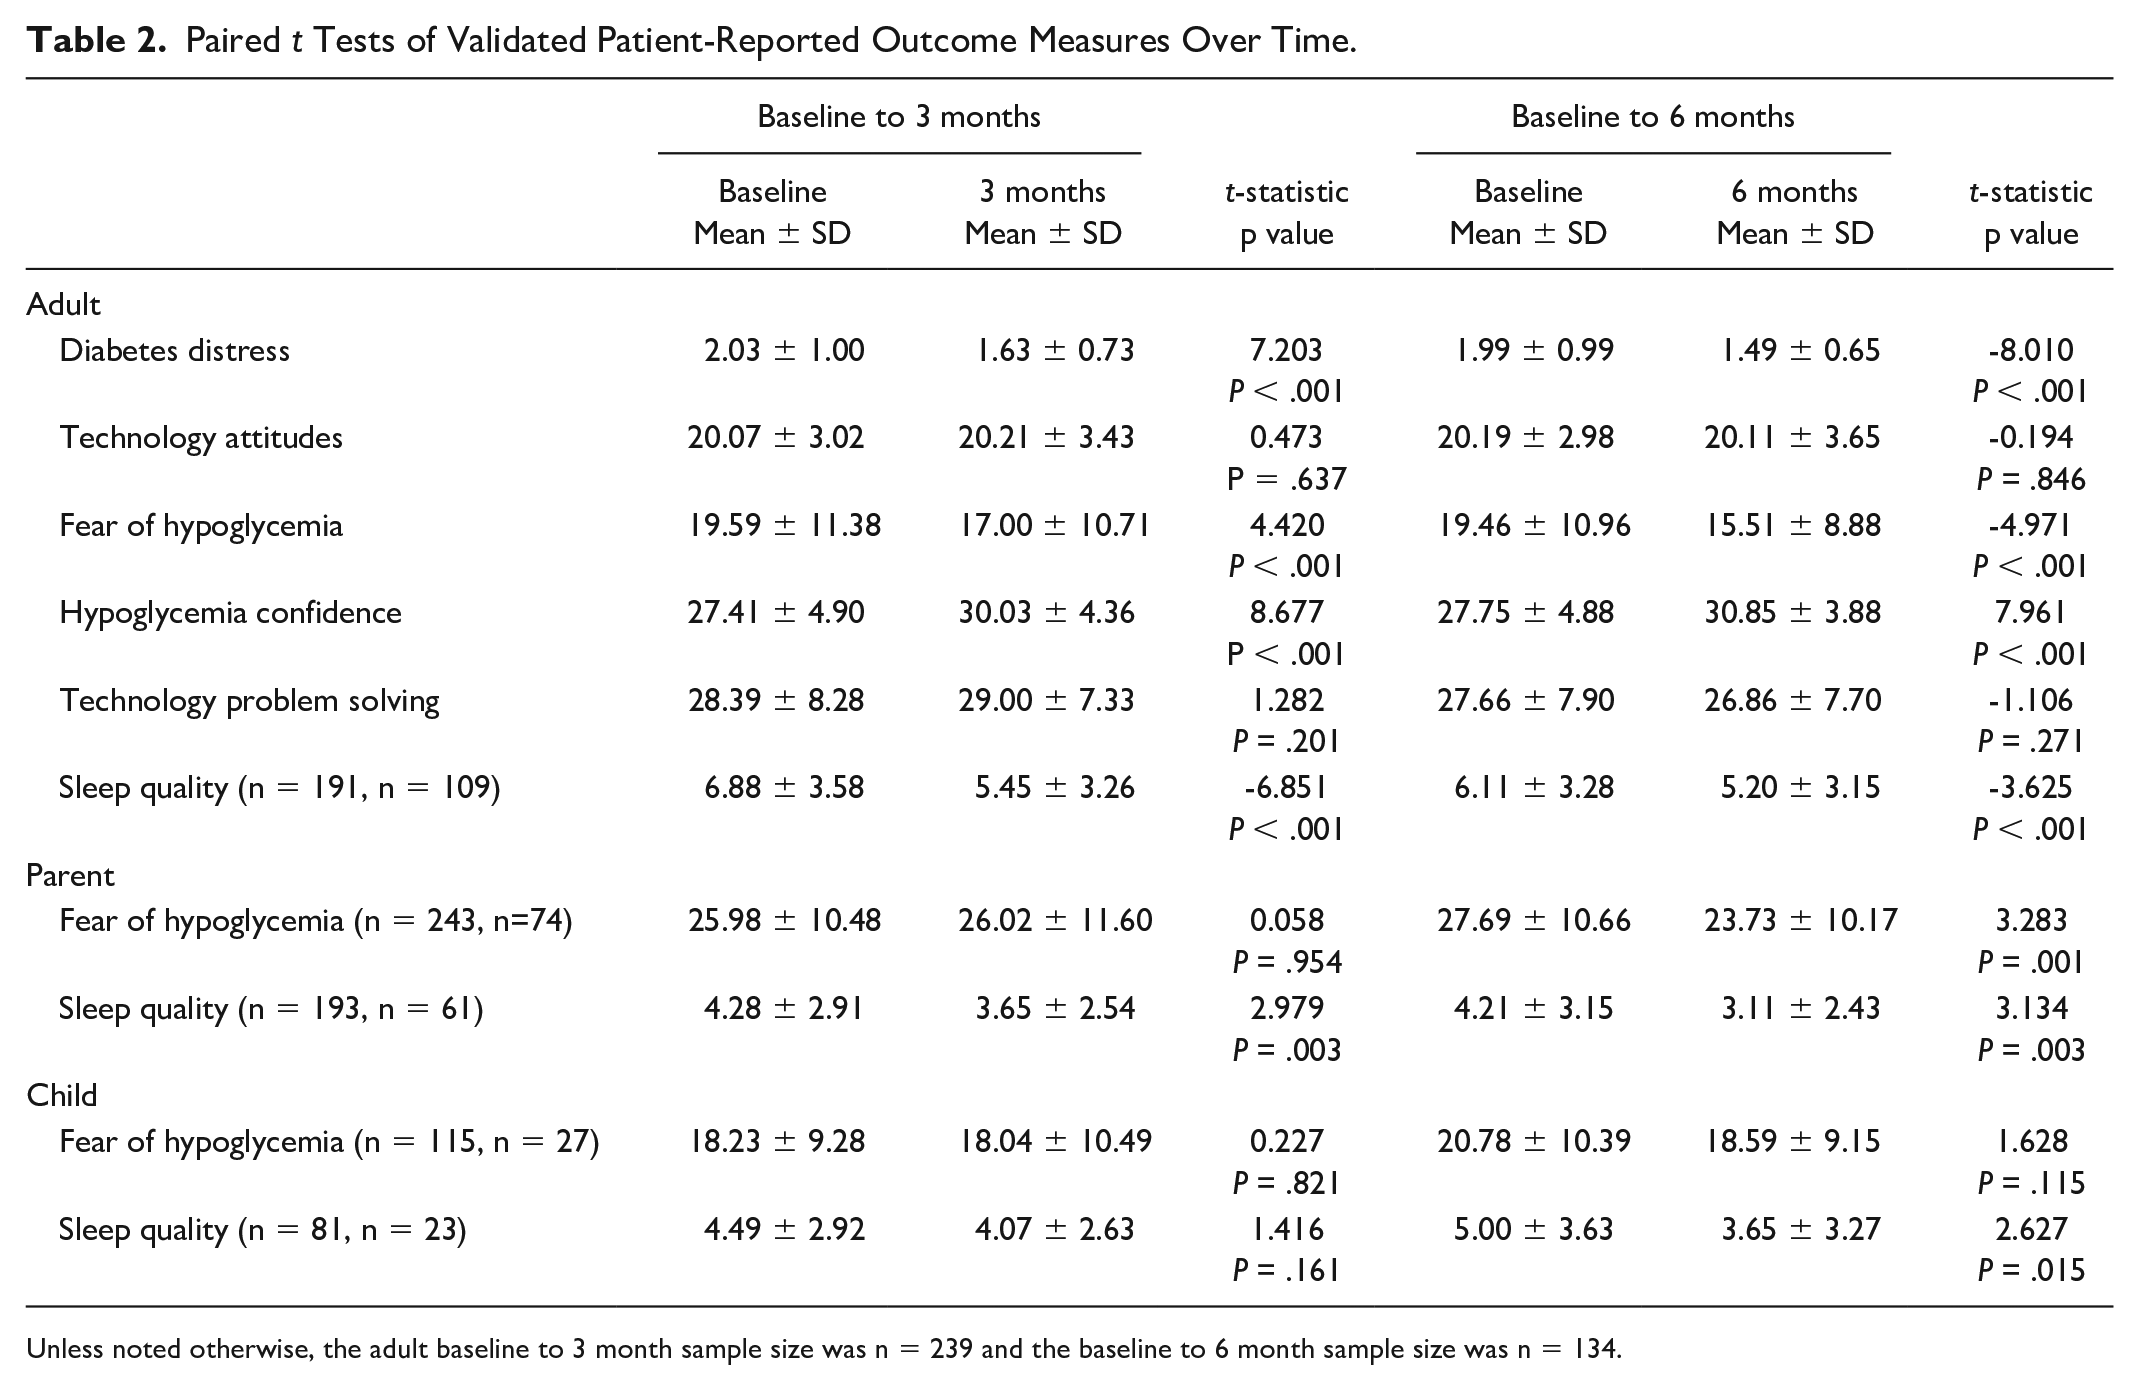
Unless noted otherwise, the adult baseline to 3 month sample size was n = 239 and the baseline to 6 month sample size was n = 134.
For parents, improvements in sleep quality were observed from baseline to 3 months and baseline to 6 months, respectively (t = 2.98, P = .003, d = 0.23; t = 3.13 P = .003, d = 0.39). Fewer parents met the cutoff for poor sleep quality at 3 (25.9% vs 17.1%, P = .019) and 6 (26.2% vs 8.2%, P = .007) months, compared with baseline. Parents reported improvements in fear of hypoglycemia at 6 months only (t = −3.28, P = .001, d = 0.38).
Children reported significant improvements in sleep at 6 months (t = 2.63, P = .015, d = 0.39). Rates of meeting the threshold for poor sleep quality did not significantly differ over time for children, and no significant changes in children’s fear of hypoglycemia were observed.
Predictors of Psychosocial Functioning After 6 Months of Loop Use
Regression models revealed several baseline predictors of psychosocial functioning at 6 months. Less diabetes distress at 6 months was significantly associated with older age (β = −0.16, P = .029), lower A1c (β = 0.20, P = .007), less difficulty starting Loop (β = 0.21, P = .008), and trusting Loop (β = −0.24, P = .001). Greater fear of hypoglycemia was associated with different factors across subsamples: more fear among adults associated with having an education level of an associate/trade/bachelor’s degree or higher (β = 0.20, P = .016), among parents who were more nervous about starting Loop (β = 0.23, P = .036), and for children, greater fear was associated with being nonwhite/minority (β = 0.59, P = .040) and more difficulties starting Loop (β = 0.63, P = .021). More technology problem solving was associated with higher ($100k+ annual household) income (β = 0.18, P = .042). Adults’ sleep quality was worse among men than women (β = 0.17, P = .049). For parents, lower educational attainment (β = 0.31, P = .015) and having a harder time starting loop was associated with worse sleep quality (β = 0.27, P = .039), whereas children’s sleep quality was poorer among those who were nonwhite/minorities (β = 0.87, P = .015), had a harder time starting Loop (β = 0.66, P = .029), but reported not needing help starting Loop (β = 0.65, P = .039). No baseline predictors were associated with attitudes toward diabetes technology or hypoglycemia confidence at 6 months.
Conclusions
Growing evidence supports Loop as a safe, effective, self-initiated system used by adults and children with type 1 diabetes. 5 Prior analyses with this real-world sample have demonstrated improvements in TIR despite this sample having an already relatively high level prior to starting Loop. Similar to the glycemic results, psychosocial results demonstrate robust changes that are maintained over time related to diabetes distress, fear of hypoglycemia, and sleep quality. Combined with recent qualitative results about Loop users’ experiences, 7 the current findings reflect broad benefits of Loop use over time and across user type and reinforce international efforts to safely and systematically support open-source AID systems. 22
The observed reductions in diabetes distress among new Loop users are quite remarkable in their magnitude, consistency over time, and given direct link to glycemic control and self-care behaviors.23-25 Indeed, our findings indicate that all new Loop users, on average, experience improvements in their overall diabetes distress as well as decreased rates of meeting clinical levels of distress. When predicting reductions in diabetes distress over time, we found that adults of older age as well as those who reported less difficulties starting Loop and greater trust in Loop working correctly benefited the most in this area. The latter findings support the possibility that increased assistance and guidance during the early stages of Loop start-up could amplify long-term psychosocial benefits for users.
Sleep is a critical component to physical and mental well-being, which is often compromised when living with type 1 diabetes. Findings have shown that people living with type 1 diabetes experience more sleep disturbances and daytime dysfunction than age-, sex- and body mass index–matched peers without diabetes, even when sleep duration was comparable. 26 In fact, just a single night of disrupted sleep among adults with type 1 diabetes is associated with reduced peripheral insulin sensitivity by 21%, 27 and disruptive sleep patterns among children with type 1 diabetes has been linked to adverse effects on subjective well-being as well as physiological outcomes. 28 In this context, it is particularly impressive that adult and child users as well as parents of child users all reported improvements in sleep quality after initiating Loop. In addition, the rate at which adults met the cutoff for poor sleep quality substantial dropped in the first three months of Loop uptake. The potential mechanisms underlying the potential effects of Loop on sleep quality include glycemic improvements, fewer device alerts, less need to interact with devices, and/or peace of mind. While further research is needed to identify the role and relative weight of such potential mechanisms, the current findings are a good indication of the potential impact of Loop use on this instrumental life domain.
Whereas adults on Loop experienced significant reductions in fear of hypoglycemia across the first 3 and 6 months following Loop uptake, such reductions were only observed for parents after 6 months and no effects were observed for children. These findings contrast those from another study of closed loop systems which found slight declines in adolescent users’ fear of hypoglycemia but increases in parents’ fear. 29 Notably, among adult users, lower education levels were associated with greater reductions in fear of hypoglycemia, which is consistent with prior research on fear of hypoglycemia. 17 In the current context, this finding may suggest that the information and feedback from Loop may be particularly helpful to people with lower educational attainment. Interacting with Loop may provide reassurance and enhance one’s understanding about hypoglycemia, especially among people with less education and/or access to diabetes-specific and general resources. Interestingly, no effects were found for hypoglycemia confidence, which may be related to relying on a device to control/prevent the hypoglycemia as opposed to something “done by” the patient or parent, and thus not resulting in a perceived personal boost of confidence.
Results from our regression model highlighted factors that were associated with psychosocial outcomes six months after Loop uptake. For instance, endorsing more difficulties starting Loop predicted more adult diabetes distress, greater fear of hypoglycemia among children, and worse sleep quality among children and parents six months later. This pattern aligns with a prior study of discontinued Loop use 30 that suggests that greater ease of the start-up process, through increased education, consultation, and/or technical assistance may not only reinforce ongoing use but also amplify the psychosocial benefits of Loop use.
Of note, the current sample included a predominantly non-Hispanic white sample from relatively high socioeconomic status. To both address factors related to socioeconomic status as well as address potential limits to generalizability of findings based on socioeconomic factors, our regression models included variables representing education, income, and race/ethnicity. Results showed that being of a racial/ethnic minority background was associated with greater fear of hypoglycemia and poorer sleep quality among children over time. These findings suggest that changes in psychosocial functioning related to Loop uptake are not as apparent for adults and parents as they are for children and that racial/ethnic minority children may benefit from additional support in these areas during the Loop start-up process. For instance, information related to preventing and treating hypoglycemia as well as increased support around overnight Loop use may help to offset these potential disadvantages. Interestingly, higher educational attainment was associated with more fear of hypoglycemia among adults but better sleep quality among parents over time. This finding may reflect more highly educated adults becoming hypervigilant and preoccupied with hypoglycemia with ongoing Loop use, whereas parents may gain greater peace of mind over time, at least during the night.
Methodological strengths of the current study include a large, real-world observational cohort, longitudinal study design, standardized and validated psychosocial measures, and multiple reporters. Study limitations include a largely homogenous study sample of predominantly non-Hispanic white participants from relatively high socioeconomic status. In addition, as described above, although the study was longitudinal, there was a high level of attrition and because it was not a randomized control trial, we were not able to draw strong causal inferences. Future studies conducted with comparison groups and more representative samples are needed.
The current study broadens our understanding of the psychosocial benefits of adopting Loop, who tends to benefit most, as well as how to best support new Loop users during the start-up process. Our findings add to the growing literature that supports the potential of advancing diabetes technologies to not only improve glycemic outcomes, but to encourage us all to reconsider what living with diabetes could and should be like in the future. As we address the metabolic needs of people living with diabetes, it is crucial that we think beyond glycemia. Robust and enduring improvements in diabetes distress, sleep quality, and fear of hypoglycemia following Loop uptake both represent a broad improvement in psychosocial well-being, with likely cascading benefits within people’s lives. These findings reinforce the spirit behind the open-source movement by demonstrating how designing technologies based on lived experiences and personal needs can have multifaceted benefits to many. And as the technology advances and empirical support grows, there is increasing reason to believe in what many Loop users have hoped: Loop is a game-changer.
Footnotes
Abbreviations
DIY, “Do-It-Yourself”; AID, automated insulin dosing; CGM, continuous glucose monitor; TIR, time-in-range
Author Contributions
JJW wrote and revised the manuscript and contributed toward data analysis, interpretation, and revisions. DN contributed toward conceptualization, study design, data collection, analysis, interpretation, and revisions. KKH and SJH contributed toward study design, data collection, analysis, and revisions. RAL contributed toward interpretation and revisions.
Declaration of Conflicting Interests
The author(s) declared no potential conflicts of interest with respect to the research, authorship, and/or publication of this article.
Funding
The author(s) disclosed receipt of the following financial support for the research, authorship, and/or publication of this article: This study was supported by The Leona M. and Harry B. Helmsley Charitable Trust and NIH grant K23-DK121771 and was coordinated by Jaeb Center for Health Research.