
Abstract
Background:
The aim of this study was to develop a predictive model to classify people with type 2 diabetes (T2D) into expected levels of success upon bolus insulin initiation.
Methods:
Machine learning methods were applied to a large nationally representative insurance claims database from the United States (dNHI database; data from 2007 to 2017). We trained boosted decision tree ensembles (XGBoost) to assign people into Class 0 (never meeting HbA1c goal), Class 1 (meeting but not maintaining HbA1c goal), or Class 2 (meeting and maintaining HbA1c goal) based on the demographic and clinical data available prior to initiating bolus insulin. The primary objective of the study was to develop a model capable of determining at an individual level, whether people with T2D are likely to achieve and maintain HbA1c goals. HbA1c goal was defined at <8.0% or reduction of baseline HbA1c by >1.0%.
Results:
Of 15 331 people with T2D (mean age, 53.0 years; SD, 8.7), 7800 (50.9%) people met HbA1c goal but failed to maintain that goal (Class 1), 4510 (29.4%) never attained this goal (Class 0), and 3021 (19.7%) people met and maintained this goal (Class 2). Overall, the model’s receiver operating characteristic (ROC) was 0.79 with greater performance on predicting those in Class 2 (ROC = 0.92) than those in Classes 0 and 1 (ROC = 0.71 and 0.62, respectively). The model achieved high area under the precision-recall curves for the individual classes (Class 0, 0.46; Class 1, 0.58; Class 2, 0.71).
Conclusions:
Predictive modeling using routine health care data reasonably accurately classified patients initiating bolus insulin who would achieve and maintain HbA1c goals, but less so for differentiation between patients who never met and who did not maintain goals. Prior HbA1c was a major contributing parameter for the predictions.
Keywords
Introduction
Management of type 2 diabetes (T2D) commences with lifestyle interventions involving focus on diet and exercise, followed by the start of oral therapy such as metformin.1,2 Patient characteristics, progression of disease, and the need to attain glycemic control can necessitate treatment changes including the addition of multiple oral agents, glucagon like peptide-1 injections, and finally switching to insulin therapy.1,3,4 Timely initiation of insulin therapy is crucial for improved patient outcomes and optimal glycemic control.
Despite the escalated treatment strategies including the addition of basal insulin for people with T2D treated with oral agents, nearly 50% to 73% patients fail to meet the glycemic targets.5,6 A systematic review of 218 randomized clinical trials (RCTs) reported that only 39% of 21 615 people with T2D treated with basal insulin achieved glycated hemoglobin (HbA1c) <7%. 7 A primary care database analysis of 4062 people with T2D found that after one year of basal insulin therapy, only 7% reached the glycemic target of HbA1c ≤6.5%. 8 Similarly, even when insulin is escalated from once daily basal to multiple daily injections, only 14% to 15% of people with T2D reach the HbA1c levels <7% at the end of the 1-year follow-up period. 9
Predicting success for a new step in therapy currently relies upon clinical expertise and heuristics. The aim of this study was to develop a predictive model to classify people with T2D into expected levels of success upon bolus insulin initiation, to help guide targeted disease management efforts and/or treatment decisions.
Methods
The study was conducted in compliance with all state, local, and federal regulatory requirements and was consistent with Good Clinical Practices, Good Epidemiological Practices, the International Convention on Harmonization, Health Insurance Portability and Accountability Act regulations, the Department of Health and Human Services, the Office of Human Research Protection, and any applicable Internal Review Board guidelines.
This modeling study utilized data from the De-identified Normative Health Information (dNHI) database. dNHI is a robust, longitudinally linked, de-identified database consisting of individual-level data sourced from covered entities that permit de-identification and analysis of their data under applicable Business Associate Agreements. The dNHI database was used and managed according to the dNHI Data Use Policy and dNHI Acquisition and Management Policy, which was followed by all members of the team who used this data asset.
Study Design
Data from 2007 to 2017 were used in this study. The index date was defined as the date of the first bolus insulin prescription meeting criteria in the identification period (January 1, 2008—January 1, 2016). This index date was used to divide the 1-year period prior to the index, from which predictive variables were derived, from the prediction period 3 to 15 months post index where measures of glycemic control were collected for assignment into the appropriate glycemic control category (Figure 1).
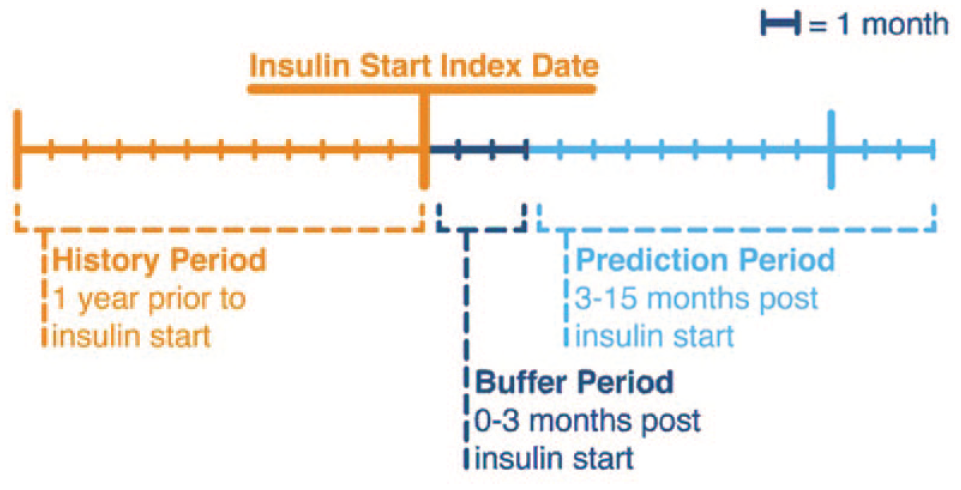
Study design.
People with T2D, aged 18 to 64 years, who were commercially insured and had at least 1 HbA1c value within the 12 months prior to index date and at least 2 HbA1c values in the 3 to 15 months post index date, were included in the study. People were identified as having T2D if they received ≥2 non-ancillary diagnoses of T2D (International Classification of Diseases, Ninth Revision, Clinical Modification [ICD-9-CM] code 250.x0 or 250.x2 or ICD-10-CM of E11xx.) during the 12 months prior to index date. Further inclusion criteria included having at least two prescriptions for a bolus or premixed insulin, with the first one being the index date, 12 months of continuous enrollment prior to and following the index date, and no prior fills of a bolus or premixed insulin during the 12 months prior to index. People who were >65 years age or had type 1 diabetes, gestational diabetes, malignancy, ESRD or were on dialysis, or used an insulin pump were excluded from the study.
We trained boosted decision tree ensembles (XGBoost) to classify people with T2D into their predicted level of success (glycemic control) using the demographic and clinical data available in the 12 months prior to initiating bolus insulin.
Outcomes
The primary objective of the study was to develop a model capable of determining at an individual level, whether people with T2D are likely to achieve and maintain HbA1c goals. Predicted outcomes were based upon achievement of glycemic goal or demonstration of a clinically meaningful improvement in glycemic control which was defined either by reaching the HbA1c threshold of <8% (as per the National Committee for Quality Assurance Healthcare Effectiveness Data and Information Set [HEDIS] measures) 10 or having >1% reduction of HbA1c from baseline. During the modeling development, a stricter HbA1c threshold of <7% was considered. However, the model prediction performance was not substantially better with this alternative threshold. Specifically, the “achieve and maintain group” was less than 7% of the population in this modeling scenario and as such, the model assigned very few persons to that group, limiting the model’s efficacy at identifying this group. Based on this, patients were categorized into three classes: Class 0 (never meeting goals) included patients who never attained HbA1c control or showed significant change; Class 1 (meeting but not maintaining goal) included patients with an HbA1c that was below threshold and/or a 1% reduction and a later test that was not below threshold and/or 1% reduced; and Class 2 (meeting and maintaining goal) included patients for whom all HbA1c values, or their last 2+ met goal criteria.
Variables of Interest
The models in this study were trained on variables drawn directly from our database and/or rolled up into relevant code hierarchies or clinical concepts. Medical and pharmacy claims data indicate the existence of specific diagnosis, procedure, and pharmacy codes in a patient’s history. Pharmacy utilization was based upon generic product indicator (GPI) codes that were grouped at the GPI8 level. Full ICD diagnosis codes were used as indicators of a superordinate classification in the ICD hierarchy. For example, hypertensive heart disease without heart failure may be coded as I11.9 in the patient’s medical claims history, and we used the presence of that code in the patient’s history as an indicator of the higher-level hypertensive heart disease superordinate I11. Additional variables included demographic information, test results, and hospitalization and provider specialty utilization (Table 1).
Variables/Measure in the Study.
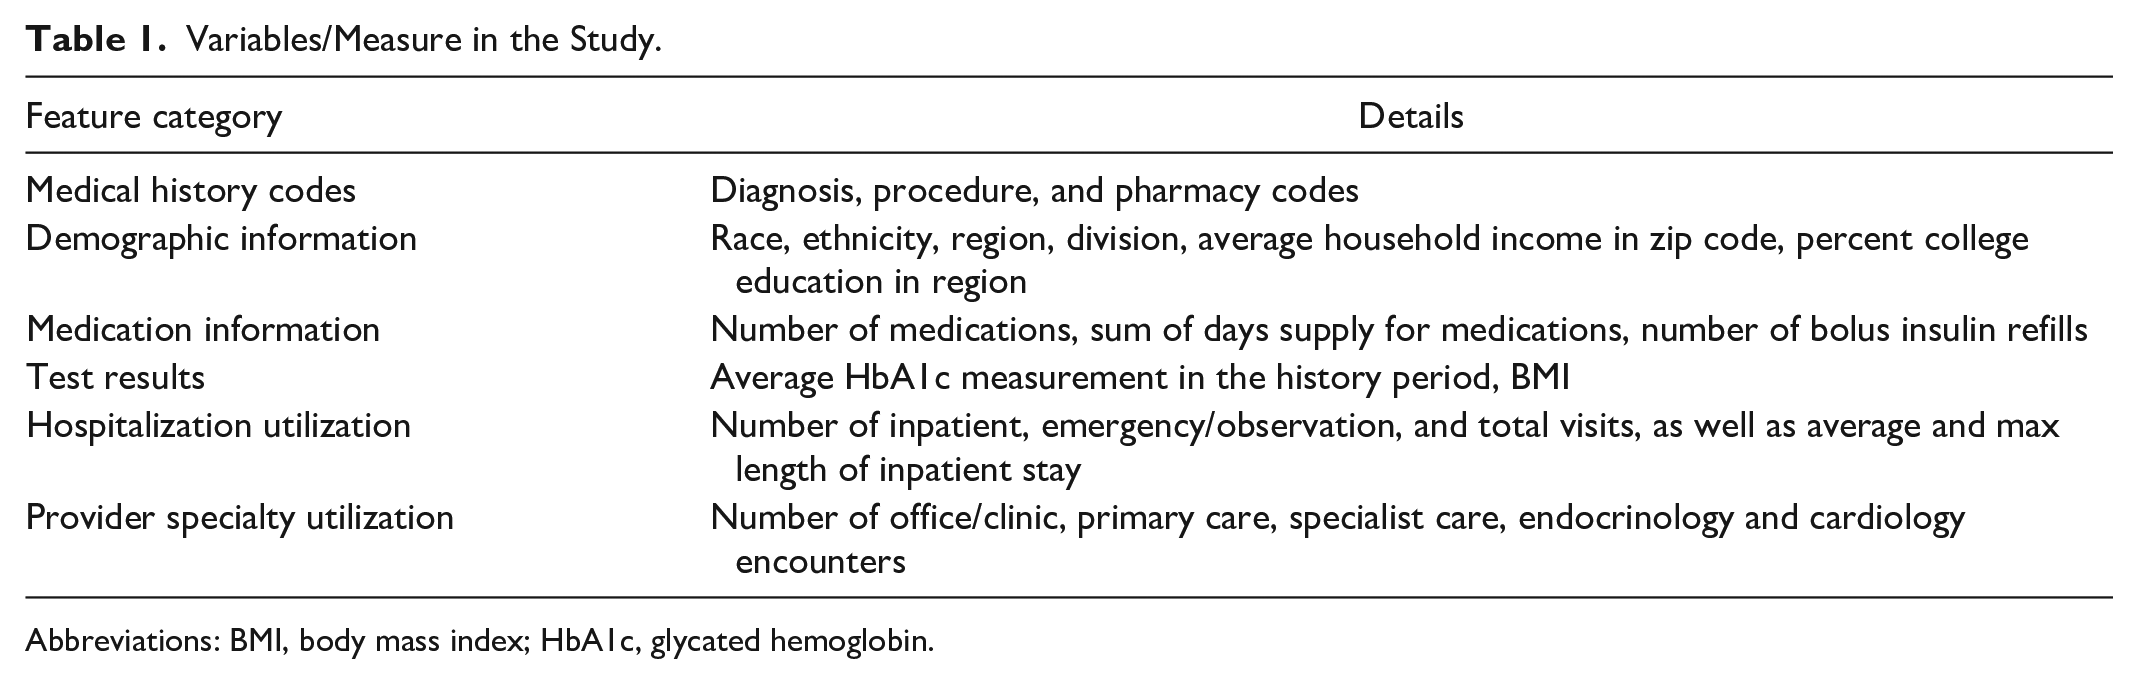
Abbreviations: BMI, body mass index; HbA1c, glycated hemoglobin.
Statistical Analysis
The analyses utilized the XGBoost algorithm in Python to model the study’s outcomes. Alternative analysis of this modeling decision was conducted by fitting other models to the same data, including k-nearest neighbors, logistic regression, and its L1/L2 penalized variants. Models were compared in nested cross-validation by area under receiver operating characteristic (ROC) curve.
We evaluated models trained on the available data (Table 1), measured the models’ predictive ability using logistic loss, and eliminated features until the model performance degraded 1% measured by logistic loss on a held out set in our nested cross-validation scheme. The model’s discriminative powers were measured in nested cross-validation by area under the ROC, micro-averaged ROC, macro-averaged ROC, area under precision-recall (PR) curve, log-loss, precision at fixed recall, and recall at fixed precision.11-13 Area under ROC values for the individual classes were calculated in a “one vs rest” fashion, considering the model’s performance in classifying individuals as belonging to that specific class, or not belonging to that class.
In micro-averaged ROC, each patient is represented by three binary outcomes, one for each class. That is, a patient with true class “0” is represented by three binary outcomes (1,0,0) with three associated probabilities from the model, p1, p2, p3, adding to 1. Combining predicted probabilities and true class indicators across N patients (resulting in a data set with 3N rows) allows for a single ROC to be constructed by applying different cutoff values to the probabilities for each binary outcome. In macro-averaged ROC, three separate ROC curves are first constructed with each category treated as a separate binary event (Y = 1 vs Y = 0 for all the rest) and using the model’s predicted probabilities as binary probabilities for each category. Then, the three ROC curves are averaged at each cutoff value resulting in a single ROC. In general, an area under the curve (AUC) of 0.5 suggests no discrimination (ie, ability to diagnose patients with and without the disease or condition based on the test), 0.5 to 0.7 is poor, 0.7 to 0.8 is considered acceptable, 0.8 to 0.9 is considered excellent, and more than 0.9 is considered outstanding. 14
Results
Population Characteristics
A total of 15 331 people with T2D were included in this study (see Supplementary Figure 1 for selection criteria). The population ranged from 18 to 65 years of age, with a mean age of 53.0 years (SD = 8.7). The sample included 7552 (49.3%) males and 7779 (50.7%) females. Mean baseline HbA1c levels were 9.5%, 9.2%, and 6.9%, respectively, for those in Class 0, Class1, and Class 2. In our study population (Figure 2), 7800 (50.9%) people met our defined HbA1c goal but failed to maintain that goal (Class 1), while 4510 (29.4%) never attained this goal (Class 0), and 3021 (19.7%) people met and maintained this goal (Class 2).
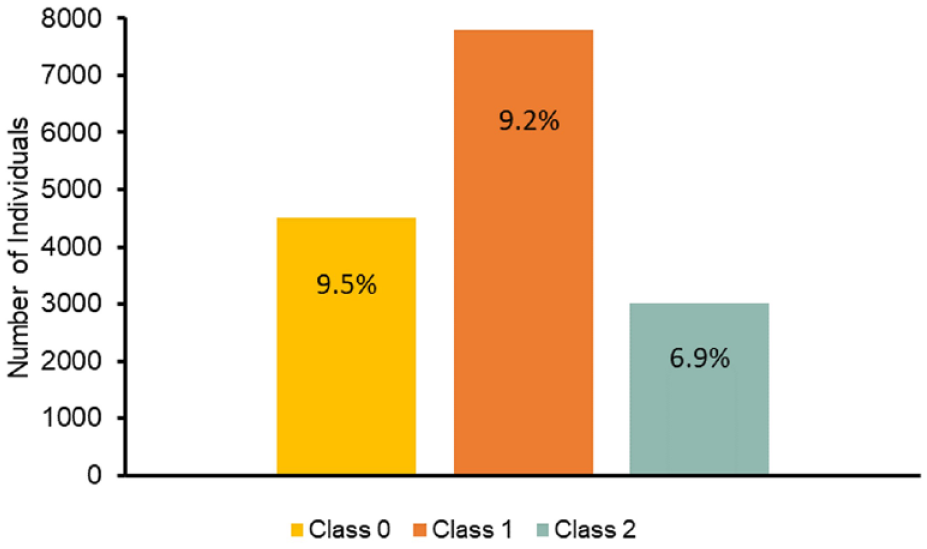
Cohort makeup: Class imbalance and mean baseline HbA1c. Abbreviations: Class 0, never meeting HbA1c goals; Class 1, meeting but not maintaining HbA1c goals; Class 2, meeting and maintaining HbA1c goal.
ROC
The model’s micro-averaged ROC was 0.79 (Figure 3) with greater performance on predicting those in Class 2 (ROC = 0.92) than those in Classes 0 (ROC = 0.71) and 1 (ROC = 0.62).
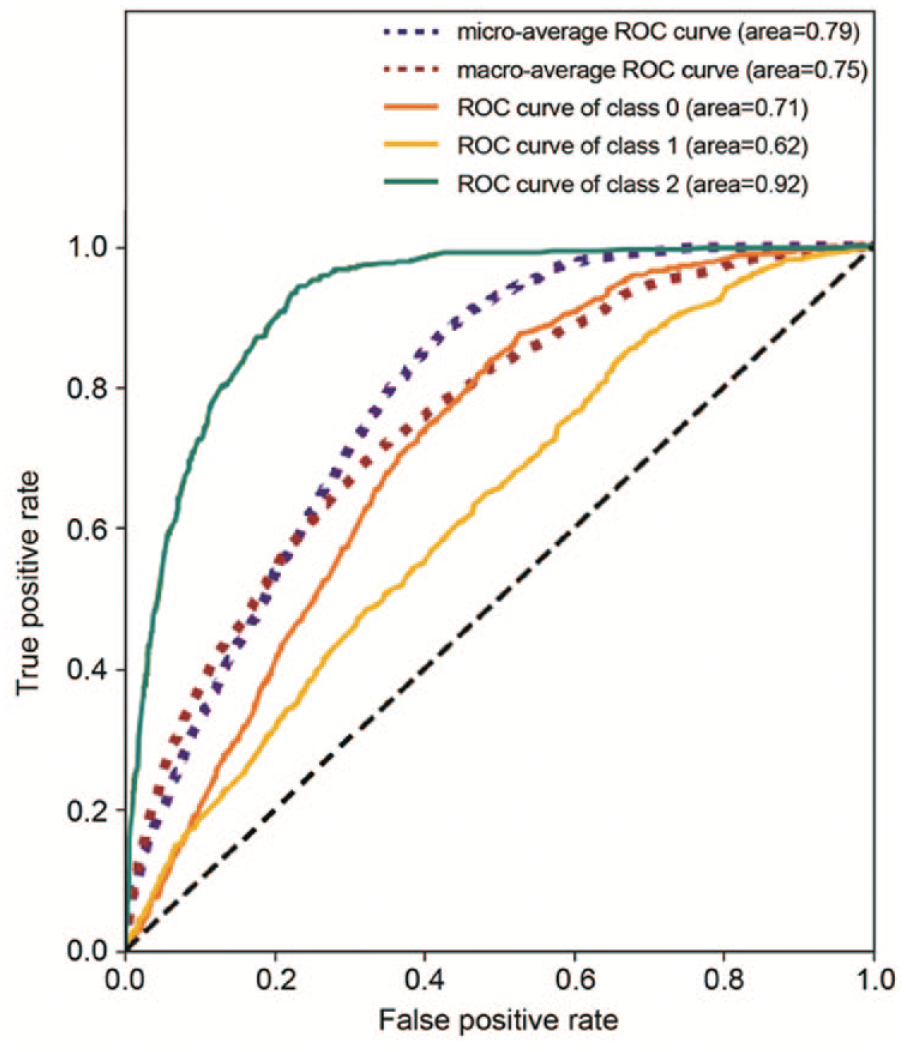
Receiver operating characteristic (ROC) curve. Abbreviations: Class 0, never meeting HbA1c goals; Class 1, meeting but not maintaining HbA1c goals; Class 2, meeting and maintaining HbA1c goal.
Precision-Recall Curves
In addition to ROC curves, we considered precision-recall (PR) curves as visual representations of model performance (Figure 4). Each point on a PR curve reflects an attainable combination of precision (also called positive predictive value) and recall (also known as sensitivity) for a model on a one-versus-rest prediction task. Along with the PR curve, we plotted iso-f1 curves which indicate the f1-score attained by a model with a particular precision/recall. A higher f1-score is a desirable characteristic in a model as it reflects the harmonic mean of precision and recall.11,12 Our model achieved area under the PR curve of 0.46 for Class 0, 0.58 for Class 1, and 0.71 for Class 2. These results indicate that our model can do a good job of identifying the members who are most likely to belong in each class.
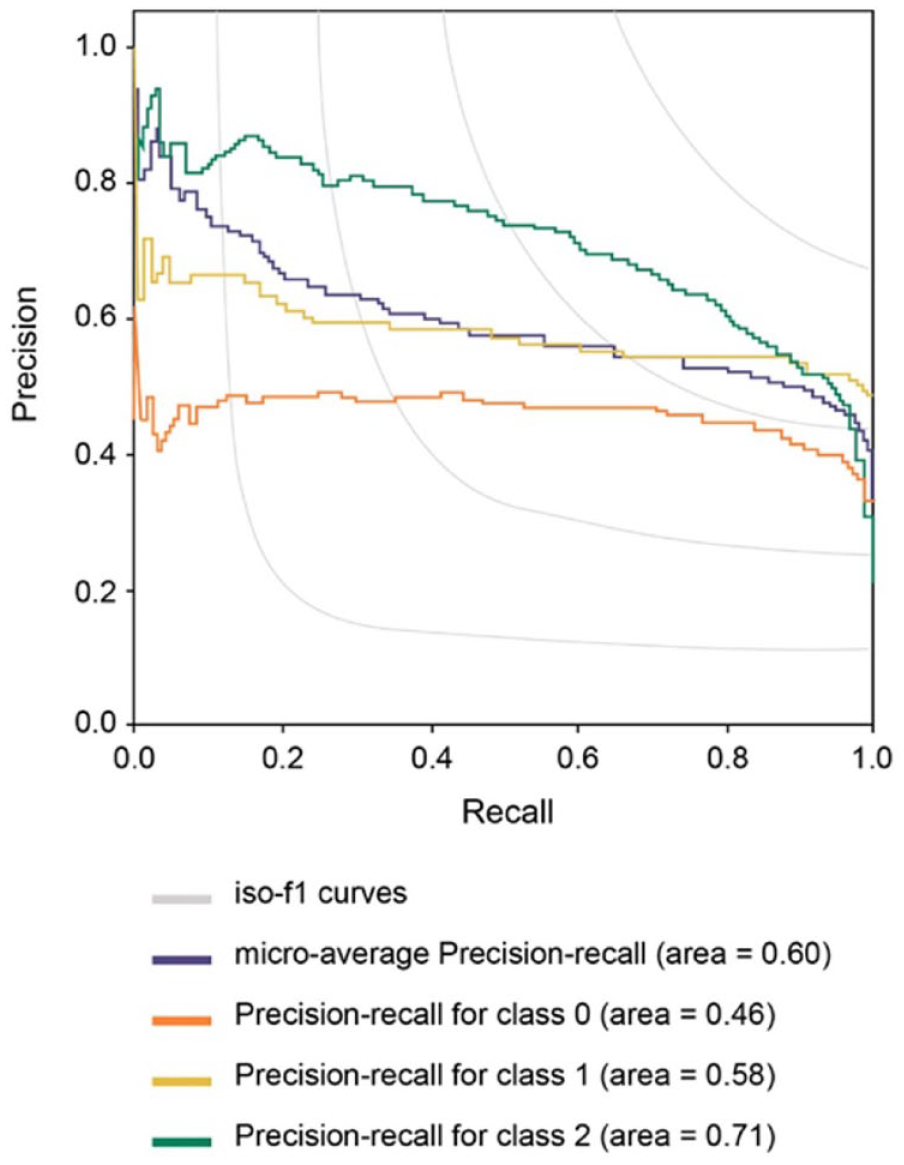
Precision-recall curve. Abbreviations: Class 0, never meeting HbA1c goals; Class 1, meeting but not maintaining HbA1c goals; Class 2, meeting and maintaining HbA1c goal.
Feature Sensitivity Analysis
After initial modeling showed that HbA1c in the pre-index period was a dominant feature (Figure 5), we were motivated to investigate the sensitivity of the model to features other than HbA1c. This was tested by fitting the XGBoost and logistic regression models to the study outcomes using only the HbA1c value. We found that the models trained with HbA1c alone were approximately as good at classifying patients as the models that were exposed to all features. Specifically, both models had macro averaged ROC AUC of 0.75 and micro-averaged ROC AUC 0.79.
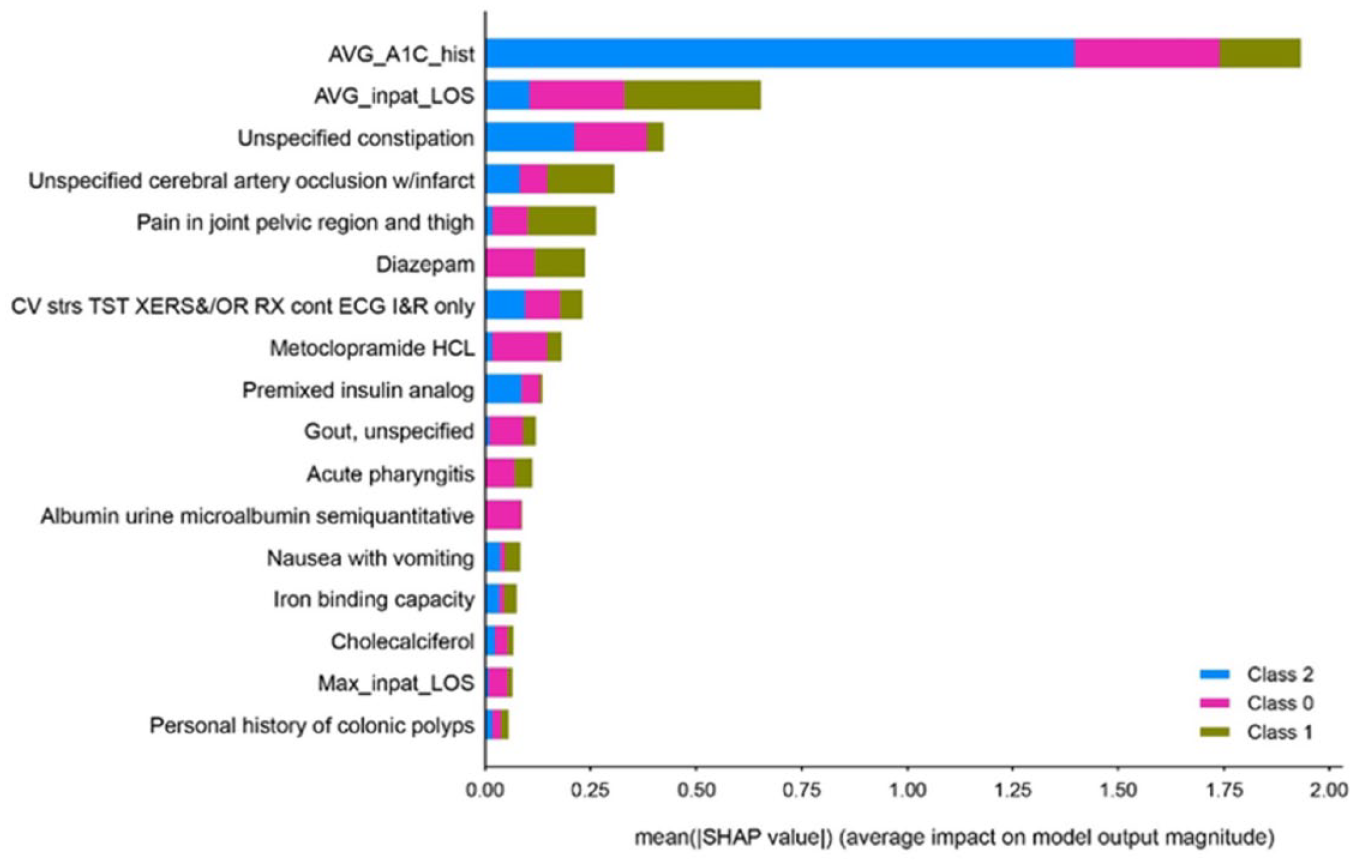
Feature importance (based on 12 months pre-index data). Abbreviations: AVG_A1C_hist, the average of HbA1c values in the history period; AVG_inpat_LOS, average inpatient length of stay; CV strs TST XERS&/OR Rx cont ECG I&R only, cardiovascular stress test using maximal or submaximal treadmill or bicycle exercise, continuous electrocardiographic monitoring, and/or pharmacological stress; Max_inpat_LOS, the maximum inpatient length of stay; Metoclopramide HCL, metoclopramide hydrochloride; SHAP, SHapley Additive exPlanations; Class 0, never meeting HbA1c goals; Class 1, meeting but not maintaining HbA1c goals; Class 2, meeting and maintaining HbA1c goal.
Cohort Definition Sensitivity Analysis
We further investigated a modeling scenario where only patients with HbA1c >8% at baseline were considered by the model. We found that after applying this filter, only 31 of 1450 (2.1%) patients remaining after the exclusion of patients in control at baseline achieved and maintained control in our model’s test data set. All the models trained to perform those classification tasks performed quite poorly at discriminating between the Class 0 and Class 1 populations, with no one-vs-rest area under ROC curve value exceeding 0.6, indicating poor model fit in this scenario (data not shown).
Discussion
Our results suggest that predictive modeling using routine health care data was reasonably accurate in classifying people with T2D initiating bolus insulin who would achieve and maintain HbA1c goals when including a population independent of prior HbA1c level. The model was less accurate in differentiating between those who never met and those who did not maintain goals. While not surprising that the model relied mainly on the prior year HbA1c, it was unexpected that this one parameter could generate predictions of similar quality as predictions incorporating additional parameters. Furthermore, we found that advanced modeling techniques trained on all available data at pre-index period were unable to predict the likelihood of achieving glycemic goals better than when using prior HbA1c alone.
Investigating the dependence of our model on prior HbA1c status showed that most of the model’s predictive ability was based on being able to differentiate between the patients who already were in control from the patients who were not. When limited to prediction of those not in control (HbA1c >8%), the model did not accurately classify patients who were likely to meet and maintain glycemic goal, in large part due to the extremely low proportion of individuals meeting goals. In this scenario, the model also performed poorly at distinguishing between those who never met and those who did not maintain HbA1c goals.
Overall, only about 20% of patients were able to meet and maintain modest glycemic control (HbA1c under 8%) in the first year after initiation of bolus insulin, and the majority of these individuals had values already under 8% upon initiation. Given the model’s poor performance at prediction of glycemic success when limited to those with elevated HbA1c values (above 8%) and only a very small proportion (2.1%) of individuals in our test data set who were able to meet and maintain control after they initiated bolus insulin with elevated HbA1c levels, our findings support other literature highlighting the benefits of initiating insulin earlier in the disease process15-17 and the dangers of clinical inertia.15,18 It may also reflect the challenges of initiating mealtime, multiple daily injection insulin therapy in the real-world, including the complexity of the regimen and required self-management activities, suboptimal dosing, and/or fear of hypoglycemia.19,20
Although our models have access to a large volume of historical claims data, administrative claims data only tell part of the story regarding a patient’s health status. Incorporation of other factors such as additional laboratory data (beyond HbA1c), behavioral markers, social determinants of health, or other factors could improve predictions.21-23 Different from the current study, Nagaraj et al found lower predictive performance when models were limited to just prior HbA1c alone. 21 This could be due to the value added with the other lab data from that electronic medical record (EMR)-based study in comparison to ours, which was limited to only administrative claims data and HbA1c values.
Consistent with other literature, prior HbA1c was a strong predictor of future glycemic levels, whether machine learning techniques were used or not. Nichols et al. reported that younger age, lower body mass index (BMI), and increased emotional distress about diabetes were all significant predictors (P < .05) of worse glycemic control. 23 In a univariate analysis, Home et al. reported that geographical region, baseline HbA1c level, lipid levels, and baseline insulin dose were the most powerful predictors of HbA1c change. 22 Another study reported that the key baseline characteristics associated with poor glycemic control over the 4 years of insulin therapy were baseline HbA1c, higher BMI, younger age, longer diabetes duration, more glucose-lowering drugs, using basal insulin alone, higher insulin dose, and female sex. 24
To the authors’ knowledge, this is the first predictive modeling study aimed at not only classifying whether people with T2D will reach HbA1c goals after insulin initiation, but also to differentiate between those who will maintain those goals versus those who will not. While our study arrived at reasonable predictions of those who will reach and maintain goals, we found this success was driven almost exclusively by having an HbA1c that was already under the 8% HbA1c threshold. We were limited to information only in an administrative claims database, which lacks rich clinical lab values, inpatient medication use, social determinants of health information, and other patient-reported behaviors and/or perspectives that could improve prediction. We speculate that earlier post-initiation visits with a health care practitioner could collect useful information to predict success with insulin initiation. Our intentions were to help identify different strata of people with T2D starting mealtime insulin who could benefit from different levels of patient education, support, and/or disease management tools and technologies.
Future work may involve testing the reproducibility in a different database, testing if additional clinical or demographic data would improve predictions, and determining why many people with T2D who are initiating a new insulin regimen appear not to achieve glycemic control.
Supplemental Material
sj-docx-1-dst-10.1177_19322968221098057 – Supplemental material for Predicting Response to Bolus Insulin Therapy in Patients With Type 2 Diabetes
Supplemental material, sj-docx-1-dst-10.1177_19322968221098057 for Predicting Response to Bolus Insulin Therapy in Patients With Type 2 Diabetes by Elizabeth L. Eby, Neal R. Kelly, Jeffrey K. Hertzberg, Moira C. Blodgett, Callie Stubbins, Raja H. Patel, Eric S Meadows, Brian D. Benneyworth and Douglas E. Faries in Journal of Diabetes Science and Technology
Footnotes
Acknowledgements
The authors thank Dr Nany Gulati and Dr Shirin Ghodke of Eli Lilly Services India Private Limited for writing and editorial contributions in preparation of this article.
Abbreviations
AUC, area under the curve; BMI, body mass index; dNHI, De-identified Normative Health Information; EMR, electronic medical record; GPI, generic product indicator; HbA1c, glycated hemoglobin; HEDIS, Healthcare Effectiveness Data and Information Set. PR, precision-recall; RCT, randomized controlled trial; ROC, receiver operating characteristic; T2D, type 2 diabetes.
Declaration of Conflicting Interests
The author(s) declared the following potential conflicts of interest with respect to the research, authorship, and/or publication of this article: NRK, JKH, MCB, CS, and RHP were employees of Optum Insight at the time this work was done and are currently employees of Optum Labs and stockholders of UnitedHealth Group. ELE, BDB, and DEF are employees and stockholders of Eli Lilly and Company; ESM was employee and stockholder of Eli Lilly and Company at the time when this study was conducte; ELE, ESM, BDB, DEF, was employed at Eli Lilly and Company when the study was conducted.
Funding
The author(s) disclosed receipt of the following financial support for the research, authorship, and/or publication of this article: The study was funded by Eli Lilly and Company.
Supplemental Material
Supplemental material for this article is available online.
References
Supplementary Material
Please find the following supplemental material available below.
For Open Access articles published under a Creative Commons License, all supplemental material carries the same license as the article it is associated with.
For non-Open Access articles published, all supplemental material carries a non-exclusive license, and permission requests for re-use of supplemental material or any part of supplemental material shall be sent directly to the copyright owner as specified in the copyright notice associated with the article.