
Abstract
Background:
Advanced decision support systems for type 1 diabetes (T1D) management often embed prediction modules, which allow T1D people to take preventive actions to avoid critical episodes like hypoglycemia. Real-time prediction of blood glucose (BG) concentration relies on a subject-specific model of glucose-insulin dynamics. Model parameter identification is usually based on the mean square error (MSE) cost function, and the model is usually used to predict BG at a single prediction horizon (PH). Finally, a hypo-alarm is raised if the predicted BG crosses a threshold. This work aims to show that real-time hypoglycemia forecasting can be improved by leveraging: a glucose-specific mean square error (gMSE) cost function in model’s parameters identification, and a “prediction-funnel,” that is, confidence intervals (CIs) for multiple PHs, within the hypo-alarm-raising strategy.
Methods:
Autoregressive integrated moving average with exogenous input (ARIMAX) models are selected to illustrate the proposed solution (use of gMSE and prediction-funnel) and its assessment against the conventional approach (MSE and single PH). The gMSE penalizes the model misfit in unsafe BG ranges (e.g., hypoglycemia), and the prediction-funnel allows raising an alarm by monitoring if the CIs cross a suitable threshold. The algorithms were evaluated by measuring precision (P), recall (R), F1-score (F1), false positive per day (FP/day), and time gain (TG) on a real dataset collected in 11 T1D individuals.
Results:
The best performance is achieved exploiting both the gMSE and the prediction-funnel: P = 65%, R = 88%, F1 = 75%, FP/day = 0.29, and mean TG = 15 minutes.
Conclusions:
The combined use of a glucose-specific metric and an alarm-raising strategy based on the prediction-funnel allows achieving a more effective and reliable hypoglycemia prediction algorithm.
Introduction
The technology advancements provided by continuous glucose monitoring (CGM) devices 1 and portable pumps for continuous subcutaneous insulin infusion (CSII) 2 have considerably improved the quality of life for subjects with type 1 diabetes (T1D). As pointed out in a recent report on artificial intelligence (AI) applications for diabetes management, 3 the combined use of CGM devices, insulin pumps, and dedicated mobile applications 4 brought the possibility of recording different type of information, for instance, CGM data, insulin, meal, physical activity, and self-reported life events. This enables the development of advanced AI-enabled decision support systems (DSSs), which are composite tools that implement multiple software modules to support the patient in the decision-making process.
One of the key elements that can be embedded in an advanced DSS is the prediction module. In fact, knowing ahead in timeif blood glucose (BG) is approaching dangerous levels allows patients to take proactive actions to mitigate or avoid critical episodes considerably improving T1D management.5 -10
Several research efforts investigated BG prediction, 11 and a number of literature studies focused on the challenge of forecasting hypoglycemic episodes (HEs in the short term). 12 More specifically, hypoglycemia prediction was addressed by either classification-based or regression-based approaches. Classification-based approaches consist in developing a binary classifier, 13 that is, an algorithm producing only two types of possible output, “impending hypoglycemia” or “no hypoglycemia predicted.” On the contrary, regression-based approaches are two-step procedures that (as a first step) predict the future glucose concentration after a certain prediction horizon (PH; usually chosen in the range 30-60 minutes) and then (as a second step) raise an alarm if the predicted value falls below a suitable threshold (usually, but not necessarily, 70 mg/dL). Predicted glucose levels in the first step can be obtained by using either linear14 -17 or nonlinear methodologies.18 -24
The purpose of this work is to improve the real-time forecasting of impending hypoglycemic events in T1D when CGM data, injected insulin, and meal intake information are available. For such a purpose, this work exploits autoregressive integrated moving average with exogenous input (ARIMAX) models which were proved to be effective in BG prediction25,26 and able to capture the essential dynamics of glucose-insulin regulation.14 -17,27,28 Moreover, they present two important characteristics: (1) the model parameter individualization (a key aspect to deal with the large intersubject and intrasubject variability of glucose-insulin dynamics) has been deeply studied, and powerful convergence results as well as statistical properties analysis are available in the literature 29 ; and (2) BG prediction can be computed using well-established and computationally convenient algorithms, such as those tracing back to Kalman filtering. 30
Specifically, this work demonstrates that there are two margins of improvement within conventional approaches employed in the literature for the real-time forecasting of hypoglycemic events. The first one is about the model identification procedure. In particular, instead of using the classical mean square error (MSE) cost function, we consider a glucose-specific mean square error (gMSE) cost function proposed in Del Favero et al. 31 This cost function, that applies an extra penalty to overestimation of low BG and to underestimation of high BG, enables the identification of more effective subject-tailored models for predicting HEs. The second margin of improvement regards the alarm-raising strategy. Instead of focusing on a single PH (as conventionally done in the literature), we consider simultaneously multiple PHs, accounting also for the expected decrease of accuracy in the prediction as the PH increases.
The novel personalized hypoglycemia prediction algorithm, based on the two innovations, is tested on real data collected in a population of 11 T1D individuals 32 and compared with the conventional approaches.
Overall, the new approach can predict hypoglycemic events with an average time anticipation of 15 minutes and, if compared with the conventional approach, it improves both F1-score (F1) and false positive per day (FP/day) achieving 75% versus 59% and 0.29 versus 0.77, respectively.
Methods
Database and Preprocessing
Data were taken from a previously published paper, 32 to which we refer the reader for any protocol details. Briefly, a group of 14 T1D individuals participated in the five-month test of the 24/7 use of a hybrid closed-loop insulin delivery system. Among the collected data, those of interest for the purpose of this work are as follows: CGM readings, recorded using a DexCom G4 Sensor (DexCom, Inc., San Diego, CA, USA) with a sampling period time of five minutes; time course of the insulin infusion delivered by the Roche Accu-Check Spirit Combo Device (Roche Diabetes Care, Inc., Indianapolis, IN, USA); amounts of carbohydrates (CHO) ingested at meals, as estimated and manually annotated by the participants.
Dealing with experimental data of different nature (CGM, insulin information, and CHO intake) poses some technical issues related to (1) device synchronization and (2) completeness of stored data. These problems are faced as follows:
All signals were aligned to the same time grid uniformly sampled at
If one or more signals presented gaps longer than 30 minutes, the entire data portion was discarded, as data off-line inference is deemed unreliable.
Then, for each patient, two consecutive portions of seven days without discarded data were selected. . The so-selected 14-day long dataset was then split in training set (first 7 days) and test set (last 7 days). Finally, the remaining short data gaps were reconstructed. The reconstruction strategy depends on whether the gap occurs in the training or in the test set. As the training set is entirely available during the model training phase, noncausal techniques can be used to reconstruct missing training data. In this case, we adopted a third-order spline interpolation. On the contrary, on the test set, glucose prediction has to be performed in real time, so missing data (about 1% on average per subject) were filled by exploiting the last few available CGM samples. In particular, a first-order polynomial is fitted by exploiting the last 15 minutes of recorded CGM data and then such a model is used to infer missing data.
Notably, 3 out of 14 subjects lacked a sufficiently long portion of consecutive data.
In summary, the analysis is conducted on data of 11 subjects. For each subject, seven days of training data and seven days of test data are available. In this population, 39 HEs were observed in the training set and 42 episodes occurred in the test set. This amounts to an average of one HE in every two days per patient.
Baseline: Conventional Approach to the Prediction of Impending Hypoglycemic Events
In this work, we considered as baseline for performance assessment a regression-based hypoglycemia prediction algorithm which consists of two steps: (1) identification of a model suited to predict future glucose levels in real time using CGM, insulin, and CHO information; and (2) threshold-crossing alarm-raising strategy.
For step 1, based on previous findings,25,26 we employ an ARIMAX model that can be described by the following equation:
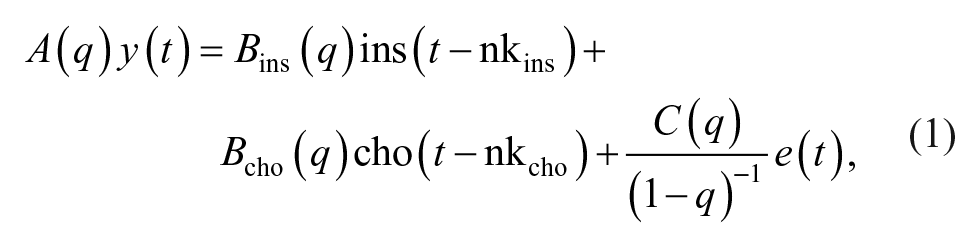
where
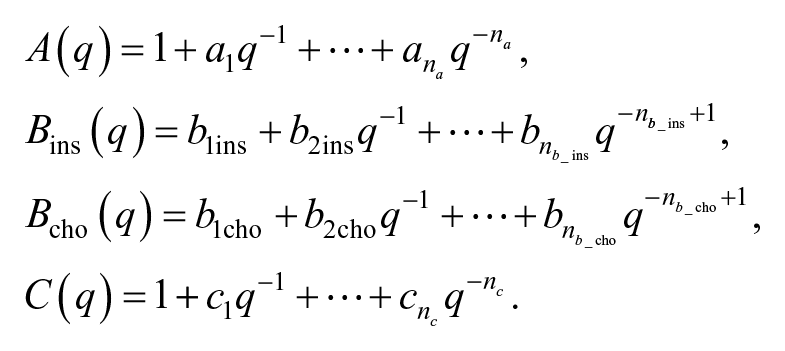
The order of the autoregressive part (i.e., the number of past CGM readings required by the model) is defined by na, and
To estimate the unknown model parameters
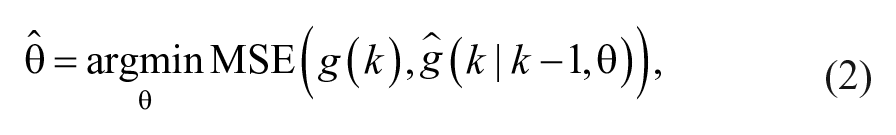
is considered, with
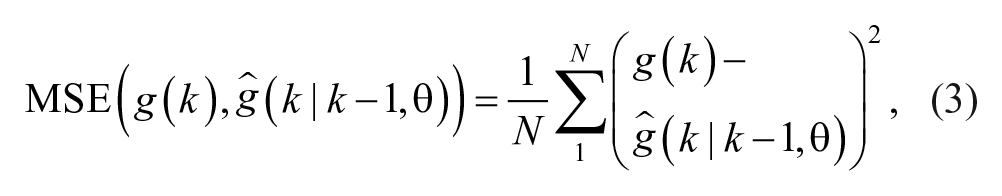
where N is the number of available data samples,
For step 2, a hypoglycemic alarm is raised if
Note that using this method, from now on called single-PH approach, at each step
A schematic representation of the conventional approach is reported in Figure 1 (upper panel).
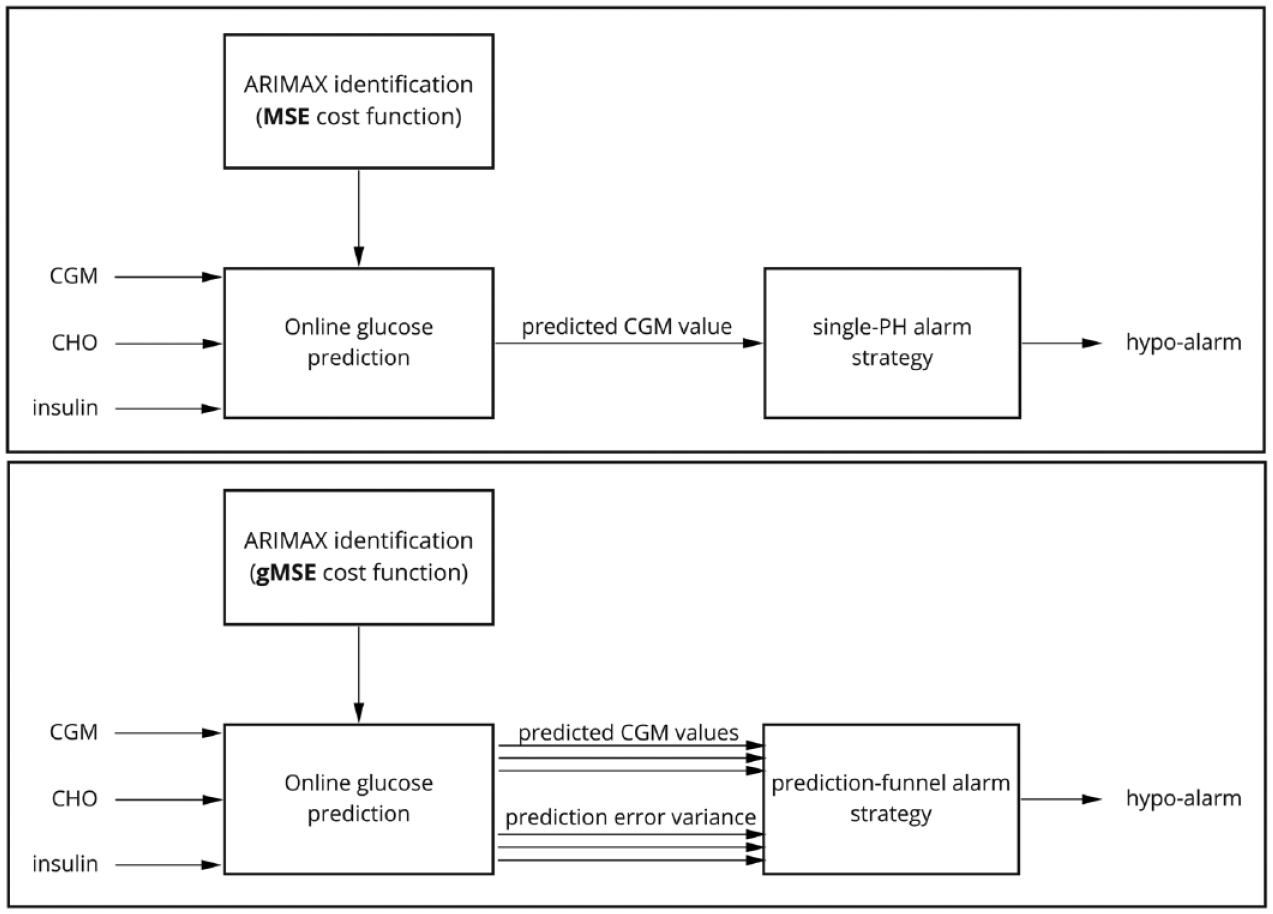
Schematic representation of the conventional approach (upper panel: MSE + single-PH alarm strategy) and the proposed approach (bottom panel: gMSE + prediction-funnel alarm strategy). Abbreviations: MSE, mean square error; PH, prediction horizon; gMSE, glucose-specific mean square error; ARIMAX, autoregressive integrated moving average with exogenous input; CGM, continuous glucose monitoring; CHO, carbohydrates.
Proposed Novel Approach to the Prediction of Impending Hypoglycemic Events
In this work, an innovation is introduced for each of the two steps of the conventional approach described in the previous paragraph. In step 1, the ARIMAX model is identified, at the individual subject level, using a glucose-specific cost function which takes into account the clinical impact of the prediction error. In step 2, the alarm strategy is based on a prediction-funnel approach, which exploits the possibility of handling the ARIMAX model within a Kalman filtering framework. A schematic representation of the proposed approach is reported in Figure 1 (bottom panel). Details of the innovations are described below.
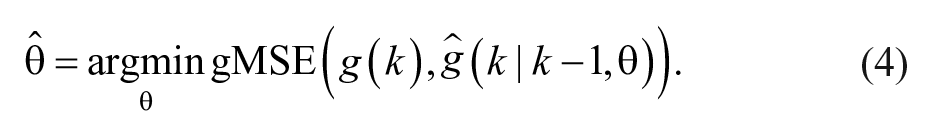
In step 1, the parameter estimation strategy relies on the minimization of an ad hoc cost function, called glucose-specific mean square error.
31
This metric, inspired by the well-known Clarke error grid (CEG),
33
modifies MSE to account for the clinical impact of the prediction error. This is done by increasing MSE values up to 250% in case of glucose overestimation during hypoglycemia and up to 200% in case of glucose underestimation in hyperglycemia. By doing so, overestimation in hypoglycemia is penalized more than underestimation in the same region. In fact, the first situation is clinically more dangerous: it could prevent the detection of a HE or induce an optimistic evaluation of its severity, leading to inadequate treatment. A symmetric reasoning holds for the case of hyperglycemia but, because hypoglycemia is deemed more dangerous than hyperglycemia, in the first case MSE is increased more (up to 250%) than in the second case (only up to 200%). The MSE is increased so that gMSE retains two fundamental mathematical properties of the original metric, smoothness and convexity, as they simplify the optimization involved in the parameter estimation. The estimated model parameter
By doing so, the identified model provides more accurate and clinically relevant prediction in the hyperglycemic and hypoglycemic range than in the normal range, thus permitting more effective hypoglycemia prediction.
In step 2, the novelty consists in the use of the prediction-funnel within the alarm-raising strategy. In devising the new strategy, the starting point was noting that several approaches proposed in the literature focused on one single prediction and they seldom account for prediction accuracy in detecting the crossing of the hypoglycemic threshold.14,15 So, the proposed alarm strategy considers simultaneously multiple predictions at different PHs, accounting also for their uncertainty.
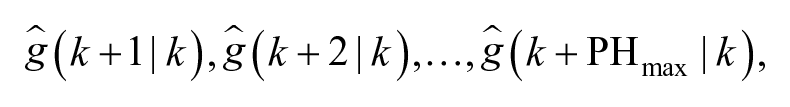
In particular, the model identified in step 1 is then used to build a Kalman predictor, as summarized in Supplemental Appendix A. Then, it is possible to obtain multiple predictions in a computationally efficient manner:
and the corresponding variance of the prediction error, for each PH:

This information is used to equip each prediction with a confidence interval (CI):
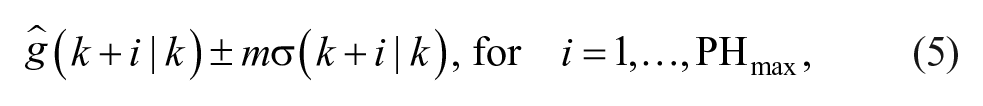
thus obtaining a prediction-funnel, shown in Figure 2.
The parameter
Once the prediction-funnel is obtained, the upper bound of the prediction’s CIs is monitored to detect whether it goes below the hypoglycemic threshold
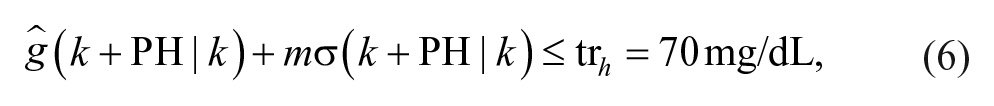
for any
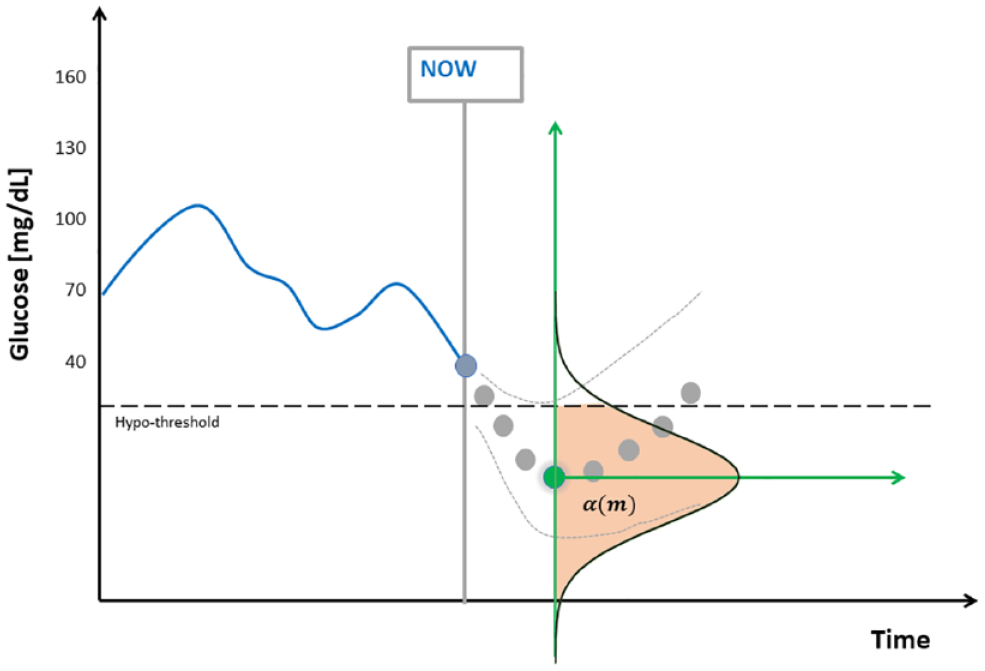
Illustration of the prediction-funnel and the role of
An alarm is then raised if this happens for at least
For instance, if
The tuning of the remaining degrees of freedom, the parameter
To gain a more intuitive feeling on the role of this parameter, it might be useful to interpret
Algorithm Assessment Criteria
Following the definition proposed in the consensus paper,
34
we say that an HE has occurred at time
True positive (TP) if an HE occurred at time
Remark: According to this definition, only the alarms which are relatively close to the HE are considered correct, while alarms too far apart in the past are not counted as TP;
False positive (FP) if an alarm is raised at time
False negative (FN) if an HE occurred at time
Finally, special attention is given to late alarms, defined as alarms at time
Once the events were labeled as TP, FP, and FN, the following metrics were used to evaluate the state-of-art and the proposed approaches:
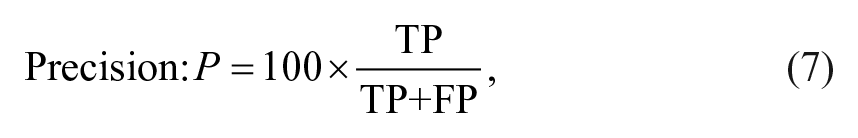

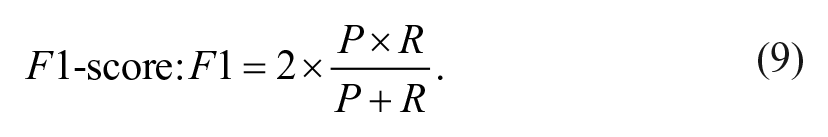
Precision is the fraction of the correct alarms over the total number of raised alarms. Recall, also known as sensitivity, is the fraction of correctly detected hypoglycemic events over the total number of events. F1 is the harmonic mean of the two previous metrics.
As the dataset is strongly unbalanced, we also evaluated the average number of FPs generated by the algorithm in one day (FP/day). Finally, we calculated the Time Gain (TG) of the hypoglycemic alarms as the time between when the alarm was raised by the algorithm and the start of the HE. According to the definition of TP, the maximum achievable TG is 60 minutes, while the lowest is 5 minutes.
We reported only the overall recall on the population (fraction of detected HEs with respect to all the events occurred in the population) and the overall precision, as well as the overall F1. To assess the statistical significance of the differences observed in recall and precision, a chi-square test of independence with 1 degree of freedom was applied, as suggested in Yeh. 35 Moreover, the TG is reported as mean and standard deviation (SD) over all the successfull detections (regardless of the patient in which the detection occurred).
While the overall test set (seven monitoring days for each subject) includes 42 HEs, single-patient data present only a small number of HEs (on average, one every two days for each subject), and thus single-patient-level analysis is omitted. In fact, single-patient recall would be strongly quantized: for instance, in a patient with two HEs, recall can take only three values: 100%, 50%, or 0%.
Results
Table 1 shows the hypoglycemia prediction performances of several configurations of the described prediction algorithms. In particular, the first row reports the baseline performance achieved by the conventional algorithm using individualized models, identified minimizing MSE, and considering only one PH (PH = 30 minutes). The last row of the table reports the performance achieved by the new algorithm proposed in this work that includes both the improvements induced (the use of gMSE for model identification and the prediction-funnel-based strategy). To elucidate the contribution of each proposed innovations to the final performance, Table 1 reports also the performance achieved with inclusion of one modification at the time (gMSE + single PH and MSE + prediction-funnel). Moreover, different values of the hyper-parameters are investigated.
Comparison of Hypoglycemia Prediction Performance.
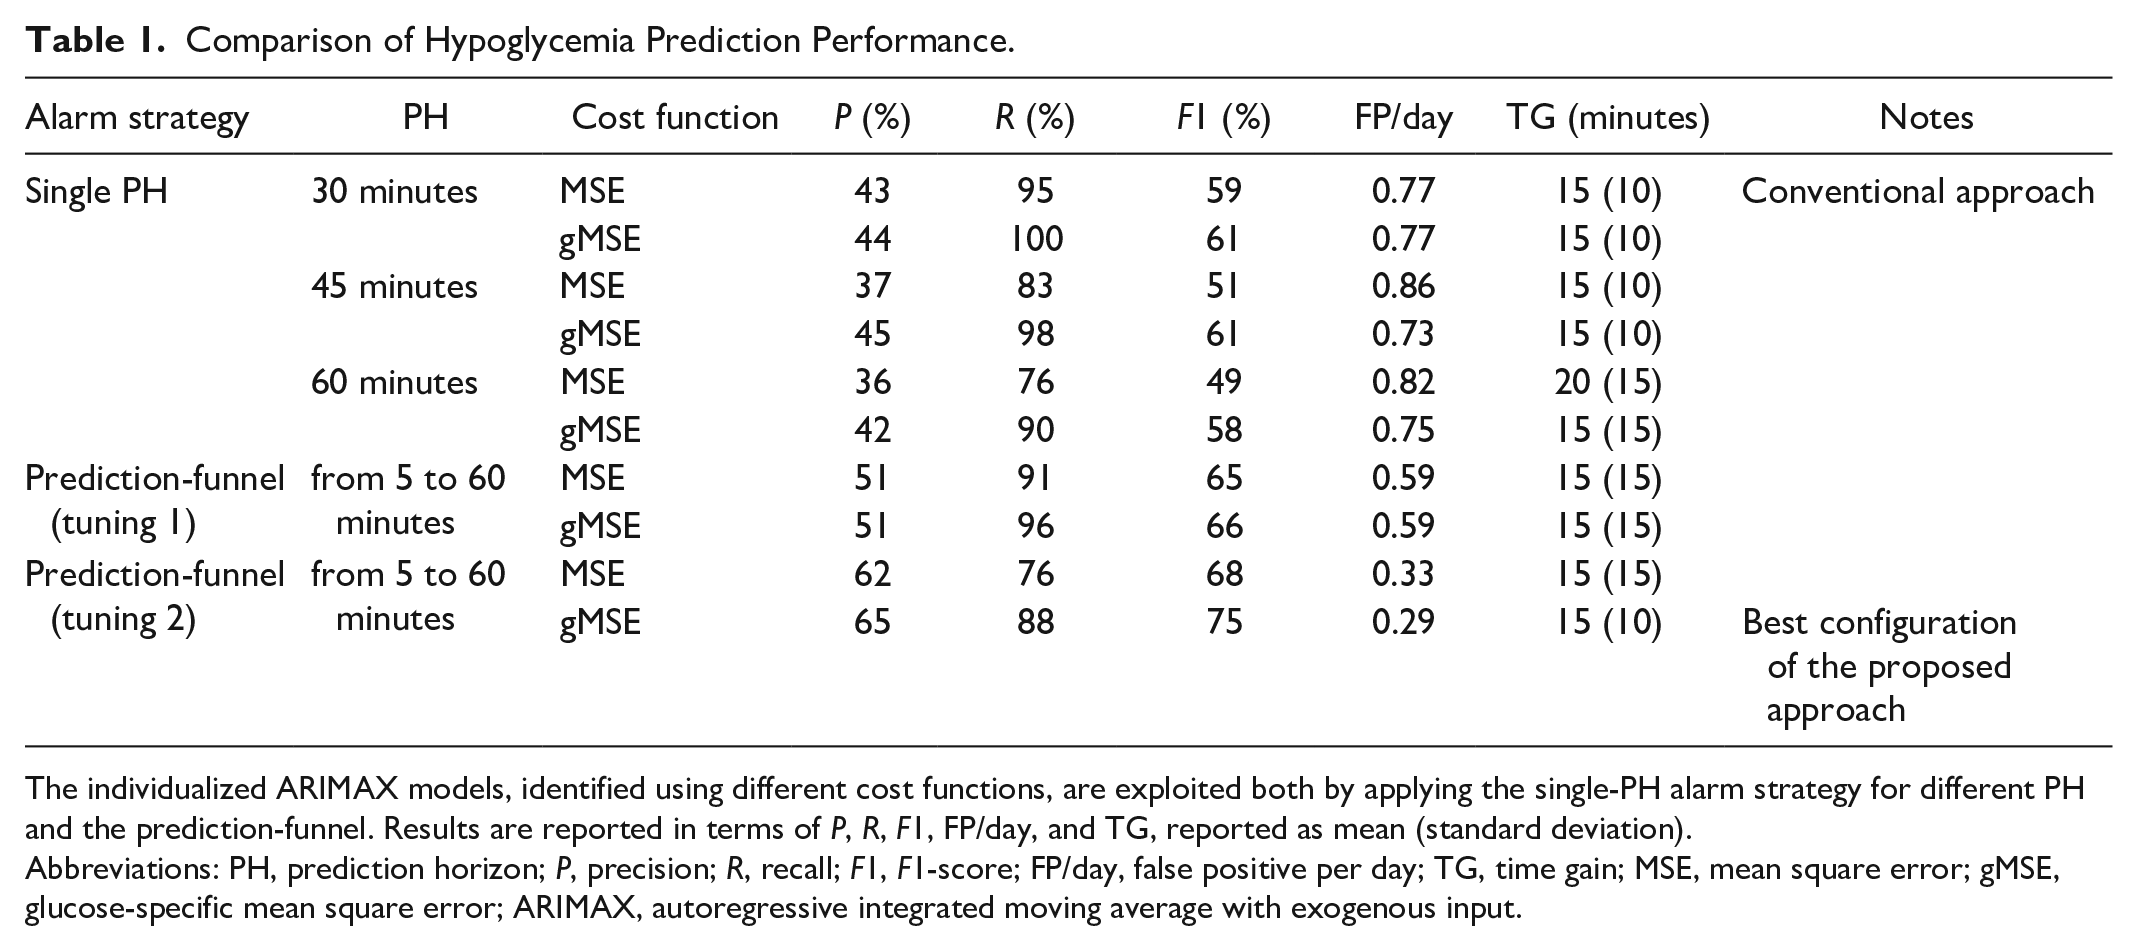
The individualized ARIMAX models, identified using different cost functions, are exploited both by applying the single-PH alarm strategy for different PH and the prediction-funnel. Results are reported in terms of P, R, F1, FP/day, and TG, reported as mean (standard deviation).
Abbreviations: PH, prediction horizon; P, precision; R, recall; F1, F1-score; FP/day, false positive per day; TG, time gain; MSE, mean square error; gMSE, glucose-specific mean square error; ARIMAX, autoregressive integrated moving average with exogenous input.
Focusing first on the single-PH strategy, we investigated the impact of PH on the prediction performance of the state-of-art approach, by evaluating three possible PHs: PH = 30, 45, and 60 minutes. The best results are achieved with the PH = 30 minutes, that is, in fact, commonly adopted in literature. In particular, the larger the PH, the higher the TG, but at the expense of a worse P, R, and FP/day. For instance, comparing the state-of-art approach with PH = 30 minutes and with PH = 60 minutes, we can see that TG increases from 15 to 20 minutes (mean values), but P falls from 43% to 36% and R from 95% to 76%, while FP/day increases from 0.77 to 0.82.
The introduction of the gMSE in place of the MSE improves both the precision and the recall with respect to the state-of-art approach. This holds true for all considered values of PH. Considering, for instance, PH = 30 minutes, with the use of gMSE, P increases from 43% to 44%, R from 95% to 100%, while FP/day and TG are almost the same.
We then investigated the impact of the improved alarm strategy (prediction-funnel-based instead of using a single PH). In particular, two different approaches to the tuning of the parameter
The improvement granted by the prediction-funnel is clearly visible with tuning 1 that offers higher precision, higher F1, and less FP/day with respect to the state of art: P increases from 43% to 51%, F1 from 59% to 65%, and FP/day decreased from 0.77 to 0.59. This improvement is achieved while retaining similar recall (R from 95% to 91%). The performances of tuning 2 are more difficult to interpret, because it selects a different trade-off between precision and recall. Specifically, it renounces to some recall in favor of a better precision and less FP/day, leading to an overall improvement in the F1.
Finally, combining the two improvements, the algorithm proposed in this work outperforms the state of art. Once again, this is clearly visible with tuning 1 that grants similar recall and TG of the state of art (above 95%) but with higher precision, F1, and less FPs: P from 43% to 51%, F1 from 59% to 69%, and FP/day decreased from 0.77 to 0.59. By adopting a slightly more conservative approach, proposed in tuning 2, precision and FPs can be further improved (P = 65%, FP/day = 0.29, i.e., about one every three days), at the expenses of a deterioration of the recall (R = 88%). This new trade-off offers a better F1 that reaches 75%. The chi-square test proposed in Yeh 35 shows that the proposed approach has statistically significant better precision and FP/day, with respect to the conventional approach (P < .01 and P < .0001, respectively). No statstistically significant difference is found in the recall of the two approaches (P = .22).
Remark
According to HE definition formulated in Danne et al, 34 an event in which CGM data fall below the hypoglycemic threshold only for one-time or two-time samples should not be considered an hypoglycemia. However, if an alarm is raised in these situations (that we will call in the following quasi-hypoglycemic episodes, qHE), such an alarm will count as a FP. FP error caused by a qHE could be considered less clinically relevant than other FPs, therefore we also report how many FPs are of this kind. For the state-of-art method (MSE + single-PH approach, PH = 30 minutes), 26% of the recorded FPs were associated to qHE, while this percentage raises to 34% with the newly proposed algorithm (gMSE + prediction-funnel), further supporting the superiority of the proposed algorithm. Discarding these events from the FP count, as frequently done in the literature, would reduce the FP/day from 0.77 to 0.62 and increase the precision from 43% to 54% for the state-of-art approach. Similarly it would decrease FP/day from 0.29 to 0.21 and increase P from 65% to 73% for the proposed approach. Another consequence of the HE definition adopted is that even a nonpredictive hypoglycemia detection algorithm, simply based on the CGM trace crossing the 70 mg/dL threshold, may raise FP alarms (FP/day = 0.2). In fact, according to our definition of TP, the CGM reading produces only late hypo-alarms (events that will be detected exactly whenever they started: TG = 0 minutes). As a consequence, TP count is bound to be 0, and both recall and precision are necessarily 0 (i.e., P = R = 0).
Discussion
In this work, we explored a new approach to predict hypoglycemic events that is based on an individualized ARIMAX models, identified by using a cost function specifically designed to account for the clinical impact of prediction error, and on a novel alarm strategy that considers the entire prediction-funnel. The results show that models identified via gMSE minimization provide better hypoglycemia prediction performances than models based on MSE. Furthermore, results show that the new alarm-raising strategy based on the prediction-funnel improves hypoglycemia forecasting, thanks to the possibility of exploiting multiple PHs. The adoption of both the proposed improvements grants the best performances.
While the presented results showed the benefit of including the two proposed novelties in the conventional, regression-based, linear hypoglycemia prediction algorithm, it might be of interest to investigate how the prediction performance of the improved algorithm positions with respect to other contributions. To this aim, we propose a tentative comparison based on the results reported in the previously mentioned works.10,14,16,19,20,22 -24 However, it is difficult to define a fair comparison: different definition of the events might significantly impact on the final metrics, as shown by the previous section, where a seemingly minor modification in the definition of HE has nonnegligible impact on FP/day and precision. Moreover, different dataset might be collected in very different conditions (highly controlled clinical trials vs real life) introducing a further confounding factor. Yang et al, 14 Dave et al, 19 and Gadaleta et al 20 reached a recall, respectively, of about 93%, 93%, and 86%, comparable or slightly superior to the recall of our algorithm, with R = 88%, at the expense of lower precision: about 24%, 38%, and 62%, while the proposed approach in this work achieved P = 65%. Similarly, Yang et al 14 and Daskalaki et al 24 achieved the remarkable recall of R = 100%, but at the expense of a very high number of FPs (more than one FP/day). Eren-Oruklu et al, 16 Toffanin et al, 17 and Georga et al, 23 showed a similar recall to the one obtained in this work (89%, 94%, and 94%) with a better precision (78%, 90%, and 77%). However, the authors adopted a more permissive HE definition. For instance, in Georga et al 23 the alarms raised after the CGM has crossed the hypoglycemic threshold were considered TP whereas in this work we consider these late alarms as FNs. In Eren-Oruklu et al, 16 performance was assessed using controlled inpatient data. Eljil et al 22 showed a slightly inferior recall (86%) and did not report any metrics related to false alarms. To overcome the above-mentioned limitations in comparing literature contributions with the proposed algorithm, we provided the performance granted by a baseline based on astate-of-art approach. Remarkably, such a baseline is found to be a challenging competitor: its performance is in line —or even outperform— some of the performances reported in litterature, for instance.14,19,20 However, the proposed solution largely improves the conventional approach in terms of precision (65% vs 43%, P < .01), FP/day (0.29 vs 0.77, P < .0001), and F1 (75% vs 59%) at the expenses of a slightly but not statistically significant (P = .22) deterioration of the recall (88% vs 95%).
In this work, we focused on personalized models to deal with the large interindividual variability characterizing T1D population. The slow changes in patient physiology occurring over the weeks (intrapatient variability) are not evaluated as this contribution focuses on one week of data. A natural option to deal with intrapatient variability is to resort to recursive model identification techniques, well-established methods for tracking the changes in patient dynamic by updating the model every time a new measurement becomes available.36 -38 Nevertheless, given the relatively slow time scale of intrapatient changes, daily or weekly updates of the model, simply obtained by periodically repeating the proposed model identification procedure on the most recent seven days of data, are expected to be sufficient.
As a final comment, we report that real-time data-gap filling method we adopted—namely, first-order polynomial extrapolation of the last 15 minutes of CGM data—was compared with the simpler zero-order hold. No practical difference in the final performance is observable, suggesting that the simpler method (zero-order hold) can be used in place of the more elaborated strategy proposed. This is not surprising, in fact gaps are relatively rare events (1% of the expected data in the test set) and the gaps affecting hypoglycemia prediction are only those occurring near hypoglycemic events (also rare events). Moreover, visual inspection of the dataset confirms that the simultaneous occurrence of hypoglycemia and data gaps is extremely rare. This makes the choice of the interpolation method of little practical impact.
Conclusions and Future Developments
In this work, we proposed a new algorithm to predict in real-time upcoming hypoglycemic events that can be embedded in an advanced DSS to support the T1D patient during the decision-making process. To tackle the challenging task of hypoglycemia prediction, the novel approach combines, on one hand, models which are identified via minimization of a glucose-specific cost function to improve the model’s prediction capability in the hypoglycemic region and, on the other hand, an alarm-raising strategy that is based on the prediction-funnel. Notably, due to the large inter-intra subject variability characterizing T1D patients, the proposed algorithm requires individualized models. Hypoglycemic prediction performance is evaluated on 11 T1D individuals, and the best results, P = 65%, R = 88%, F1 = 75%, FP/day = 0.29, and TG = 15 (10) minutes, are obtained by the proposed approach. Therefore, the use of a specific metric to improve prediction in the hypoglycemic region, as well as the prediction-funnel, allows achieving a more effective and reliable hypoglycemia prediction algorithm. While the proposed hypoglycemia prediction algorithm is based on linear regression-based techniques, the two proposed improvements can be exploited in other machine-learning or nonlinear techniques (with adequate adjustments). Future works will investigate this option.
Supplemental Material
sj-docx-1-dst-10.1177_19322968221093665 – Supplemental material for Combined Use of Glucose-Specific Model Identification and Alarm Strategy Based on Prediction-Funnel to Improve Online Forecasting of Hypoglycemic Events
Supplemental material, sj-docx-1-dst-10.1177_19322968221093665 for Combined Use of Glucose-Specific Model Identification and Alarm Strategy Based on Prediction-Funnel to Improve Online Forecasting of Hypoglycemic Events by Simone Faccioli, Francesco Prendin, Andrea Facchinetti, Giovanni Sparacino and Simone Del Favero in Journal of Diabetes Science and Technology
Footnotes
Abbreviations
AI, artificial intelligence; ARIMAX, autoregressive integrated moving average with exogenous input; BG, blood glucose; CEG, Clarke error grid; CGM, continuous glucose monitoring; CHO, carbohydrates; CI, confidence interval; CSII, continuous subcutaneous glucose infusion; DSS, decision support system; F1, F1-score; FN, false negative; FP, false positive; FP/day, false positive per day; gMSE, glucose-specific mean square error; HE, hypoglycemic episode; MSE, mean square error; P, precision; PH, prediction horizon; R, recall; T1D, type 1 diabetes; TG, time gain; TP, true positive.
Authors’ Note
DexCom, Inc. (San Diego, CA, USA) did not edit or influenced the material presented. None of the data, or data or analysis derived from the data, are derived using DexCom, Inc., proprietary algorithms in any way. Nor does anything in this paper, including descriptions of algorithms and the state of art, purport to describe or use such proprietary algorithms. However, the algorithms disclosed in this paper may be covered by one or more US and international pending patents and applications. The source of the data is the Juvenile Diabetes Research Foundation (JDRF) Artificial Pancreas Consortium Coordinating Center (JDRFAPPCC), but the analyses, content, and conclusions presented herein are solely the responsibility of the authors and have not been reviewed or approved by the JDRFAPPCC. The public CTR3 dataset was financed by JDRF through the grants JDRF 22-2011-649 and JDRF 17-2013-509.
Declaration of Conflicting Interests
The author(s) declared no potential conflicts of interest with respect to the research, authorship, and/or publication of this article.
Funding
The author(s) disclosed receipt of the following financial support for the research, authorship, and/or publication of this article: DexCom, Inc. (San Diego, CA, USA) provided financial support to the research presented in this work. This work was also supported by MIUR (Italian Ministry of Education, Universities and Research) through the initiatives “SIR: Scientific Independence of Young Researchers” (project “Learn4AP: Patient-Specific Models for an Adaptive, Fault-Tolerant Artificial Pancreas,” ID: RBSI14JYM2) and “Departments of Excellence” (Law 232/2016).
Supplemental Material
Supplemental material for this article is available online.
References
Supplementary Material
Please find the following supplemental material available below.
For Open Access articles published under a Creative Commons License, all supplemental material carries the same license as the article it is associated with.
For non-Open Access articles published, all supplemental material carries a non-exclusive license, and permission requests for re-use of supplemental material or any part of supplemental material shall be sent directly to the copyright owner as specified in the copyright notice associated with the article.