
Abstract
Background:
Intensive insulin therapy has documented benefits but may also come at the expense of a higher risk of hypoglycemia. Hypoglycemia is associated with higher all-cause mortality and nocturnal hypoglycemia has been associated with the sudden dead-in-bed syndrome. This proof-of-concept study sought to investigate if nocturnal hypoglycemia can be predicted.
Method:
Continuous glucose monitoring, meal, insulin, and demographics data from 463 people with type 1 diabetes were obtained from a clinical trial. A total of 4721 nights without or with hypoglycemia (429) were available including data from three consecutive days before the night. Thirty-two features were calculated based on these data. Data were split into 20% participants for evaluation and 80% for training. The optimal feature subset was found from forward selection of the 80% participants with linear discriminant analysis as basis for the classifier.
Results:
The forward selection resulted in a feature subset of four features. The evaluation resulted in an area under the receiver operating characteristics curve (ROC-AUC) of 0.79 leading to a sensitivity and a specificity of, e.g., 75% and 70%.
Conclusions:
It was possible to predict nocturnal hypoglycemic episodes with a ROC-AUC of 0.79. A warning at bedtime about nocturnal hypoglycemia could be of great help for people with diabetes to enable preventive actions. Further development of the proposed algorithm is needed for implementation in everyday practice.
Keywords
Introduction
Intensive insulin therapy has documented microvascular benefits in both type 1 diabetes (T1D) and type 2 diabetes (T2D),1,2 but a clear macrovascular benefit is more uncertain.3,4 In a large trial of T2D people, intensive insulin therapy even resulted in increased mortality. 3 More explanations may be linked to this outcome, but the role of hypoglycemia should be considered. Administration of insulin lead to fatal hypoglycemia in people without diabetes and might do so in people with diabetes. 5 In a study by Zoungas et al 6 of 11 140 people with T2D, hypoglycemia was associated with an almost threefold higher all-cause mortality. Especially, during night where people are typically unable to react to declining blood glucose due to deteriorated hypoglycemic symptoms, hypoglycemia is an issue. 7 Nocturnal hypoglycemia has been associated with increased morbidity and these prolonged hypoglycemic episodes (two to four hours) often precedes seizure activity in people with T1D. 8 Even more severe, the nocturnal hypoglycemic events have been associated with the sudden dead-in-bed syndrome.7,9,10 The resultant fear of hypoglycemia may lead to treatment incompliance, which is a major long-term issue. 11 All these discouraging associations are the reason why hypoglycemia is said to be the critical limiting factor for glycemic management of people with diabetes mellitus. 12
Continuous glucose monitoring (CGM) may as a technology be reducing the risk of hypoglycemia. In a study by Gimenez et al, 13 real-time CGM reduced time spent in hypoglycemia, but whether risk of nocturnal hypoglycemia was reduced is unknown. Several other attempts to prevent hypoglycemia have been carried out. In a study by Dassau et al, 14 an algorithm based on five individual algorithms used CGM data to predict hypoglycemia with different prediction horizons. At a horizon of 35 minutes, they were able to predict 91% of the hypoglycemic episodes (<60 mg/dL). In another study by Sudharsan et al, 15 a prediction of hypoglycemia in the next 24 hours of 92% and 70% was obtained from self-measured blood glucose (SMBG) values. Few studies have investigated the possibility of predicting nocturnal hypoglycemic episodes. A prediction in the evening before bedtime would enable the person with diabetes to adjust long-term glucose-affecting factors, such as basal insulin. On one hand, nocturnal episodes are simpler, because in a typical situation, meals are not consumed, insulin is not administered, and physical activity is absent. On the other hand, a hypoglycemic episode may occur at any time of the night and the prediction horizon thus varies, which makes the prediction difficult.
This proof-of-concept study sought to investigate if nocturnal hypoglycemia can be predicted to enable the person with diabetes to take preventive action, such as adjusting basal insulin.
Methods
Study Data
Data used in this study are from the Onset 5 trial by Novo Nordisk A/S (clinicaltrials.gov NCT number NCT02825251). It was possible to access these data through a data access request submitted to and approved by Novo Nordisk A/S (proposal number 2018.004). The original trial was a parallel group trial with a four-week run-in and a 16-week treatment period comparing the effect and safety of continuous subcutaneous insulin infusion of Fiasp® vs NovoRapid® in adult people with T1D. During the trial, participants were monitored with a blinded CGM (G4 platinum, Dexcom, San Diego, CA, United States) three times of two weeks: one time before randomization, in the middle of the treatment period, and in the end of the treatment period. Half of the participants were allowed to use their own CGM throughout the trial in conjunction with the blinded CGM. Data from the three periods were extracted for this study. A total of 472 people were randomized in the clinical trial.
A CGM profile was defined as a night with or without hypoglycemia preceding three days of CGM. The night is now denoted as the “event.” Only profiles where CGM measurements were available for more than 80% of the time were kept. Furthermore, the profile should have at least one meal and one bolus dose registered the evening before the last night.
A nocturnal hypoglycemic episode was defined as three consecutive CGM measurements (at least 15 minutes) below or equal to 54 mg/dL (3.0 mmol/L)—a level 2 hypoglycemia 16 —during the time interval of 00:01 to 05:59. Demographic information of each participant was also utilized, and included age, sex, diabetes duration, Glycated hemoglobin (HbA1c) at baseline (just before randomization), and height and weight at baseline. Missing demographic values were imputed as the average of the remaining participants’ values.
Prediction setup
Machine learning approaches were utilized to predict the nocturnal hypoglycemic events. Step 1 included the extraction of features. Step 2 included the splitting up of data for training and evaluation. Step 3 included the selection of features. Step 4 included the evaluation of the classifier with the resultant features.
In the first step, features were extracted from CGM, meals, and bolus insulin data. Different kinds of features were calculated based on the CGM measurements in different intervals and of the meals and bolus insulin registered just before the event. The features and their names can be seen in Table 1. Glycemic variability percentage 17 is a measure of the fluctuation within the CGM signal. It is calculated as

where ∆
List of Features Extracted from Continuous Glucose Monitoring, Insulin, Meal, and Demographics Data.
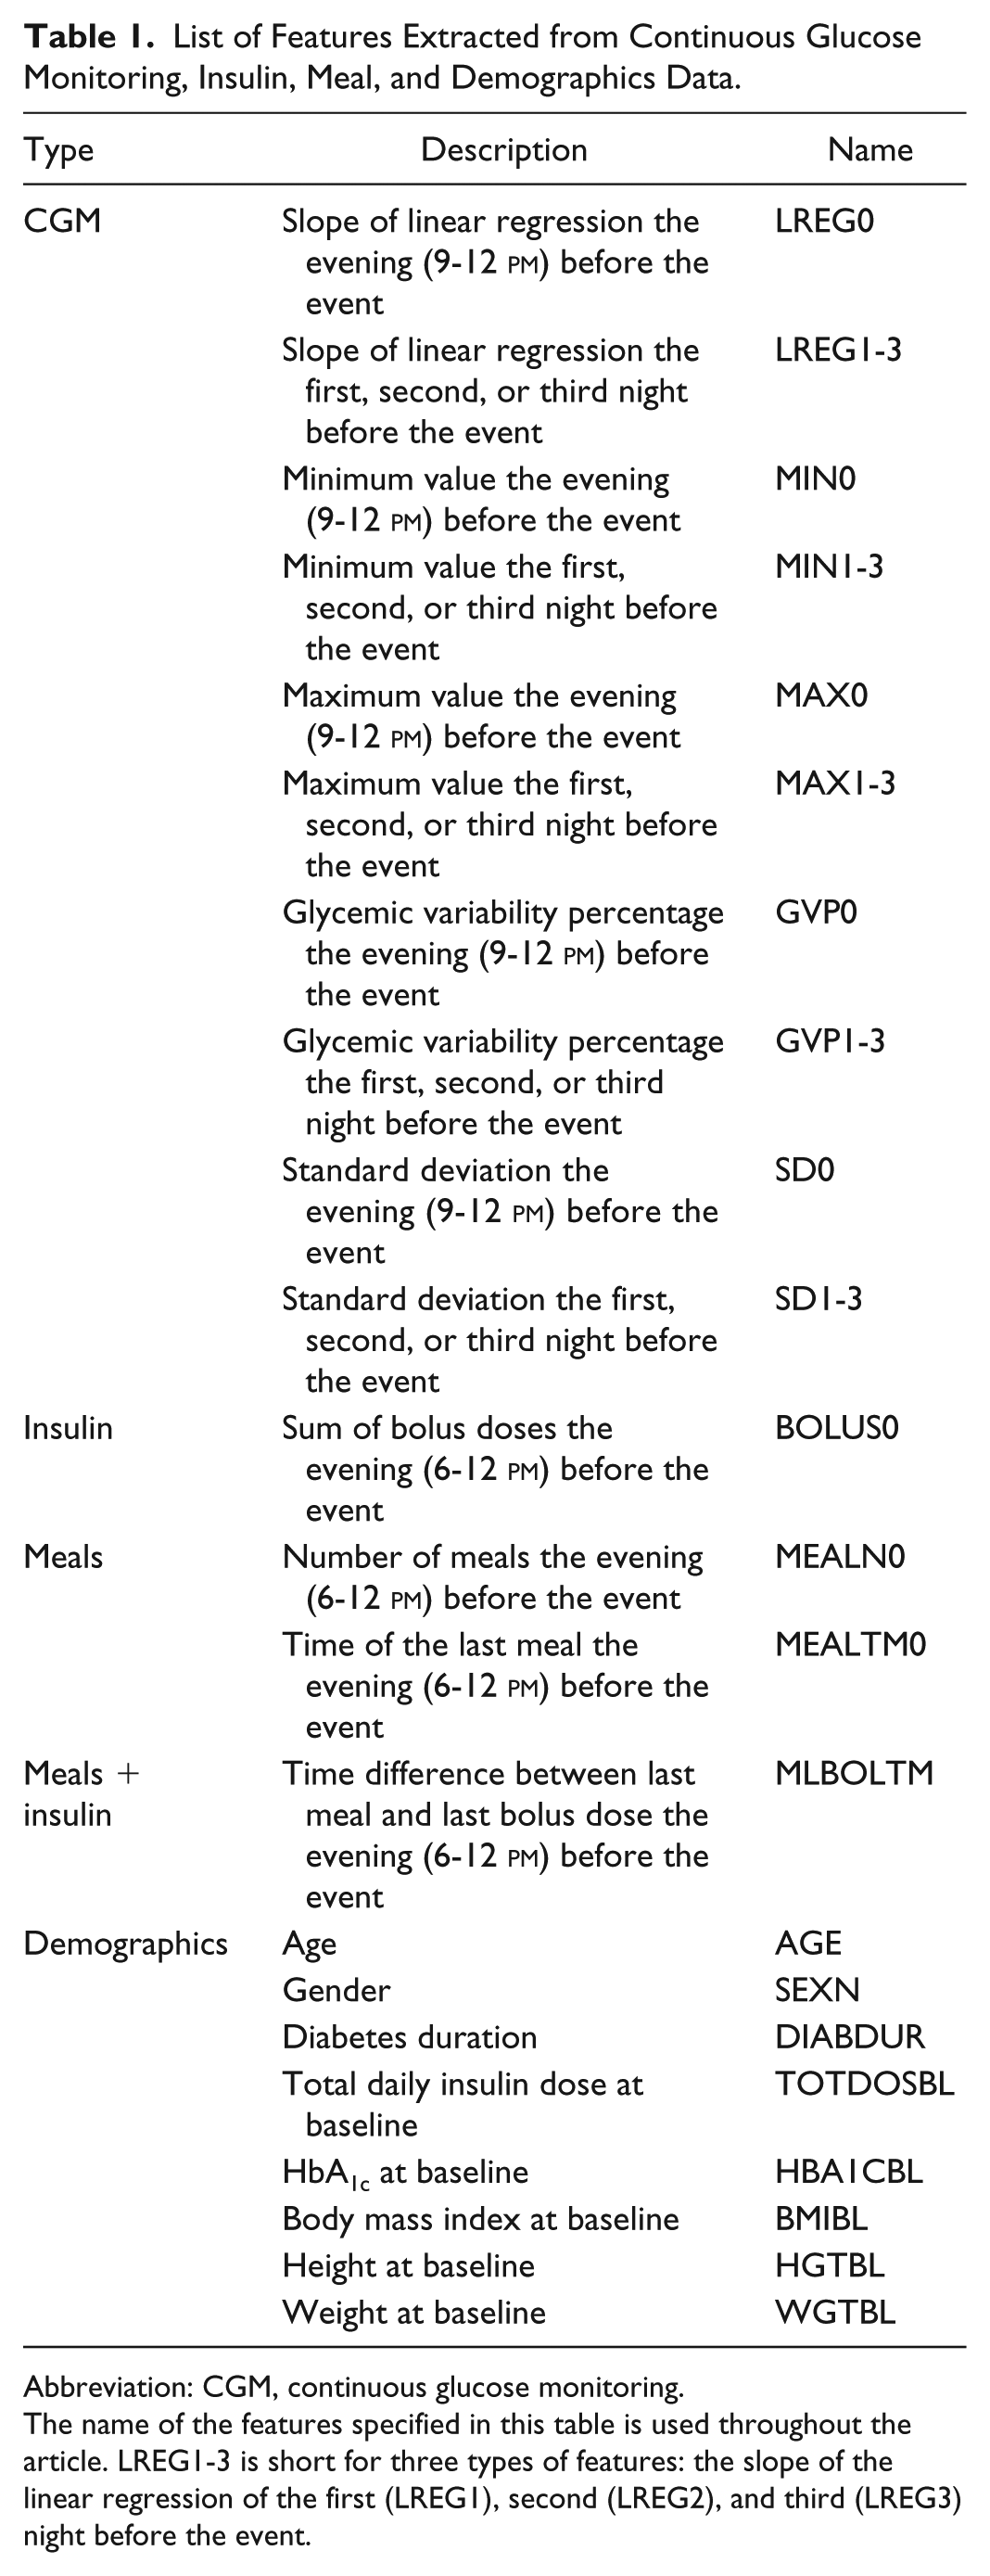
Abbreviation: CGM, continuous glucose monitoring.
The name of the features specified in this table is used throughout the article. LREG1-3 is short for three types of features: the slope of the linear regression of the first (LREG1), second (LREG2), and third (LREG3) night before the event.
In the second step, 20% of the participants were randomly selected and their associated data kept aside for later evaluation. The last 80% were used in the third step to select the features with the most predictive information. A forward selection with 15 rounds was used for feature selection and the feature subset with the highest area under the receiver operating characteristics curve (ROC-AUC) was selected for final evaluation. The classifier used in steps 3 and 4 was a linear discriminant function (LDA). In the first round of the forward selection, each feature was tested individually in an LDA classifier and the one with the highest ROC-AUC was selected. In the second round, the best feature from the first round was then tested in a combination with each of the rest of the features and the two-feature subset with the highest ROC-AUC was then selected for the next round and so forth. Each test was performed with fivefold cross-validation where 20% of the training data were used for testing the classifier and the remaining training data were used for training the classifier. This was then done five times where a new set of 20% of the data was selected randomly each time. The best feature subset was selected based on the highest ROC-AUC. In step 4, the best feature subset was then tested on 20% unknown evaluation data to provide an estimate of the generalizability. The complete setup is illustrated in Figure 1.
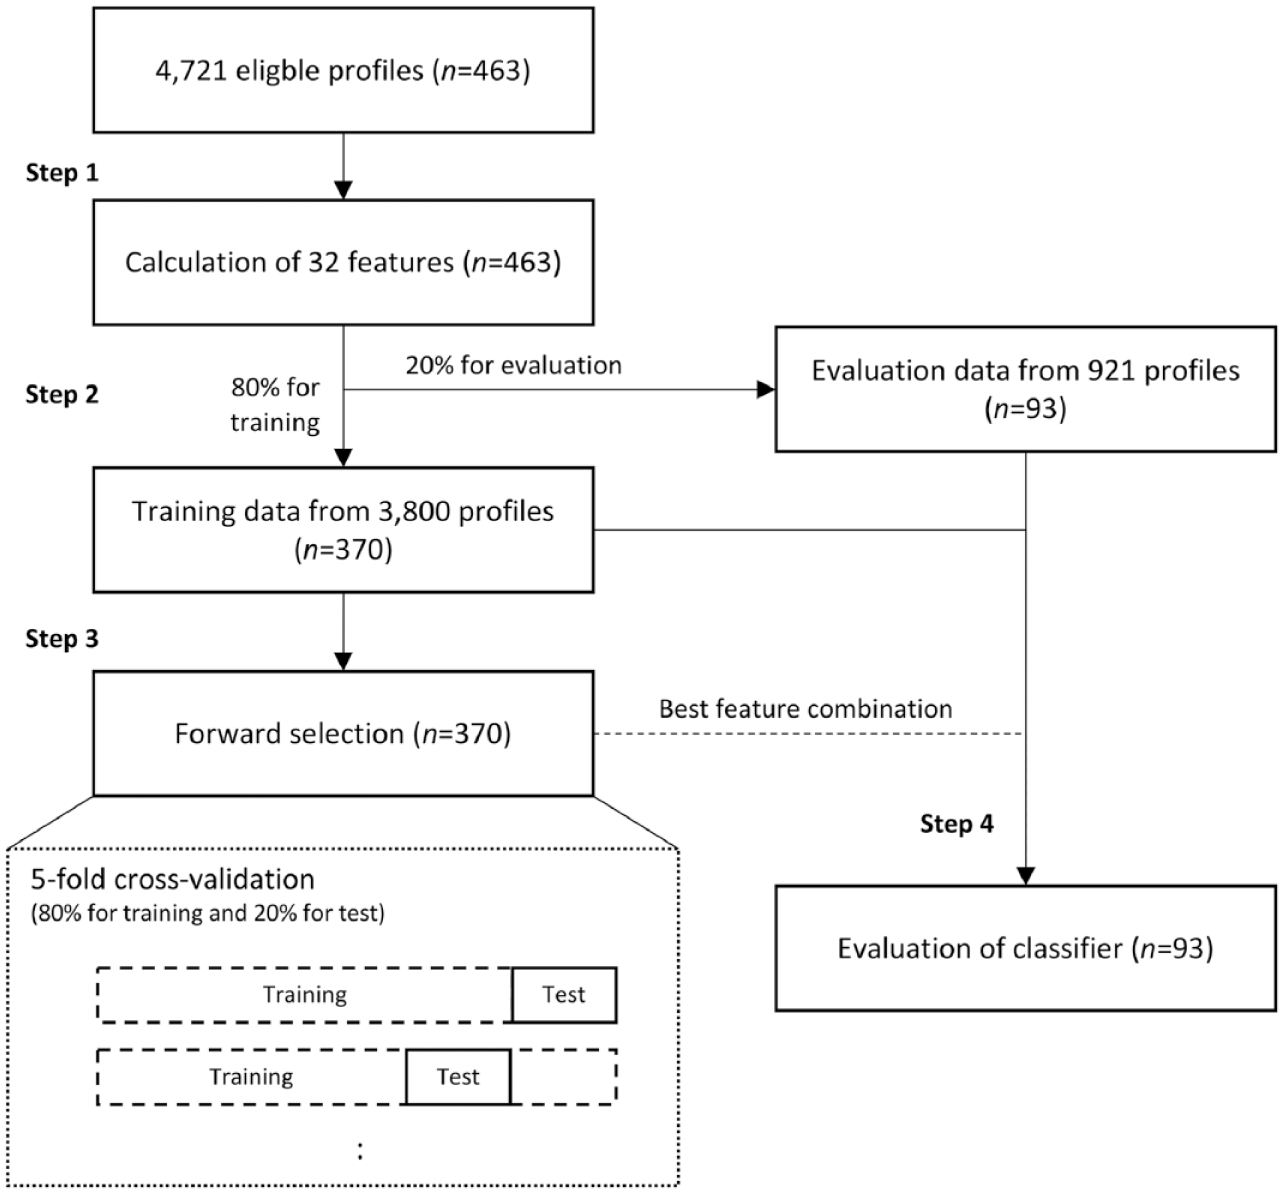
Different steps in the prediction setup. In step 1, 32 features are extracted from the eligible continuous glucose monitoring profiles. In step 2, the resultant feature data are then split up by participants in 80% for training and 20% for evaluation of final classifier. In step 3, the features with most predictive information are found in a forward selection procedure, where each test is conducted in a fivefold cross-validation. The best feature subset from this step is then used in a final step 4, where the classifier is evaluated based on 20% unknown evaluation data.
Warning system in practice
The typical warning systems build into the current CGM devices provide an alarm during night time if the blood glucose drops too much. However, false alarms may decrease the quality of sleep of the individual and their willingness to use the devices.
The prediction setup in this study is designed so that the user will get a warning in the evening before bedtime about subsequent nocturnal hypoglycemic episodes. This enables the user to act accordingly before bedtime, e.g., by adjusting basal rate or eating a large meal of complex carbohydrates. The setup could be implemented in the existing mobile phone applications developed by the manufacturers of CGM devices. For example, the Freestyle Libre flash glucose monitoring (FGM) by Abbott could be a candidate in a setup where a prediction of nocturnal hypoglycemia is calculated every time the transceiver is scanned in the evening. 18
Features were extracted in the interval from three days before to 12
Results
In Table 2, the characteristics of the people in this study are shown. Nine people from the original study did not have sufficient CGM, insulin, or meal data for the calculation of features, and the number of eligible participants in this study was thus 463. The people enrolled are on average pre-obese with a body mass index exceeding 25 kg/m2 as defined by the World Health Organization. 19 A total of 4721 CGM profiles were eligible for analysis based on the criteria defined under “Methods” section. Of those profiles, 429 had a nocturnal hypoglycemic episode, i.e., people experienced hypoglycemic episodes in 9% of the night.
Characteristics of People With Eligible Continuous Glucose Monitoring Profiles Enrolled in This Study.
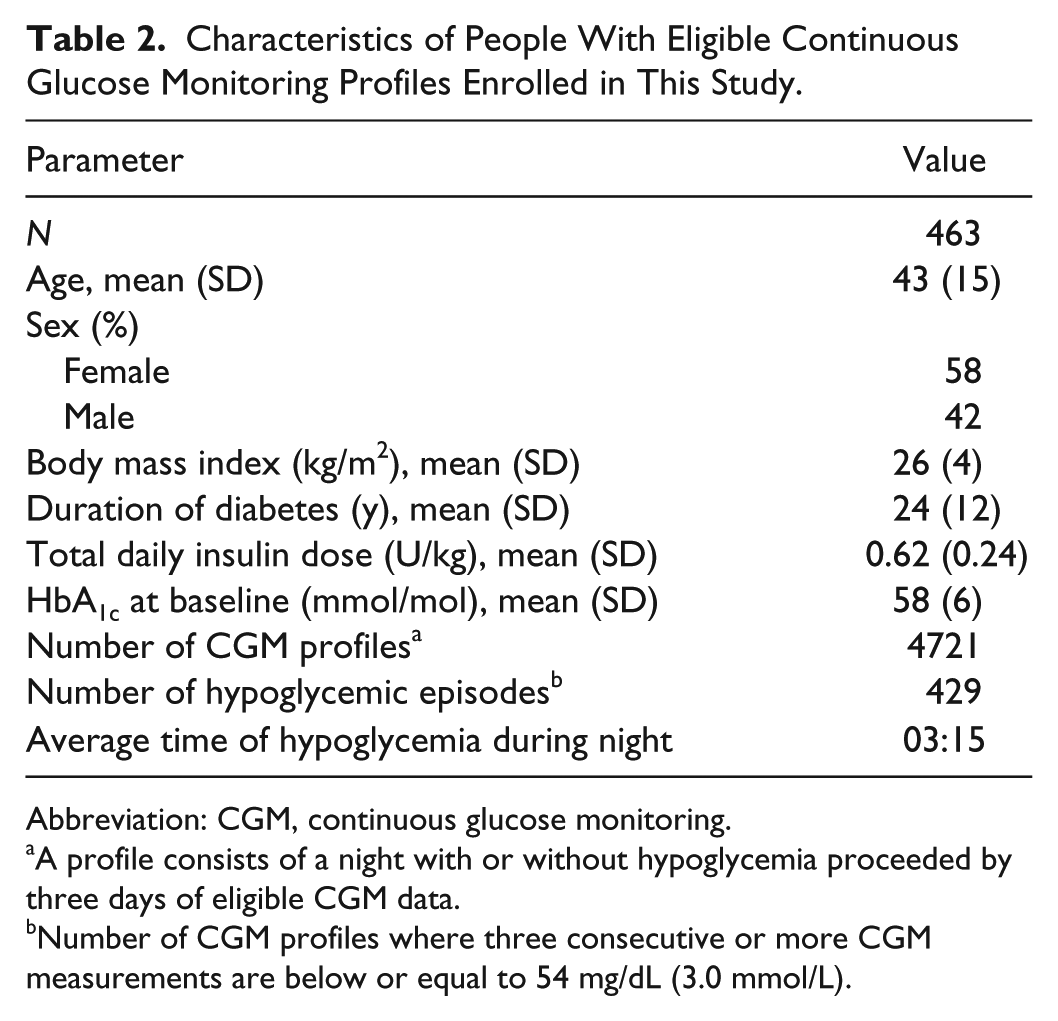
Abbreviation: CGM, continuous glucose monitoring.
A profile consists of a night with or without hypoglycemia proceeded by three days of eligible CGM data.
Number of CGM profiles where three consecutive or more CGM measurements are below or equal to 54 mg/dL (3.0 mmol/L).
In Figure 2, the result of the forward selection is illustrated. The first feature LREG0 results in a ROC-AUC of 0.69. The highest ROC-AUC is reached in the fourth round with the addition of body mass index at baseline (BMIBL), and the best feature subset thus comprises the first four features shown on the first axis.
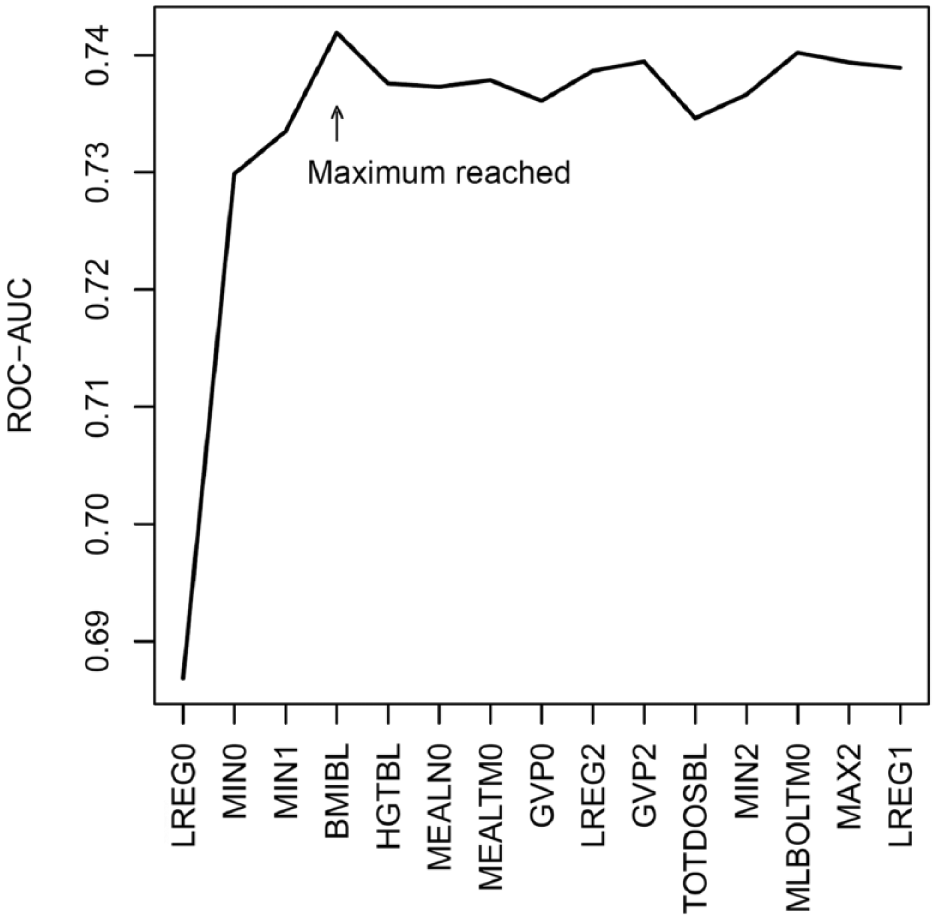
Results of the forward selection. An area under the receiver operating characteristics curve is shown as a function of rounds of forward selection. The feature name shown on the first axis is the feature added to the feature subset producing the highest area under the receiver operating characteristics curve within the round. The feature subset with the highest ROC-AUC is reached in the fourth round with the addition of body mass index at baseline.
In Figure 3, the result of the final classification on the evaluation data from 20%—to the classifier—unknown persons is shown.
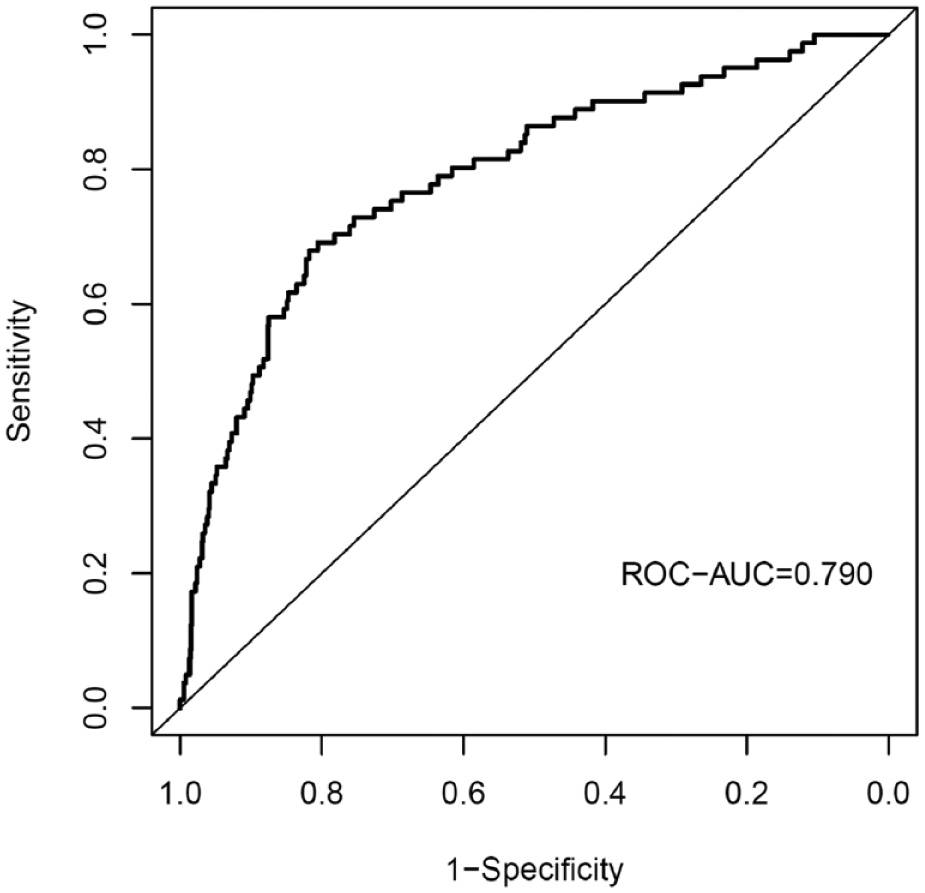
Receiver operating characteristics curve from the evaluation of the final classifier.
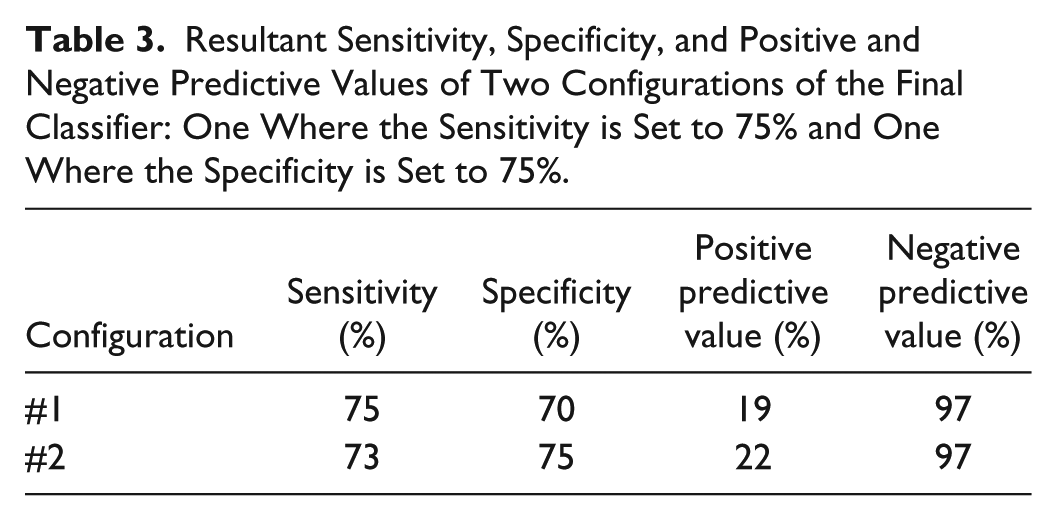
In Table 3, two configurations of the final classifier are shown. One where the sensitivity is set to 75% and one where the specificity is set 75%. The positive predictive values indicate that when the algorithm warns about a nocturnal hypoglycemia, the person will only experience nocturnal hypoglycemia one out of five times. On the other hand, when no warning about nocturnal hypoglycemia is given, the person will in 97% of the nights not experience hypoglycemia. This configuration can be altered and should be altered based on how careful the individual would like the algorithm to act. The relatively low positive predictive value compared to negative predictive value should be seen in light of the prevalence of hypoglycemia. Only in approximately 10% of the nights, the evaluation participants experienced hypoglycemia.
Resultant Sensitivity, Specificity, and Positive and Negative Predictive Values of Two Configurations of the Final Classifier: One Where the Sensitivity is Set to 75% and One Where the Specificity is Set to 75%.
Discussion
By utilizing machine learning methods, it was possible to predict nocturnal hypoglycemia with a ROC-AUC of 0.79, which corresponds to a sensitivity of 75% and a specificity of 70%. These results indicate that it is possible predict nocturnal hypoglycemic episodes. This mean improvements are needed before the algorithm can be implemented in everyday practice.
In the study by Dassau et al,
14
higher sensitivities and specificities were reached with a prediction horizon of 35 minutes. These results are equivalent to another study by Eren-Oruklu
20
where different recursive time-series models were used to predict insulin-induced hypoglycemia with similar prediction horizons. In our study, the average nocturnal hypoglycemic episode came at 3:15
Via the forward selection in this study, slope of linear regression the evening before the event contained most predictive information. It makes sense from a clinical point of view that a gradual decrease in the interstitial glucose is observed in the evening just before a nocturnal hypoglycemia. MIN0 was the second most predictive feature. This observation is confirmed by the literature where bedtime blood glucose is a predictor for subsequent nocturnal hypoglycemia.
22
As expected, minimum interstitial glucose the preceding night (MIN1) was as well a predictor of subsequent nocturnal hypoglycemia. Of the features derived from person characteristics at baseline, BMIBL contained predictive information as well. A higher body mass index might lead to decreased risk of hypoglycemia due to the associated decreased insulin sensitivity.
23
Interestingly, none of the features from meals or bolus insulin ended up in the final feature subset. This may be due to that the main evening meal and the associated bolus insulin do not have a major influence on the blood glucose at 3 to 4
In this study, LDA was used as classifier. Other classifiers, such as Support Vector Machines, Naïve Bayes, Neural Networks, Decision Trees, and K-Nearest Neighbor, could have been used. However, initial investigations showed that these methods produced very similar results, and LDA was thus chosen due to its simple structure and interpretation. We believe that simple methods are more likely to be generalizable. It can be observed that the ROC-AUC in the final evaluation was higher than the ROC-AUC reached in the forward selection. One reason is that the data material used for training in the final evaluation is larger than in the forward selection, 296 persons (370*0.8) vs 370 persons. Another reason is coincidence, due to that 20% persons for evaluation were randomly selected. To get a more “stable” result, double cross-validation, i.e., cross-validation in our evaluation, could have been applied. However, we choose not to perform double cross-validation to receive an unambiguous feature subset.
A major limitation in this study is the lack of basal insulin. It was unfortunately not possible to obtain all basal rates from the insulin pumps in this data access request to Novo Nordisk A/S. It is expected that a large number of the nocturnal hypoglycemic episodes in this study can be explained by inappropriate basal rates. Another limitation is the lack of physical activity measures. Physical activity during a day is a well-known contributor to subsequent nocturnal hypoglycemia, 22 and measures/surrogates of physical activity could thus improve the predictions.
Although the data used in this study came from a strict randomized controlled trial, the three periods of CGM were performed during normal conditions in the participants’ homes. Furthermore, half of the people were allowed to use their own CGM throughout the trial. This is an advantage for the usability and generalizability of the algorithm developed in this study. However, if all people were allowed to use their own CGM, time in hypoglycemia might have decreased, 13 which could have affected results. Furthermore, the trial was multinational with participants from Belgium, Canada, France, Germany, Netherlands, Russian Federation, Slovenia, United Kingdom, and United States, which again aids to the generalizability of the algorithm.
Conclusion
This proof-of-concept study shows that it is possible to predict nocturnal hypoglycemic episodes. However, addition of, e.g., basal rates, and if possible, physical activity to the algorithm is necessary to improve predictions. This simple warning system could be implemented in the existing CGM/FGM systems and provide a great help to people with fear of nocturnal hypoglycemia and could potentially improve treatment compliance. However, the algorithm needs further development before it can be implemented.
Footnotes
Declaration of Conflicting Interests
The author(s) declared the following potential conflicts of interest with respect to the research, authorship, and/or publication of this article: Claus Dethlefsen is employed at Novo Nordisk A/S. Peter Vestergaard has travel grants and unrestricted grants from MSD, Amgen, Eli Lilly, Norvartis, and Servier. Peter Vestergaard has research collaboration with MSD and Kyowa Kirin. Ole Hejlesen is the member of Committee for Education, Danish Diabetes Academy funded by Novo Nordisk Foundation.
Funding
The author(s) received no financial support for the research, authorship, and/or publication of this article.