
Abstract
Purpose:
A proposal that an Insulin Advisory Committee develop insulin titration guidelines 100 years after its discovery.
Findings:
Glucose control metrics remain poor despite significant advances in diabetes technology.
Summary:
A century after the introduction of insulin, health care providers and patients with type 1 diabetes have worldwide access to a variety of insulin delivery devices (IDDs), glucose monitors, bolus calculators (BCs), continuous glucose monitors (CGMs), and automated insulin delivery (AID) systems. However, these advances have not enabled most patients to achieve today’s clear A1c and time-in-range goals. Much of this failure arises from the lack of clear insulin titration guidelines for determining appropriate insulin doses. The lack of dosing clarity results in local physicians, clinics, and individual patients managing insulin titrations as they see fit, creating significant inefficiencies for reaching recommended glycemic goals. This review (1) details the widespread problems generated by nonphysiological dose settings in today’s BCs, insulin pumps, and AID systems; (2) presents a method to develop and implement optimized total daily doses of insulin to correct the most common problem of hyperglycemia; (3) discusses using large device databases to provide clear insulin titration guidelines that optimize BC settings from an optimized total daily dose (TDD) of insulin for patients with T1D; and (4) recommends the formation of an Insulin Advisory Committee to clarify the steps to take toward universal insulin titration guidelines, optimized BC settings, and a systematic logic for their use in insulin delivery devices.
Keywords
Introduction
A century after introducing insulin, diabetes care for persons with type 1 diabetes (PwT1D) has improved remarkably. Health care providers (HCPs) and PwT1D now have worldwide access to insulin delivery devices (IDDs), glucose monitors, bolus calculators (BCs), continuous glucose monitors (CGMs), and automated insulin delivery (AID) systems. These technical advances should reduce hyperglycemia, achieve optimal A1c levels, and reduce glucose variability (GV).1,2
However, today’s technological advances have yet to be leveraged for their full impact on health as measured by current population-based metrics.3,4 Most PwT1D still cannot achieve today’s clear therapeutic goals for A1c and time-in-range metrics 5 “despite an increase in the use of insulin pumps and CGMs.” 6 Much of this failure arises from the lack of clear insulin titration guidelines within the United States or other countries that would enable clinicians to determine appropriate insulin doses quickly for PwT1D. 7 Missing guidelines cause HCPs, clinics, and individual PwT1D to manage insulin titrations as they see fit. This results in significant inefficiencies for reaching today’s glycemic goals.
A remedy is available. Current IDD databases contain the high-quality data required for rapid development of insulin dosing guidelines. It is time for one or more diabetes professional societies to step forward and develop these crucial guidelines.
Where Are We?
The American Diabetes Association (ADA) and European Association for the Study of Diabetes (EASD) recommend an A1c goal of ≤7% for adults and children without significant hypoglycemia. 5 However, recent glucose data gathered between 2016 and 2018 from the T1D Exchange database show glycemic control for many PwT1D remains less than ideal. 6 Among 25,529 participants, only 17% of youth below 18 years of age achieved the ADA’s previously recommended goal of an A1c ≤7.5%, and only 21% of adults met the ADA’s goal of ≤7.0%. Even among those using an insulin pump and CGM system, mean A1c values remained elevated at 7.9% for children ≤13 years of age, 8.3% for those aged 13 to 26 years, and 7.4% for those aged ≥26 years.
More discouraging, UC San Diego researchers in 2019 analyzed the clinical outcomes of 31,430 PwT1D in the Optum Humedica EHR database. 8 In these real-world T1D patients, mean A1c levels were 9.4% for 18- to 25-year-olds, 8.3% for 26- to 49-year-olds, and 7.8% for those ≥65 years of age. After controlling for age, sex, and T1D duration, other researchers found A1c levels increased in the United States between 2011 and 2017, decreased in Sweden, and did not change in Germany and Austria. 9
Initial insulin dosing guidelines for new-onset T1D patients are handled with a variety of initial dosing recommendations.10,11,12 However, once insulin has been initiated, today’s massive IDD data sets can improve insulin dosing guidelines. After addressing basic issues like excesses in simple sugars, meal proportions, and proper bolus timing, treat-to-target studies point to adjusting an individual’s total daily dose (TDD) of insulin as the key to correcting hyperglycemia and minimizing hypoglycemia.13,14
Unfortunately, today’s diabetes technology displays nonphysiological basal rates, 15 illogical BC settings, 16 and disparate bolus dose recommendations given under identical circumstances by various BC algorithms. 17 The accuracy of each BC setting affects the accuracy of others. These defects hinder effective insulin doses and achieving glycemic targets. 6
Are Current BC Settings Appropriate?
A critical factor for achieving optimal glycemic control is determining an optTDD that provides relative normoglycemia. Once determined, guidelines for distributing the optTDD into an average basal rate, insulin-to-carb ratio (ICR), and correction factor (CorrF) becomes the essential next step. None of these is widely done.
Diabetes management relies on straightforward rules for balancing units of insulin against glucose levels. Over a decade ago, clinicians developed early formulas from insulin pump and blood glucose (BG) meter data sets for distributing the TDD into more appropriate BC settings.18,19 Professional diabetes organizations have not investigated these formulas and the data below show these formulas continue to be ignored.
Today, massive IDD databases offer researchers and clinicians the opportunity to determine more accurate insulin titration formulas. Only the bodyweight of individual PwT1Ds is needed to calculate that person’s ICR and relative insulin sensitivity. BC settings derived in this manner should minimize hyperglycemia and reduce GV and hypoglycemia.
However, the data below document the rarity of optimization in today’s BC settings for individual PwT1D. Once derived, clinicians still need to take the next step and implement these formulas to derive everyone’s initial BC settings for optimal outcomes. With today’s easy access to data, advice for BC setting adjustments and behavioral changes may best be implemented directly from devices and smartphones.
Steps for Calculating the optTDD
Figure 1 displays the persistence of hyperglycemia in PwT1D. These real-world data from consecutive downloads in 2007 of more than 1000 insulin pump patients show the frequency of hyperglycemia and also show the importance of adjusting individual’s mean TDDs as the first step for improving glycemic control.
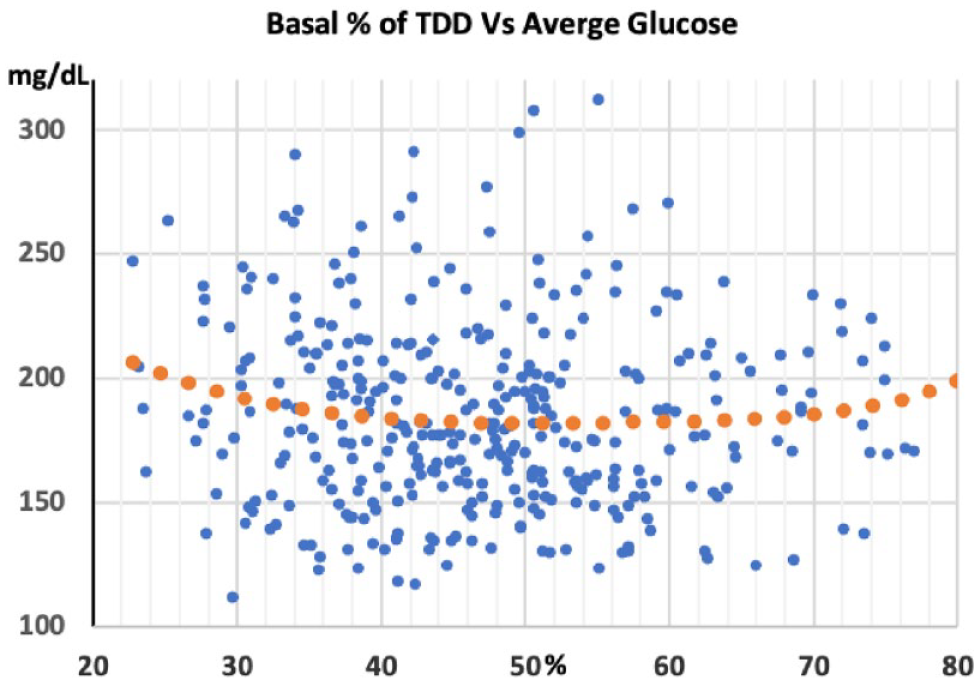
Average glucose level versus basal percentage of the TDD among 996 US pump wearers in the 2007 APP Study. The orange dotted fifth-degree polynomial line shows a nonsignificant trend for lower average glucose levels near the mid-point.
An estimate for the insulin deficit in a hyperglycemic PwT1D who is not experiencing frequent hypoglycemia is straightforward. A clinical method has been developed to address hyperglycemia over the years and is used in our clinic. This involves calculating the correction doses sufficient to lower a patient’s elevated mean glucose level to their desired target glucose (tG). Close estimates of these correction doses are then added to the current TDD to get an optTDD. The mean glucose value calculated from CGM data downloaded over the last two weeks or five or more daily glucose tests can guide adjusting the TDD for a hyperglycemic PwT1D.
A value of 2000 mg/dL (111 mmol/L) provides a conservative value for the correction factor rule number (CorrFRN). 18 This CorrFRN was derived from 132 pump patients in good control with an average glucose of 144 mg/dL (8.0 mmol/L, glucose management indicator [GMI] 6.6%). The CorrFRN divided by the mean TDD (ie, CorrF = 2000 mg/dL/TDD units) estimates an individual’s decline in glucose in mg/dL per unit of insulin while the insulin is active. With today’s rapid insulins having a duration of insulin action (DIA) close to five hours, four correction boluses a day will cover about 20 hours of an individual’s mean daily hyperglycemia. As outlined in Table 1, adding four correction doses to the current TDD approximates the optTDD needed to bring an elevated mean glucose level close to the tG (Table 1).
How to Modify the Current TDD and BC Settings for Stable Glycemia.
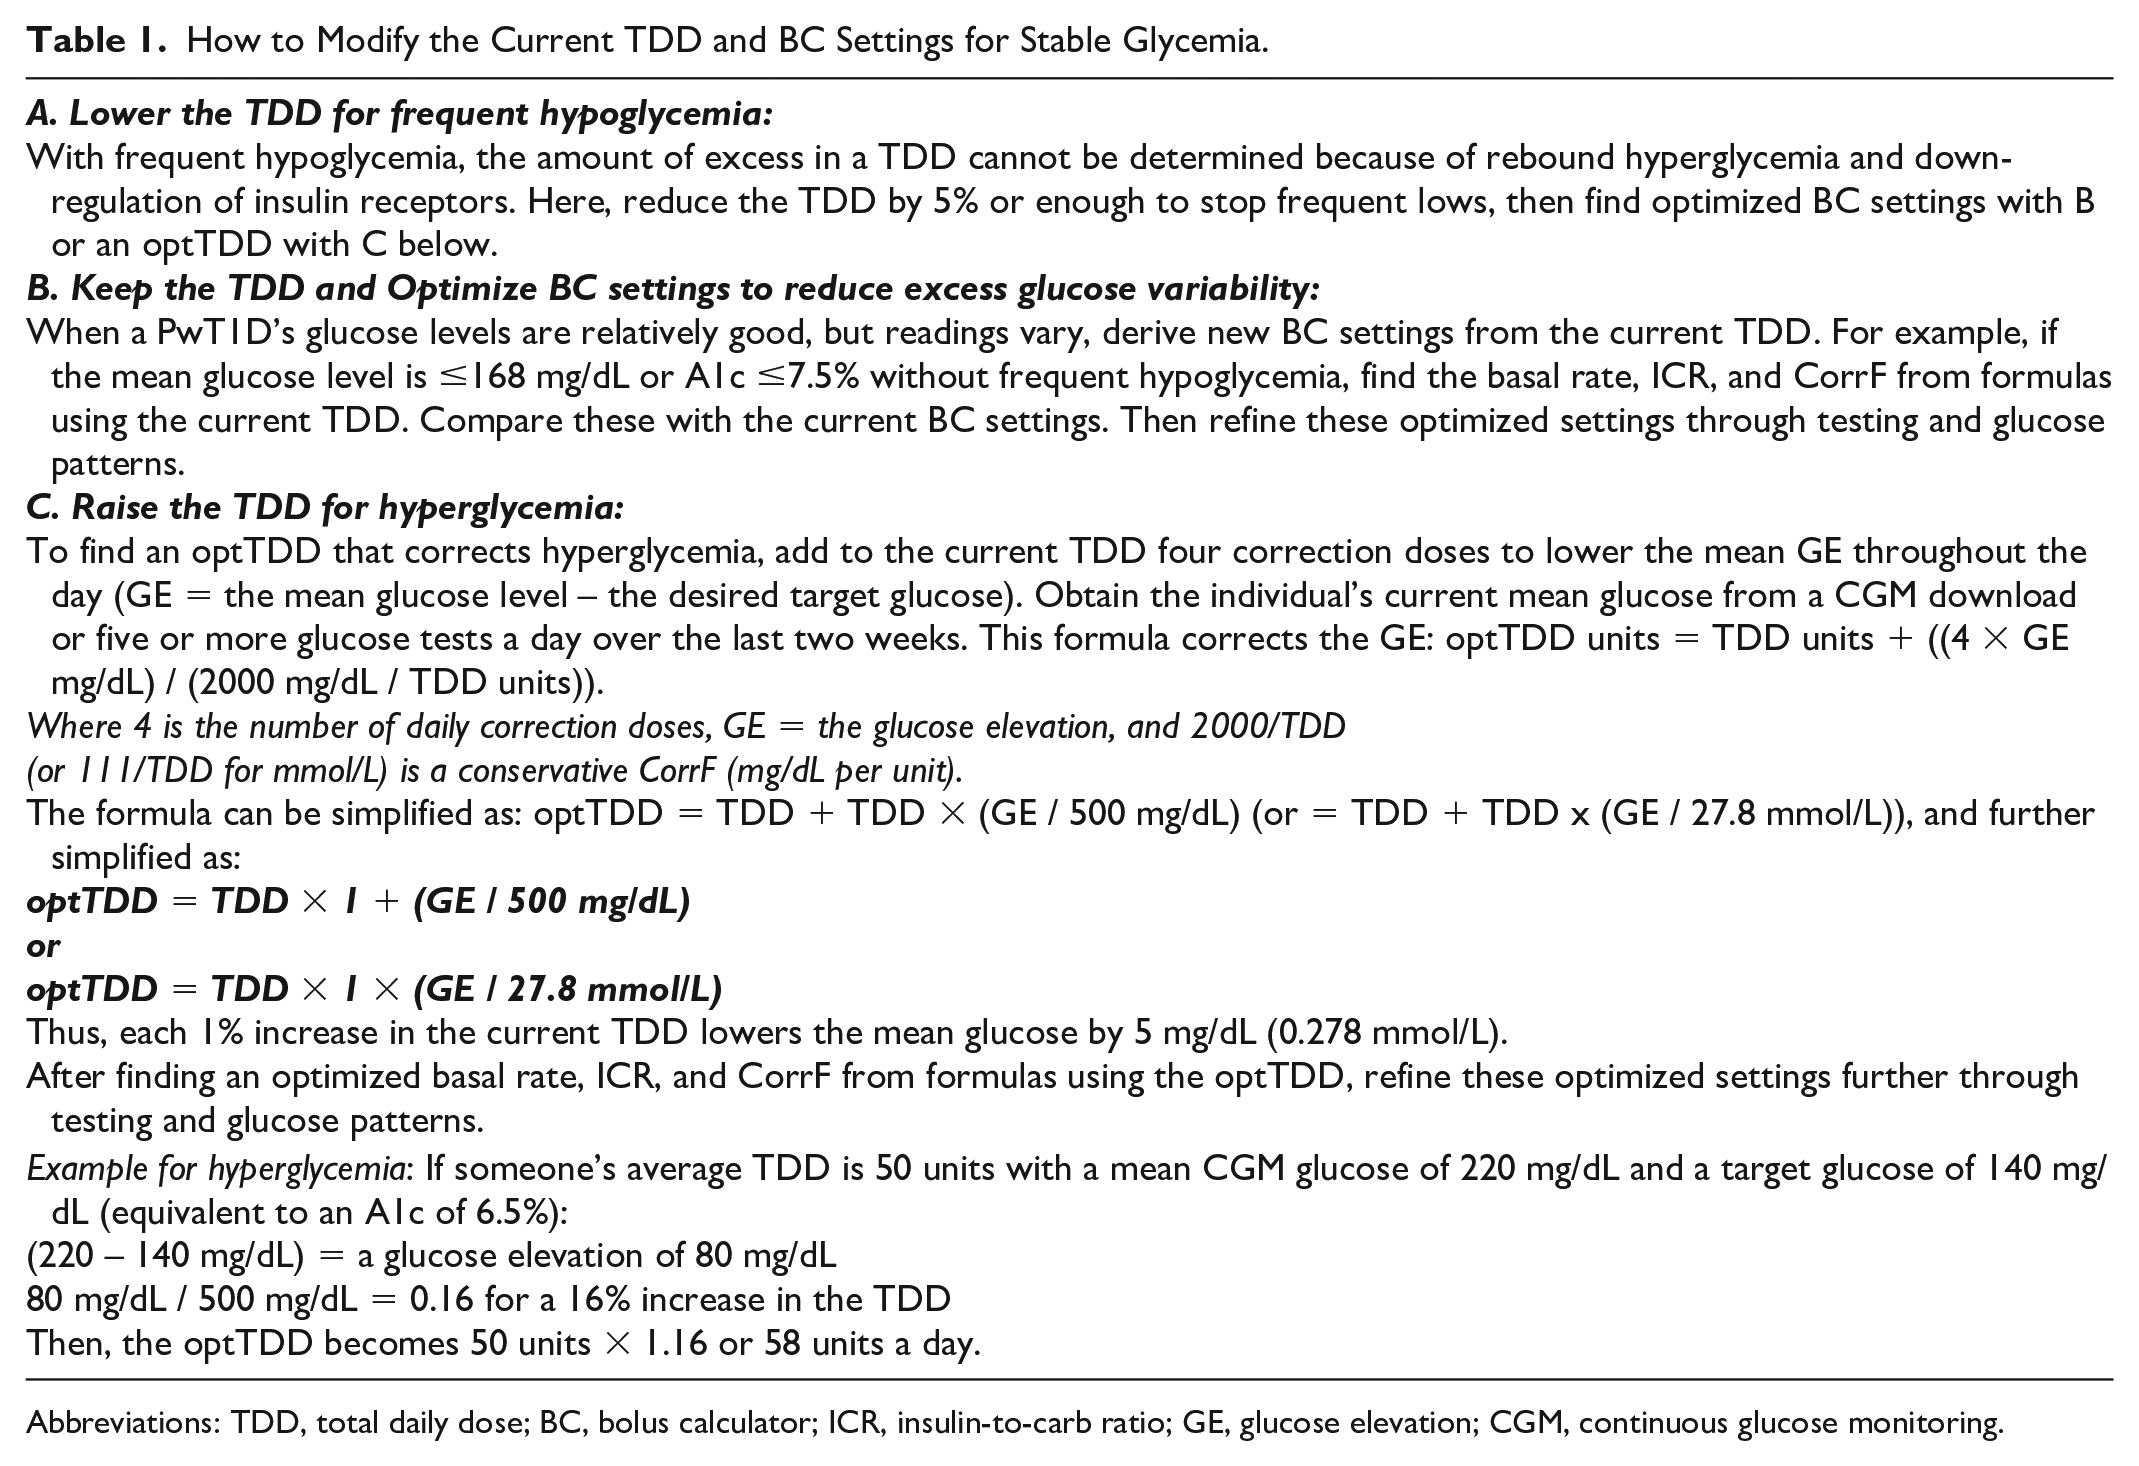
Abbreviations: TDD, total daily dose; BC, bolus calculator; ICR, insulin-to-carb ratio; GE, glucose elevation; CGM, continuous glucose monitoring.
Besides using a conservative CorrFRN of 2000 mg/dL, additional safety derives from CorrFs being inversely related to the mean glucose level. Thus, a CorrFRN of 2000 mg/dL underestimates the corrective insulin doses required to offset the more significant insulin deficits found when the mean glucose level is higher. This gradual weakening of correction doses provides additional safety to this approach. For a more gradual glucose lowering, multiply the TDD by a value less than 1.16. The tG can also be lowered for pregnancy or raised to reduce risk, such as for a truck driver or an older adult who lives alone.
For those not using an AID, Table 1 works well to find an optTDD for any TDD and any degree of hyperglycemia. Once an initial optTDD is determined, use today’s established formulas to distribute the optTDD into close approximations of an individual’s average basal rate, ICR, and CorrF. Today’s AIDs take optimizing the TDD a step further. As an AID raises and lowers insulin delivery to correct hyperglycemia and avoid hypoglycemia, it rapidly determines an individual’s optTDD. This optTDD from an AID makes it easier to determine optimal BC settings if their mean glucose level is reasonable.
Basal Rates and Basal/Bolus Balance
An appropriate basal/bolus balance and having similar basal rates throughout the day are essential for glycemic success. Under ideal circumstances, an insulin pump infuses insulin at one or more basal rates to maintain normal glucose levels between meals and during sleep and periods of fasting. One dose of a long-acting insulin with multiple daily injections performs the same function.
Healthy individuals without diabetes have a flat basal insulin delivery throughout the day.20,21 Likewise, an injection of long-acting insulin, 22 a single basal rate, or a few similar basal rates 23 provide excellent glucose outcomes for many PwT1D. Using a single basal rate or slightly varying rates over 24 hours mimics normal physiology.
Daily basal insulin totals and subcutaneous (SC) injections of long-acting insulins average 48% to 54% of the TDD.22,24 Basal insulin makes up 40% to 60% of the TDD for most adults, so 50% of the TDD is an excellent place to start for most teens and adults. Carb content of the diet is inversely related to basal insulin requirements in well-controlled patients. Basal percentages of the TDD tend to be lower in prepubertal children, 25 Asian populations, 26 thin older adults, 27 those on high-carb diets, and children or adults who keep substantial insulin production.
The average basal percentage of the TDD measures basal/bolus balance. Figure 1 shows the basal/bolus balance on the X-axis against the mean glucose level for 363 pump wearers in the United States from unpublished Actual Pump Practices Study data. 28 Glucose measurements averaged 4.9 times per day over an average of 73.2 days. Figure 1 displays a significant discordance from the Gaussian distribution expected for basal/bolus balance.
Mean glucose levels on the Y-axis show no relation to basal-bolus balance. The orange dotted polynomial line shows only a sight trend toward lower glucose levels around the mid-point. Basal doses in these data averaged 47.7% of the TDD. However, correction boluses accounted for 12.0% of the TDD, resulting from the group’s mean glucose level of 184.5 mg/dL. By evenly distributing the excess in correction boluses into basal rates and carb boluses, the mean basal percentage would rise to a value of 51% to 53% of the TDD.
If basal rates are excessive, ICR and CorrF numerical values must increase to deliver smaller prandial and corrective bolus doses. These higher ICR settings then generate smaller prandial bolus doses. When meals contain more grams of carbohydrate, the higher ICR value provides a smaller bolus, resulting in excessive postprandial (PP) glycemic excursions. Likewise, a higher CorrF value will not lower higher glucose levels sufficiently. The inverse occurs when basal rates are too low, and ICR and CorrF values become smaller to deliver larger prandial and correction boluses. Steady or similar basal rates allow identical or very similar ICRs and CorrFs to cover a wide range of carbohydrate intakes and glucose values.
In some European countries, pump patients have considerably more variation in their daily basal rate profiles than those seen in the United States. For example, a recent German study looked at a tertile of 113 of 339 T1D patients with the highest basal rate variation following a 24-hour basal test. 29 In this tertile, mean basal rates rose from about 0.6 U/h at midnight to about 1.55 U/h at 5:00 am, a 2.6-fold increase in hourly basal insulin delivery.
In this study, the mean basal rates begin to rise near midnight, some three hours after the mean glucose levels had already started rising. Like late boluses, a delayed increase in basal rates generates hyperglycemia or the need for a marked increase in the basal rate when the prior basal rate was too low. It takes over four hours for an altered basal rate to fully impact glucose levels. 30 The ideal way to mimic normal physiology and keep the glucose level flat through the day comes from keeping basal rates similar with slight changes when needed in the basal rate three to five hours before the glucose begins to rise or fall.
Another study analyzed data from German and Austrian Registry for 5545 patients wearing an insulin pump. 14 Researchers found basal rate variability to be positively associated with higher risks for severe hypoglycemia (P = .001), hypoglycemic coma (P = .002), and microalbuminuria (P = .006) and diabetic ketoacidosis (DKA; P = .017). Basal rate variability also trended toward a risk. These data suggest significant basal rate variability. Basal rates that are too low, too high, or have excessive intraday variability impair the accuracy of ICRs and CorrFs, and introduce substantial GV.
The ICR
An individual’s ICR equals the grams of carbohydrate that one unit of insulin will cover once their basal rates or long-acting insulin dose are correct. Accurate ICRs reduce PP glycemic excursions and minimize hypoglycemia before the next meal. Inaccurate ICRs introduce errors into the multiple prandial bolus doses delivered each day. They also complicate the ever-present challenges of carb counting. Improving ICR accuracy improves carb-counting accuracy.
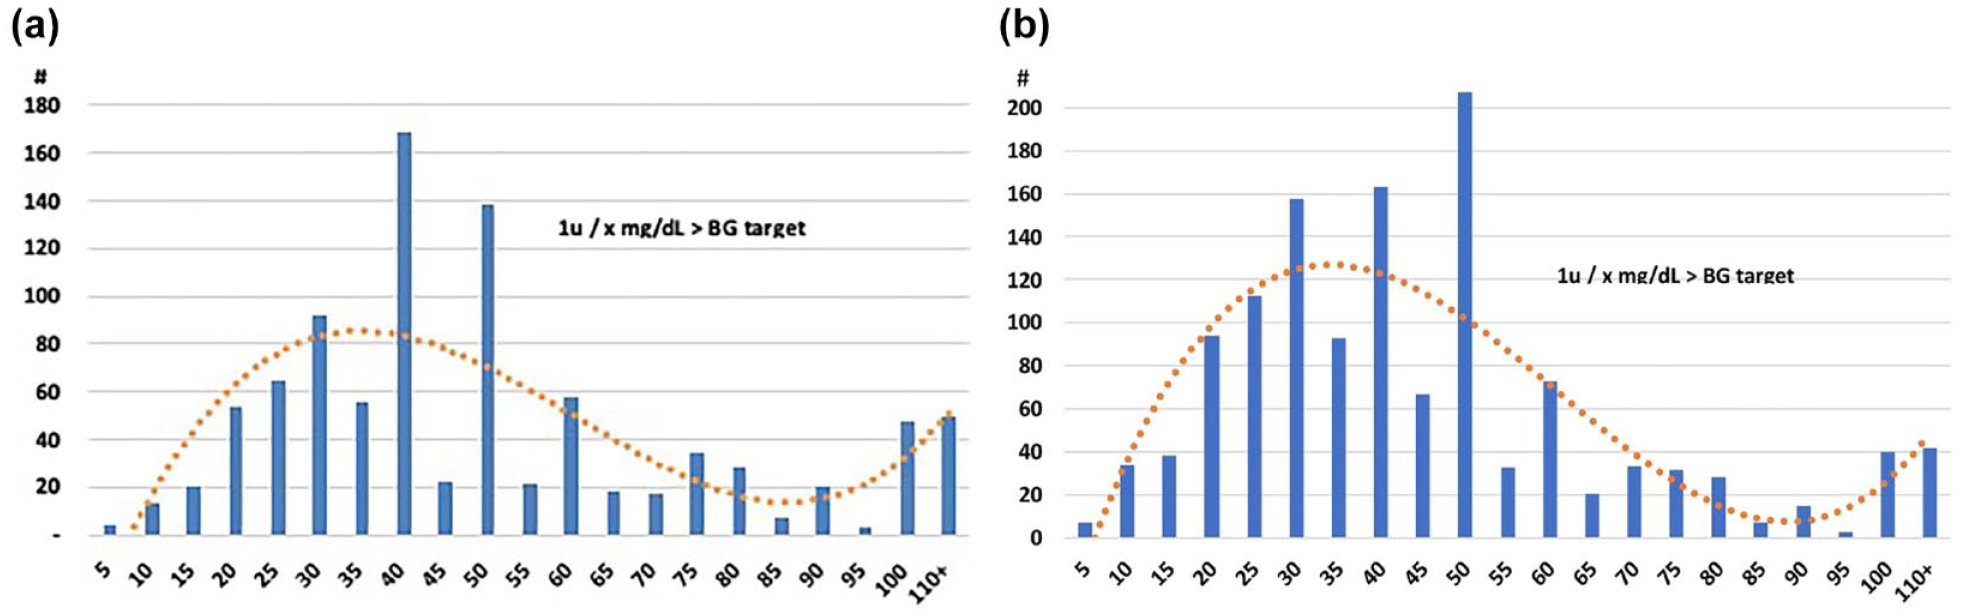
Figure 2a shows the ICR settings downloaded from 995 insulin pumps in 2007 and Figure 2b shows a second set from 1301 pumps downloaded in 2018. The ICR values in Figure 2a and 2b demonstrate the ongoing inaccuracies common to ICR values. There appears to be a slight improvement toward a more Gaussian distribution in the 2018 data, as shown by the orange dotted line in each graph. Unfortunately, many insulin pumps show discordant ICR values that do not match an expected Gaussian distribution.
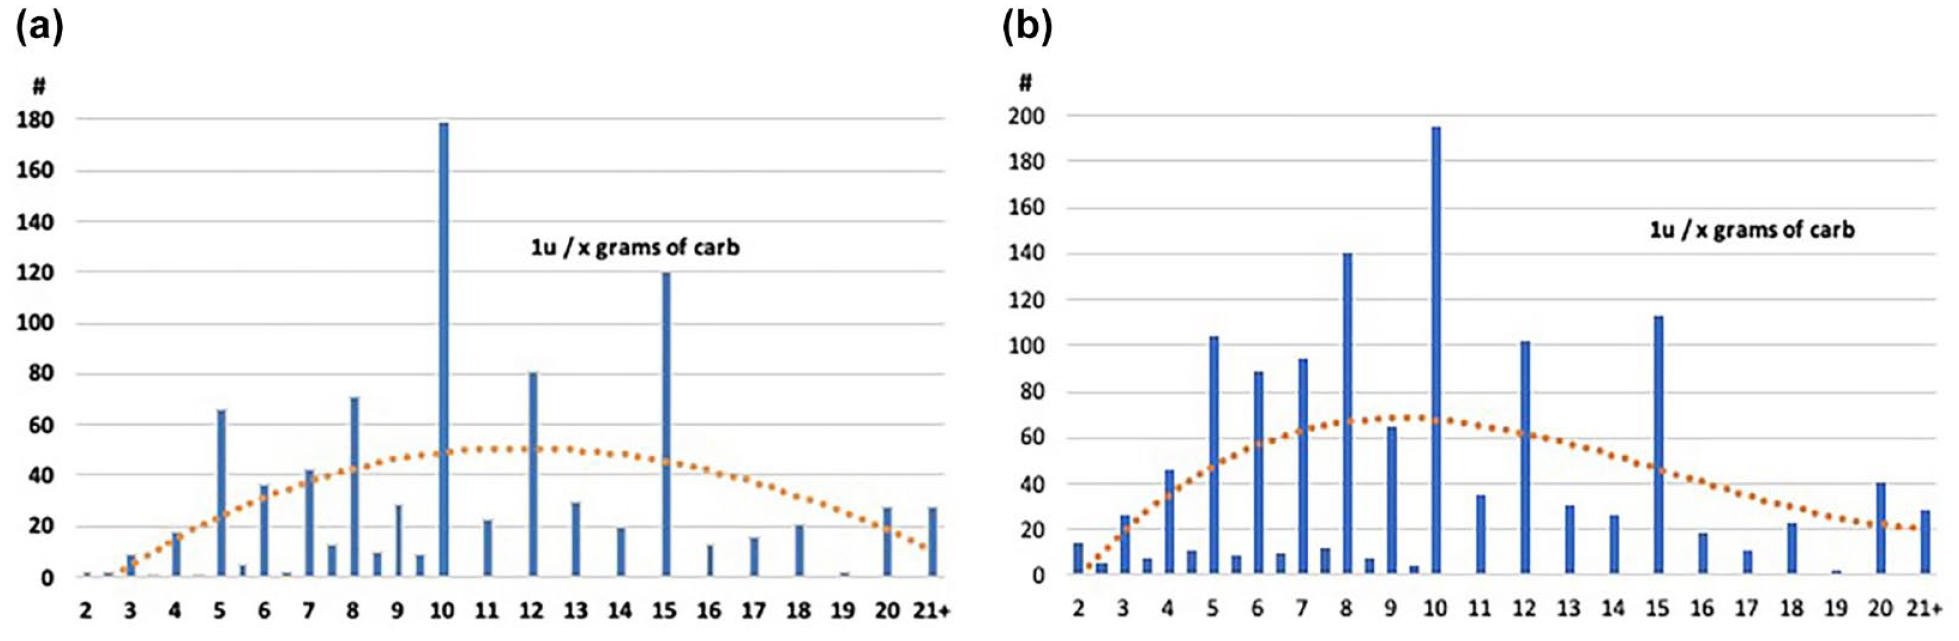
(a) Carb factor (ICRs) for 907 insulin pumps in 2007. (b) Carb factors (ICRs) from 1.272 non-AID insulin pumps in 2018. Graphs 2a and 2b show whole number ICRs ±0.05 mg/dL and total fractional values between whole numbers for values below 1U/10 g on the X-axis and number of pump patients on the Y-axis. Pump data came primarily US patients in 2007 and 2018, respectively.
HCPs and PwT1D appear to select ICRs with abandon, preferring to use whole numbers for ICRs over fractions and “magic number” ICRs like five, ten, 15, and 20 over other whole numbers. 18 These numeracy failings remain widespread despite the convenience offered by BCs and AID systems that easily handle carb bolus calculations.
BC manufacturers introduced fractional increments for ICR values below one unit of insulin per ten grams of carbohydrate about two decades ago. The intent was to reduce the significant dosing errors that whole number ICRs may generate. 28 For example, rather than using one unit of insulin for eight or nine grams of carbohydrate, a value like 8.3 grams may more closely match a person’s physiology and improve their PP glucose readings.
An insulin pump can deliver bolus doses with a precision within 1% of the desired dose, yet errant ICRs significantly handicap this precision. The current preference for whole number ICRs and avoidance of fractional ICRs limits bolus dose precision to between −9% and +11% when an ICR of 1U per ten grams is reset to nine or 11. The imprecision increases to −67% and +100% when an ICR of 1U per two grams is reset to 1U per three grams or 1U per one gram.
However, Figures 2a and 2b show that humans rarely select fractional numbers below one unit per ten grams of carbohydrate. In these data, all fractional ICRs below 1U per ten grams accounted for only 4.9% of total ICRs in 2007 and 5.1% in 2018. In comparison, whole numbers between one through ten accounted for 51.6% and 59.5%, whereas whole number ICRs greater than ten grams accounted for 43.5% and 35.5%, respectively.
Simple ICR formulas like the 450 Rule (ICR = 450/TDD) and its variations continue to be widely used to determine ICR values.31,32 However, these formulas frequently produce inaccurate ICRs. Accurate ICRs are directly related to an individual’s weight and inversely related to their TDD. Unfortunately, the nonphysiological distribution of ICRs in Figure 2 suggests that few clinicians use the accurate formula in Table 2.
Minimize Carb Bolus Errors With the Right ICR.
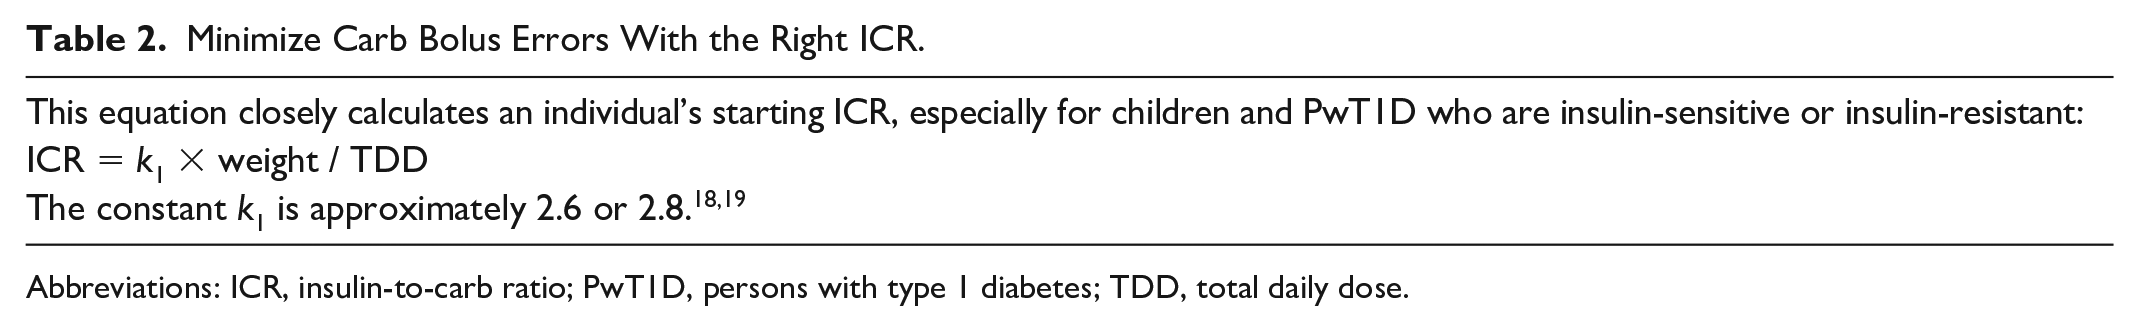
Abbreviations: ICR, insulin-to-carb ratio; PwT1D, persons with type 1 diabetes; TDD, total daily dose.
Inadequate basal delivery can introduce marked changes in the ICR throughout the day. For example, a study in Japan found that pump patients required an average ICR of 311/TDD for breakfast, 530/TDD for lunch, and 396/TDD for dinner. 33 The ICR most directly measures insulin sensitivity. However, insulin sensitivity does not vary much in most individuals. A more straightforward explanation for this study’s results is that the average basal requirement of 27.3% of the TDD may have been inadequate. Figure 2 in this study (not shown) shows the average basal rate steadily rising from approximately 0.37 U/h at midnight to 0.5 U/h at 9:00 am to maintain glucose control. This rise in basal rates suggests that these patients’ basal delivery may have been insufficient. The need for a large carb bolus for breakfast appears to compensate for the inadequate overnight basal delivery. The large breakfast bolus may also explain the need to weaken the lunch CarbF and lower the daytime basal rate to a mean of 0.36 U/h. Pump setting errors interact and likely contribute to excess GV.
The CorrF
An individual’s CorrF equals the number of mg/dL (mmol/L) that one unit of insulin will lower their glucose. An individual’s CorrF is inversely related to their TDD. Thus, someone with a larger TDD requires a smaller CorrF value to get larger correction boluses. An accurate CorrF is essential to determine the correction doses needed to lower high glucose values. Figure 3 shows the CorrFs ±2.5 mg/dL found in pump downloads in 2007 and 2018, with the 2018 data showing a slight shift toward a more “normal” Gaussian distribution. In contrast with the ICRs in Figure 2, the CorrFs in Figure 3 have a more Gaussian distribution, perhaps because of more widespread use of the more accurate CorrF formula. This improvement may result from increasing reliance on k2 in the formula shown in Table 3 for determining the CorrF (Table 3).
(a) CorrFs for 1008 insulin pumps in 2007. (b) CorrFs from 1301 non-AID insulin pumps, 2018. Areas 3a and 3b show CorrFs ±2.5 mg/dL as a percentage of total CorrFs on the X-axis and the number of pump patients on the Y-axis. Note the discordant distribution of these settings compared with the expected distribution shown by the orange dotted line.
Minimize Correction Bolus Errors With the Right CorrF.
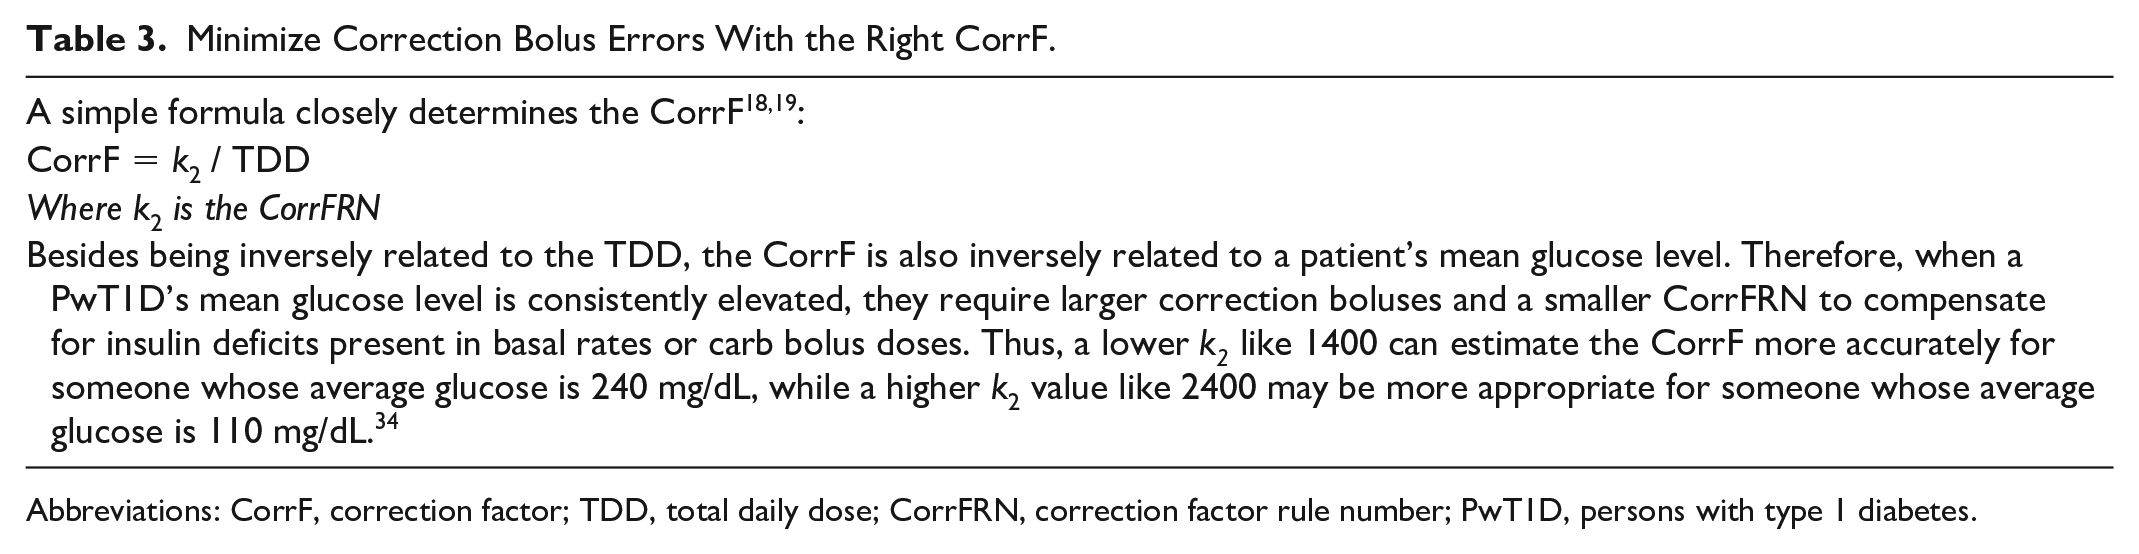
Abbreviations: CorrF, correction factor; TDD, total daily dose; CorrFRN, correction factor rule number; PwT1D, persons with type 1 diabetes.
Figure 3 shows that the use of 30, 40, and 50 mg/dL per unit of insulin continues to be excessive, whereas the use of 15, 35, 45, 55, and 65 mg/dL per unit continues to be underused. CorrF mismatching at lower values like 15 is especially problematic. For example, a shift between 10 and 20 mg/dL per unit will double the correction dose in one direction and reduce it by half in the other. Likewise, changing the CorrF between 40 and 50 mg/dL reduces the correction dose by 20% in one direction and increases it by 25% in the other.
Short DIA Times Impair Insulin Dose Accuracy
Much confusion exists about selecting an accurate DIA time that reflects how long an insulin bolus will lower the glucose. Required in nearly all BCs and AIDs, an accurate DIA is essential for minimizing insulin stacking caused when bolus doses overlap. 35
Data from the APP Study showed that pump wearers give 64% of their pump boluses within 4.5 hours of a previous bolus. 35 In this study, 396 pump wearers averaged 4.14 carb boluses plus another 2.12 correction boluses per day during ten weeks of pump wear. 27 Australian researchers found similar data in pump downloads from 100 adolescents who had a bolus frequency of 6.1 boluses per day. 36 If we assume most people give their boluses during 16 to 18 waking hours, the time interval between bolus doses averages less than three hours.
There appears to be little agreement on the actual glucose-lowering activity of insulin boluses. Consequently, the DIA number entered as a setting into BCs and AIDs is often not physiologically accurate. After the first bolus of the day, a short DIA time hides residual insulin activity and generates insulin stacking in subsequent boluses. The “unexplained” hypoglycemia that results generates errors in other BC settings and creates mistrust of IDDs by PwT1D.
An insulin manufacturers’ insulin action time (IAT) used to compare their commercial insulin formulations differs from DIA, the actual pharmacodynamic action time of rapid-acting insulin analogs that one would enter into an IDD. 35 In glucose clamp studies, IAT measures only the duration of the glucose infusion required to keep the BG constant at a target level of 90 mg/dL following an SC administration of the given insulin. In contrast to DIA, IAT does not start when a researcher injects the insulin, but later when an infusion of glucose begins to be required to offset the glucose-lowering effect of the rising insulin level. Manufacturers rely on IAT to compare similar insulins. However, IATs are significantly shorter than DIA times, especially for smaller insulin doses that are less able to suppress insulin production from a healthy pancreas. In addition, IAT ignores while DIA includes additional time following termination of the glucose infusion. 35
Figure 4 puts this into context. It shows IAT times for one of today’s fastest prandial insulins (Lyumjev; Eli Lilly, Indianapolis, Indiana). 37 The IAT for a 7U dose of Lyumjev measures 4.6 hours, although this dose is less able to suppress insulin output from a healthy pancreas compared with the larger 15- and 30-unit doses. This time does not include 17 minutes between the insulin injection and when the glucose infusion starts for measurement of IAT. IAT also stops earlier when insulin production in a healthy individual returns. In contrast, DIA time, unrelated to suppressing insulin release, continues in PwT1D on long-acting insulin or basal rates. Based on the pharmacodynamics of SC-injected insulin formulations, five hours appears to be a minimally appropriate duration for DIA.
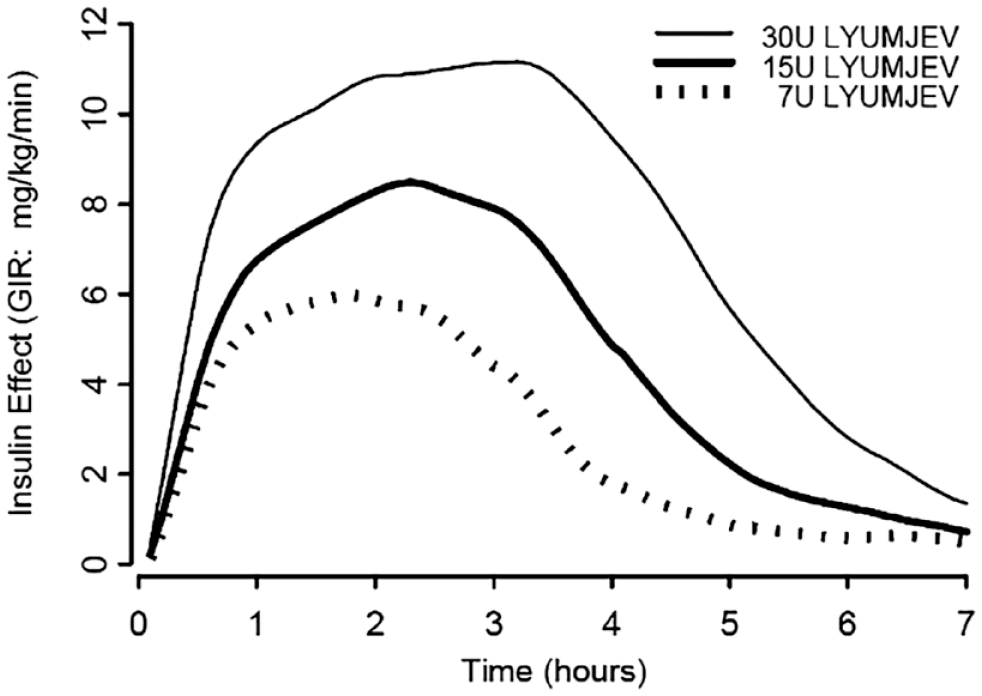
Insulin action times (pharmacodynamic times) for Lilly Lyumjev insulin.
Short DIA time settings in a BC, insulin pump, or AID system hide the actual glucose-lowering activity of residual insulin on board (IOB). For example, when someone selects a two-hour DIA time entry, no IOB would appear to remain after two hours on an IDD’s screen, although over half of a recent bolus may still be active. Thus, for a 10U bolus, no IOB appears to be present after two hours with a two-hour DIA, while 6.3U continues lowering the glucose with a more appropriate five-hour DIA.
One might assume that clinicians and patients on pumps would not enter DIA times that hide insulin stacking. However, Figure 5 shows the use of short, nonphysiological DIA times remains widespread. These unpublished 2018 data from more than 1300 pump downloads showed that one in nine insulin pumps had a short DIA time of two hours and 52% had a DIA time entry of three hours or less. Fewer than 1% of the pumps had a DIA entry of five or six hours.
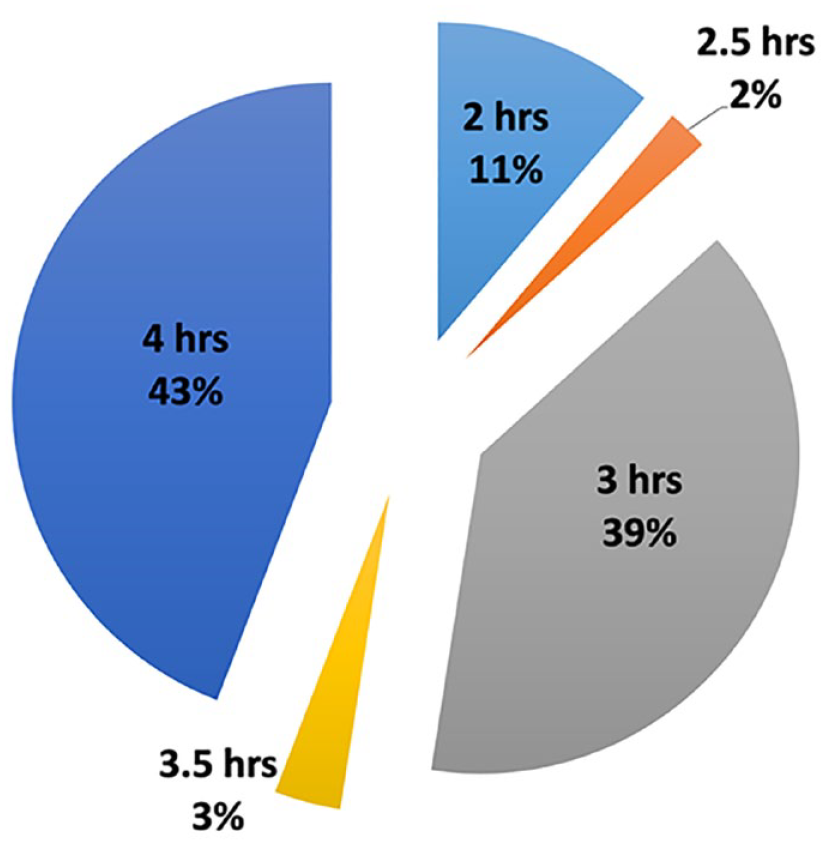
These are the DIA time entries found in 1301 insulin pumps in 2018. The widespread use of short DIA times can hide significant insulin activity and increase the risk of unrecognized insulin stacking. DIA times of five and six hours (not shown) were both less than 1% of the total.
Lacking an intuitive basis for selecting the DIA, personal experience of PwT1D and HCPs may reinforce a belief that insulin works faster than it does. For example, when glucose goes low an hour after a meal, it seems logical to accuse the prandial bolus just given rather than the excess IOB still active from an earlier bolus. Likewise, excessive bolus doses or basal rates can cause glucose to plunge rapidly and make a recent bolus appear to act quickly. Excessive insulin doses might make shortening the DIA seem reasonable, but this only worsens rather than solves the real problem.
Today’s BCs, insulin pumps, and AID systems often increase insulin stacking by ignoring residual IOB when glucose levels are above the target or target range. In this situation, most BCs ignore any IOB and cover all carbohydrate intake with a full prandial bolus. IOB can be disregarded when someone adds an unplanned dessert after a meal. However, if someone biked for two hours after dinner, IOB is excessive, glucose is normal, and they plan to bolus for a dessert, ignoring the IOB is not appropriate.
Shortening the DIA is often used to compensate knowingly or unknowingly for other setting errors. For example, in hyperglycemic individuals with significant insulin and TDD deficits, shortening the DIA time compensates for inadequate bolus doses or basal rates caused by other BC setting errors. However, shortening the DIA and the erratic results it produces does not solve the real problem. The hidden insulin stacking that results complicates the path to euglycemia. It also presents challenges to accurate determinations of other BC settings.
Carefully designed clinical studies and analysis of existing IAT data would define optimal DIA times that minimize insulin stacking. HCPs and PwT1D require a clear statement regarding appropriate DIA times for entry into IDDs.
Glucose Variability
The GV remains an important but underreported factor for glucose control. Incorrect BC settings and the significant dosing errors they generate increase GV. GV becomes quite important when a patient’s elevated mean glucose level needs lowering toward an ideal level. 38
A recent study compared a control group of 40 patients from the United Kingdom and United States on CGM-enabled pumps with 46 others who switched to a complete AID system. 39 After 12 weeks, the mean A1c level declined from 7.8% to 7.7% in the control group and from 8.0% to 7.4% in the AID group. Although some patients achieved the ADA’s A1c goal of 7.0% or less with the help of this AID, most did not.
The GV in the participant’s CGM readings started high value at 40% and remained equally high at 40% at the end of the study despite the AID’s interventions. Stable euglycemia becomes quite challenging when glucose readings continue to be this variable. Researchers have linked GV to increased risks for retinopathy and neuropathy in type 2 diabetes.40,41 A similar linkage in PwT1D is likely.
Healthy individuals without diabetes have an average GV in the mid-teens. Clinical studies recommend reducing GV to less than 33% and preferably less than 30% to minimize hypoglycemia risk, when mean glucose levels are being lowered.42,43 Correction of nonphysiological BC settings and DIA times can reduce GV, allowing more PwT1D to lower their A1cs safely while achieving a higher percentage of time in range (TIR).
Guidelines for Insulin Titration and Selection of IDD Settings
For optimal results, all AID systems and IDDs rely on accurate TDDs, basal rates, ICRs, CorrFs, and DIA times. Errant pump and BC settings are often directly transferred to AIDs despite their nonphysiological characteristics. AID algorithms do not yet analyze whether a particular BC setting is appropriate or whether it contributes to hypoglycemia or hyperglycemia. Although AIDs do lower A1c levels and improve TIR, errant settings continue to impede optimal glycemic outcomes and safe lowering of glucose levels. A 100 years in, the approved insulin titration guidelines required to select such settings remain missing.
In diabetes care, human factors like numeracy issues, clinical complacency, and inadequate teaching and training are ongoing. Figures 1, 2, 3, and 6 show that numeracy remains a confounding factor for clinicians and PwT1D. 44 The absence of insulin titration guidelines continues to impede normoglycemia and maximal reductions in diabetes-related complications during this lifelong disease. The disarray in device settings demands exceptional attention to training clinicians and patients in the selection of appropriate personalized TDDs and device settings.
A wealth of data exists in IDD databases that can improve and standardize insulin titration guidelines once they are adequately analyzed. Today’s BCs and AID systems record all the data, other than a patient’s weight, needed for artificial intelligence (AI) systems to correct errant settings in real time. AI systems can also identify and address behavior issues that contribute to poor glycemic outcomes. Solutions to hyperglycemia and excess GV will benefit by de-identified data becoming available to researchers and clinicians for interdisciplinary analysis.
Analysis of these data can improve the accuracy of individual TDDs and BC settings, and improve insulin doses. Data analysis can also monitor the effectiveness of initiatives designed to improve BC settings and outcomes.
We are transiting from dumb BC technology to more sophisticated and intelligent diabetes management tools. BC setting values derived from a large group of well-controlled patients with lower mean glucose levels, high TIR, and minimal frequency of hypoglycemic events would provide insight into optimal insulin titration formulas. These improved formulas for BC settings would enhance glycemic control and improved diabetes outcomes now while hastening AI system enhancements in the future.
Newer AI interventions have significantly improved patients’ glucose control45,46 and reduced the daily decisions required of PwT1D. Rapid integration of AI suggestions to improve personal BC settings and behaviors would be an important focus for regulatory agencies once AI solutions are shown to lower and stabilize glucose readings.
Caution is required when analyzing existing IDD data sets. Clinical habits built up over the decades have produced the discordant BC settings discussed above. The BC settings now populating IDD data sets produce less-than-optimal A1c outcomes and excess GV.
Summary
HCPs and PwT1D require straightforward insulin dose recommendations to optimize glucose outcomes. Despite the long history of insulin, diabetes care continues to lack evidence-based insulin titration guidelines and their successful implementation into IDDs. Today’s impressive diabetes technology and data can begin to dismantle the disarray in BC settings and improve clinical outcomes.
Hyperglycemia remains the primary glucose control issue for PwT1D. Personalization and optimization of an individual’s TDD provide the first step to reduce elevated mean glucose levels and improve glycemic outcomes. The optTDD provides an excellent starting point for selecting an average basal rate and other pump settings when guided by well-thought-out and tested formulas. Increasing the trust of PwT1D in their insulin dose recommendations requires professional oversight and straightforward procedures to select an appropriate TDD and BC setting parameters.
To enhance the rapid developments underway in new insulins and new technologies, we recommend that national and international diabetes professional societies form an Insulin Advisory Committee (IAC). The IAC’s initial goal is to develop insulin settings and titration guidelines that advance optimal glycemic outcomes in BCs and AIDs. They must develop these guidelines independently of competitive influences from existing insulin dosing software, yet allow for future creative developments. Table 4 provides an initial outline for IAC recommendations.
IAC Actions to Improve Glucose Outcomes
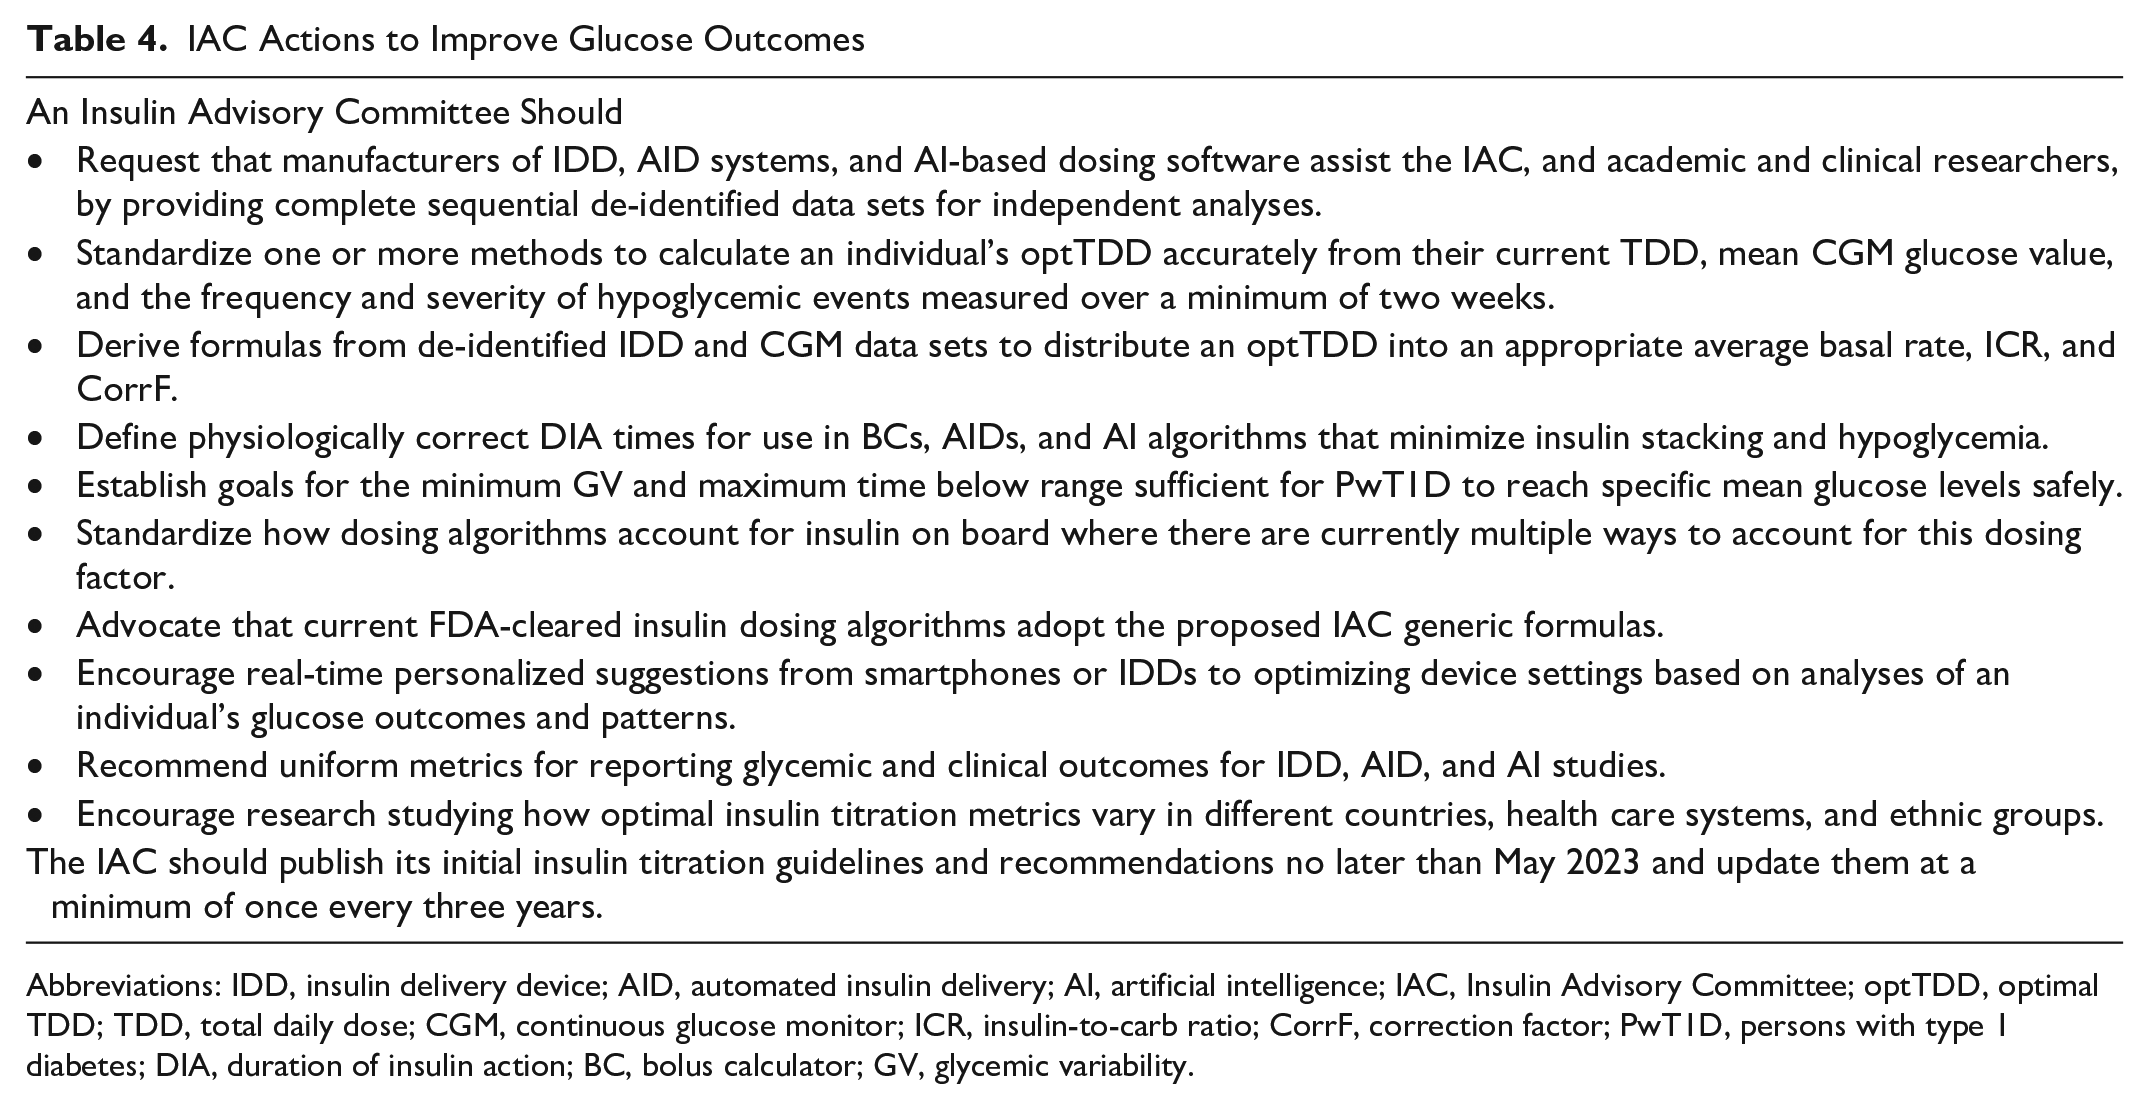
Abbreviations: IDD, insulin delivery device; AID, automated insulin delivery; AI, artificial intelligence; IAC, Insulin Advisory Committee; optTDD, optimal TDD; TDD, total daily dose; CGM, continuous glucose monitor; ICR, insulin-to-carb ratio; CorrF, correction factor; PwT1D, persons with type 1 diabetes; DIA, duration of insulin action; BC, bolus calculator; GV, glycemic variability.
Footnotes
Abbreviations
ADA, American Diabetes Association; AI, artificial intelligence; AID, automated insulin delivery; AIT, active insulin time; APP, actual pump practices; BC, bolus calculator; BG, blood glucose; CGM, continuous glucose monitoring; CorrF, correction factor; DIA, duration of insulin action; DKA, diabetic ketoacidosis; GV, glycemic variability; HCPs, health care professionals; HGT, high glucose tertile; IAC, Insulin Advisory Committee; IAT, insulin action time; ICR, insulin-to-carb ratio; IDD, insulin delivery device; IOB, bolus insulin on board or active bolus insulin; LGT, low glucose tertile; optTDD, optimal TDD; PwT1D, person(s) with type 1 diabetes; SC, subcutaneous; TDD, total daily dose; TIR, time in range; T1D, type 1 diabetes; U, units.
Declaration of Conflicting Interests
The author(s) declared the following potential conflicts of interest with respect to the research, authorship, and/or publication of this article: J.W. has no conflicts to declare. R.R. has no conflicts to declare. T.S.B. has Research Support from Abbott, Capillary Biomedical, Dexcom, Diasome, Eli Lilly, Kowa, Lexicon, Medtronic, Medtrum, Novo Nordisk, REMD, Sanofi, Senseonics, Viacyte, vTv Therapeutics, and Zealand Pharma; Consulting Honoraria from Abbott, LifeScan, Novo, and Sanofi; and Speaking Honoraria from BD, Medtronic, and Sanofi. L.H. holds shares in the Profil Institute for Metabolic Research, Neuss, Germany, and is consultant for a range of companies that develop new diagnostic and therapeutic options for the treatment of patients with diabetes.
Funding
The author(s) received no financial support for the research, authorship, and/or publication of this article.