
Abstract
Objective:
Accurate, safe glycemic management requires reliable delivery of insulin doses. Insulin can be delivered subcutaneously for action over a longer period of time. Needle-free jet injectors provide subcutaneous (SC) delivery without requiring needle use, but the volume of insulin absorbed varies due to losses associated with the delivery method. This study employs model-based methods to determine the expected proportion of active insulin present from a needle-free SC dose.
Methods:
Insulin, C-peptide, and glucose assay data from a frequently sampled insulin-modified oral glucose tolerance test trial with 2U SC insulin delivery, paired with a well-validated metabolic model, predict metabolic outcomes for N = 7 healthy adults. Subject-specific nonlinear hepatic clearance profiles are modeled over time using third-order basis splines with knots located at assay times. Hepatic clearance profiles are constrained within a physiological rate of change, and relative to plasma glucose profiles. Insulin loss proportions yielding optimal insulin predictions are then identified, quantifying delivery losses.
Results:
Optimal parameter identification suggests losses of up to 22% of the nominal 2U SC dose. The degree of loss varies between subjects and between trials on the same subject. Insulin fit accuracy improves where loss greater than 5% is identified, relative to where delivery loss is not modeled.
Conclusions:
Modeling shows needle-free SC jet injection of a nominal dose of insulin does not necessarily provide metabolic action equivalent to total dose, and this availability significantly varies between trials. By quantifying and accounting for variability of jet injection insulin doses, better glycemic management outcomes using SC jet injection may be achieved.
Keywords
Introduction
Insulin jet injectors are an alternative insulin delivery method for individuals requiring glycemic management, such as people with diabetes. A jet injector uses a high-pressure stream of liquid to penetrate the skin and deliver insulin subcutaneously, as opposed to standard syringe delivery. This delivery method aimed to reduce delivery pain associated with reduced rates of patient self-injection, and provide an acceptable alternative for individuals with a phobia of needles. In addition, this method achieves total insulin action equivalent to needle injection with significantly faster onset and reduction in glucose levels. 1
Jet injectors are most discussed in literature from the late 1980s to the 1990s,2-6 but have not become a common method for insulin administration. 7 Where usage of jet injectors has been examined in literature, a number of issues have been reported by users, such as prolonged pain at injection site relative to syringe delivery, bleeding or bruising at injection site, and incomplete delivery due to leaking of injected liquid.3,8,9 In addition, jet injectors require a higher degree of training and more cost than alternatives. 5 As such, jet injectors have not been regularly recommended for regular insulin administration. 10 In addition, uptake of modern insulin pump therapy may have supplanted jet injection as the preferred alternative to needle injection. 11
Variance in delivery profile is a notable issue for achieving accurate and precise glycemic control (GC). Studies where incomplete jet injection delivery is quantified provide grouped statistics,4,6,9,12 but no methodology to reliably assess proportion of insulin absorbed on an individual basis. Furthermore, studies of jet injectors do not take account for potential inter-subject losses relative to needle injection.13,14 Jet injection still presents potential advantages for glycemic management, including higher insulin absorption and faster reduction in glucose levels,2,4,6 so long as potential delivery loss is accounted for.
Validated mathematical models describe dynamics of a subject’s insulin delivery and resultant glycemic state.15-18 Where dynamics can vary, identification of certain model parameters allows a model to explain variation between cohorts, subjects, or individual trials as a difference in parameter values.19,20 To assess the degree of subcutaneous (SC) jet injection loss in a trial, a model can be expanded with a parameter representing loss of delivered insulin. Identification of this loss parameter using measured assay data allows assessment of subject-specific or trial-specific loss, and more completely explains subsequent insulin kinetics. This process will help quantify a range of expected losses from SC jet injection delivery, and inform future jet injection development and treatment.
Method
Subjects and Data
A SC insulin-modified oral glucose tolerance test trial was performed at the University of Canterbury. N = 9 tests from seven subjects were analyzed. Table 1 provides the subject demographics for this trial, where suffixes “a” and “b” denote different tests performed on the same subject over two weeks apart. Subjects were fasted for 12 hours prior to the start of the trial. For each trial, one plasma sample was collected at basal state, followed by eight post-stimulatory samples over a 120-minute trial period. The sampling and delivery protocol is shown in Figure 1. At t = 0 min, subjects consumed 35 g of glucose dissolved in 200 ml of water. At t = 15 minutes, a nominal 2.0 units of fast-acting insulin in 0.4 ml was delivered using a jet injector device developed by the Auckland Bioengineering Institute’s Bioinstrumentation Laboratory (University of Auckland, Auckland) into the subject’s thigh. Collected samples were assayed for plasma insulin and C-peptide concentrations using the Roche Cobas e411 analyzer (Roche Diagnostics, Basel). C-peptide measurements estimate pancreatic insulin secretion rates during trial. 21
Subject Demographics for the OGTT Trial.
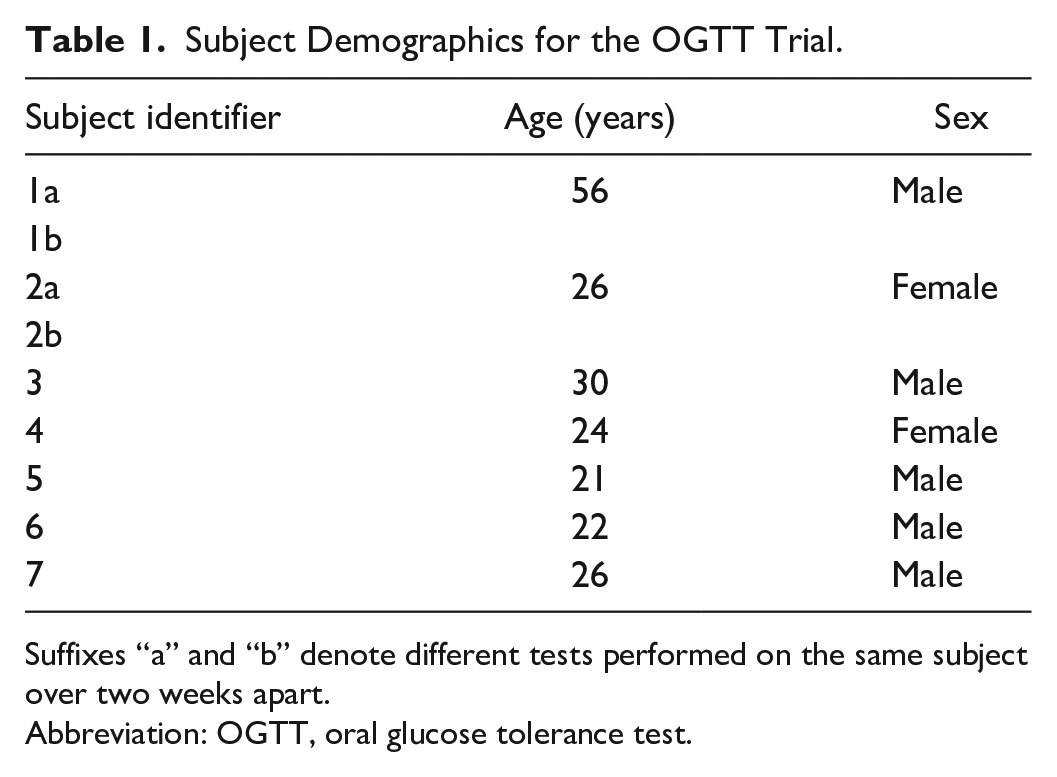
Suffixes “a” and “b” denote different tests performed on the same subject over two weeks apart.
Abbreviation: OGTT, oral glucose tolerance test.
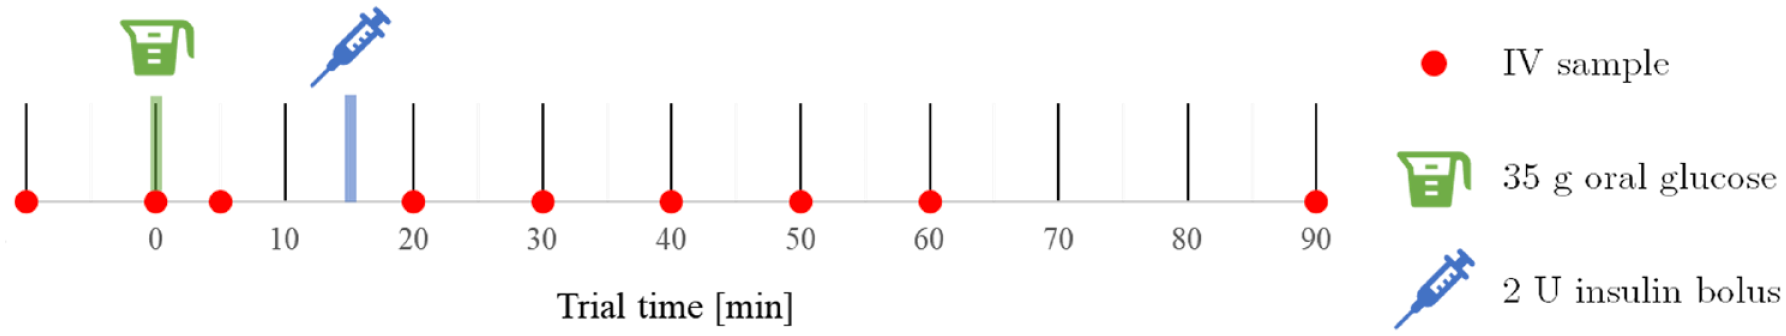
Trial protocol and timing.
Model
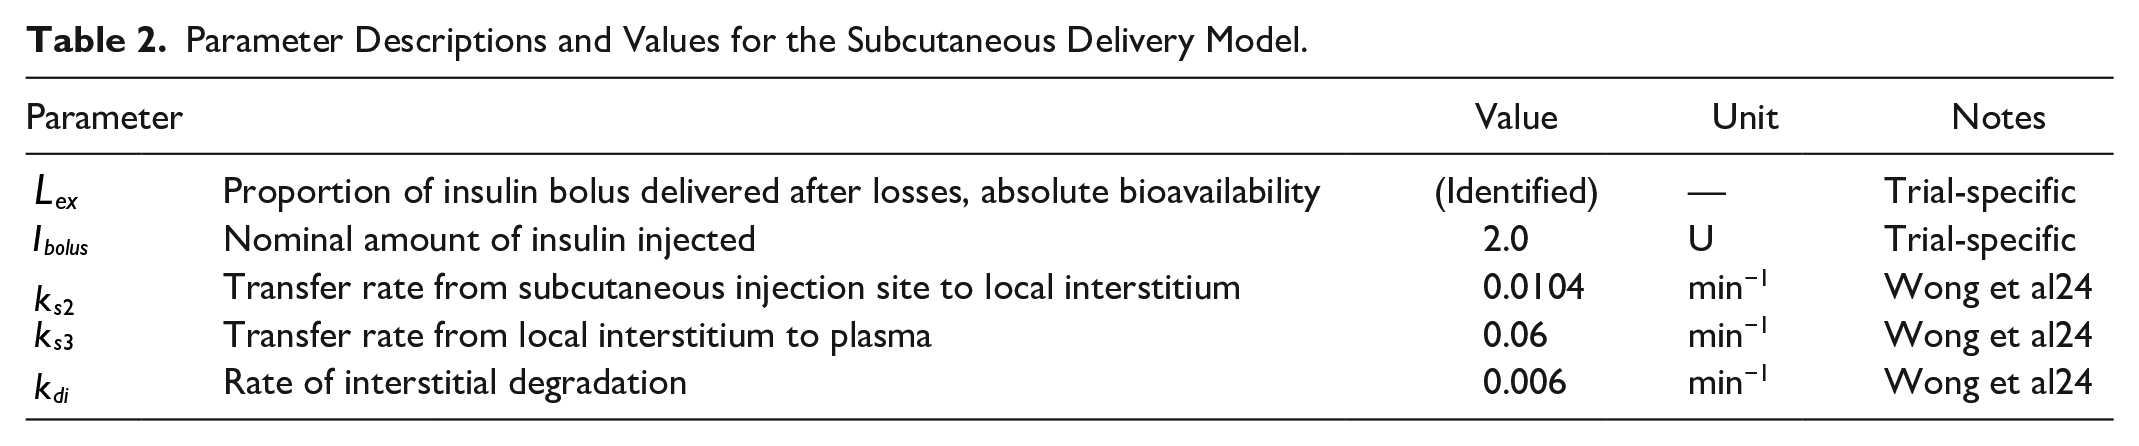
Subcutaneous delivery of insulin is modeled by a two-compartment model showing transfer of insulin from the SC injection site


Parameter Descriptions and Values for the Subcutaneous Delivery Model.
Glucose-insulin kinetics in plasma are modeled over time with a clinically validated three-compartment GC model,
15
whose parameters are defined in Table 3. A diagram of this model and the SC model is provided in Figure 2. The compartments of interest, plasma insulin
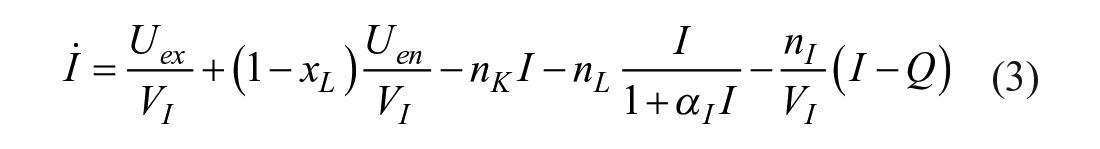
where for SC delivery

Parameter Descriptions and Values for the Glycemic Control Model.
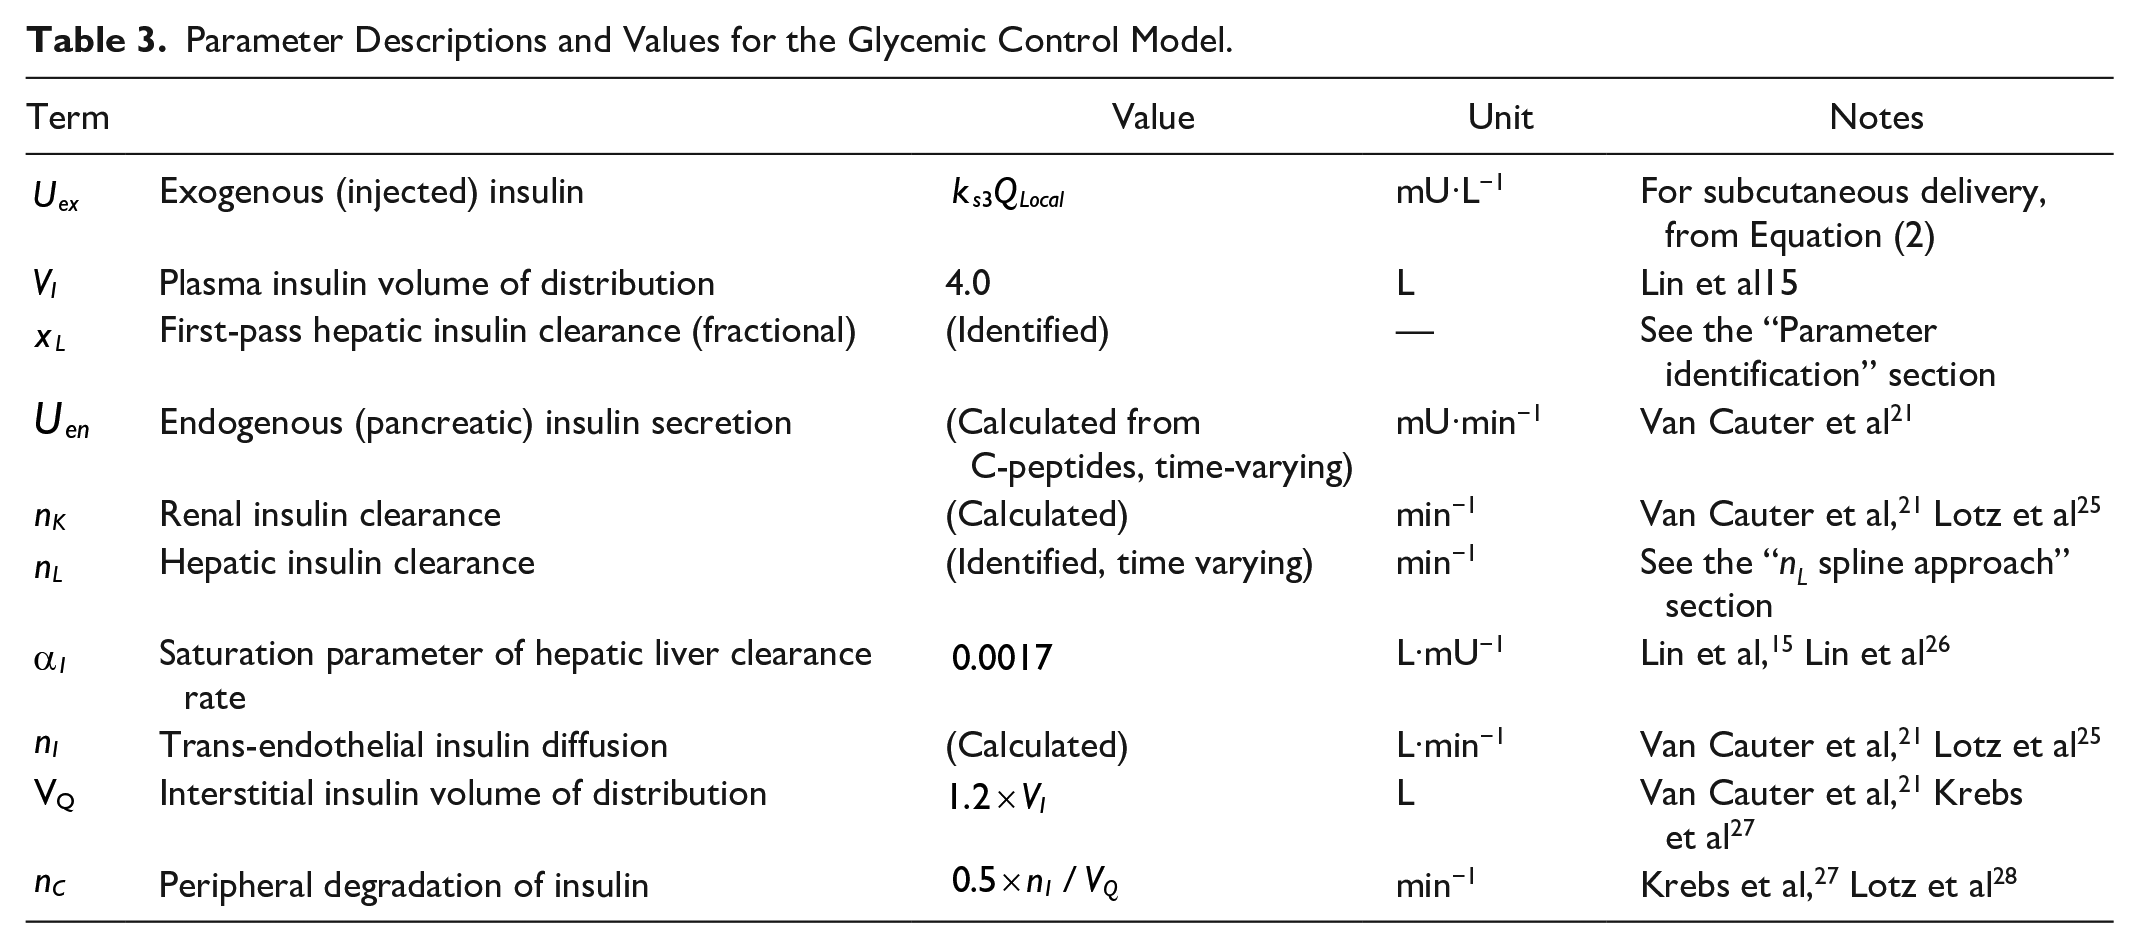
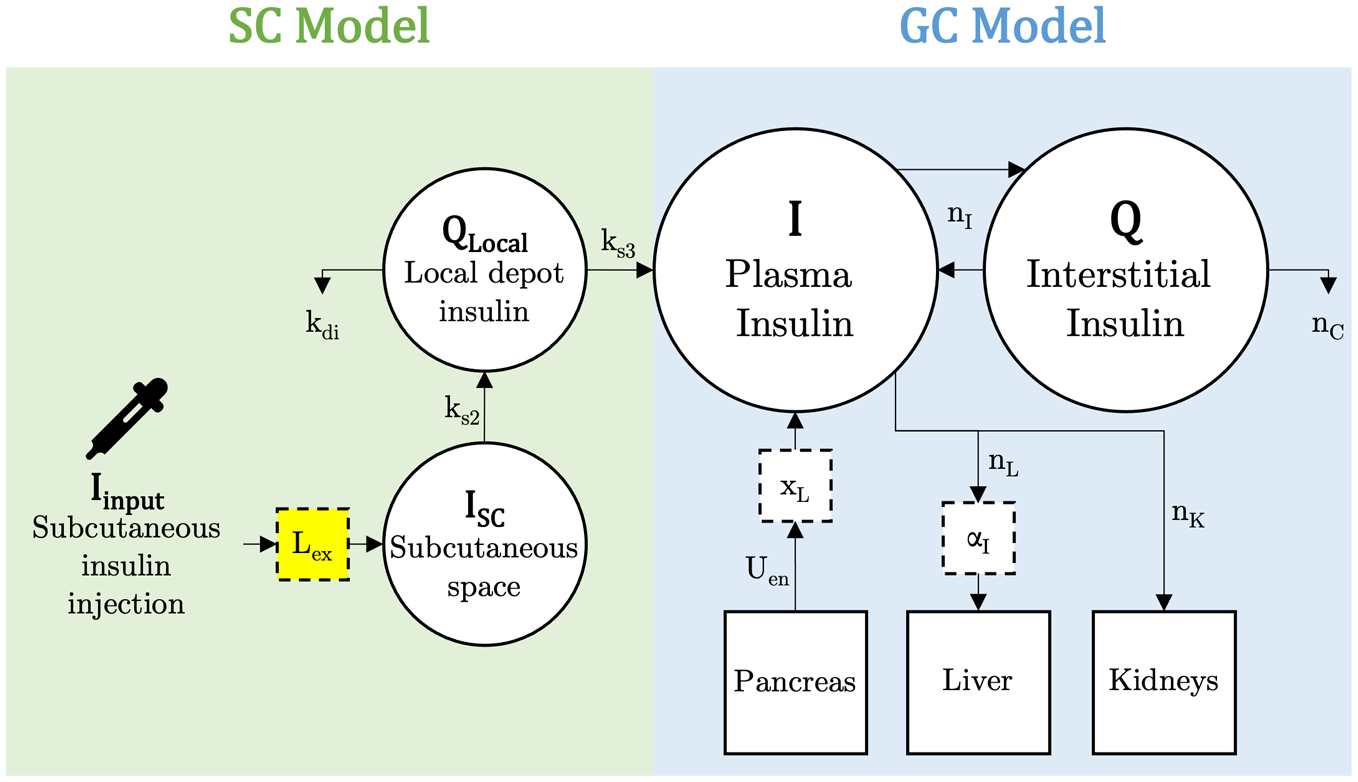
Diagram of SC and GC model compartments. The introduced delivery loss factor,
Parameter Identification
Introducing additional identified parameters to a model increases model complexity and contributes to theoretical and practical identification issues.19,29,30 Simultaneous identification can also involve trade-off between parameter values, introducing further error.19,31 Thus, consideration must be given to the order and method by which parameters are identified. As such, when introducing a new parameter which interacts with others, some parameters must be fixed to a population or cohort constant value, or chosen parametrically per subject without mathematical identification. This approach limits possible parameter trade-off and identification issues, and can yield more accurate identification. Analysis of parameter trade-off between
spline approach
A subject’s rate of hepatic insulin clearance

A single

To ensure clearance profiles reflect measured dynamics and do not overfit the data, a subject with N insulin measurements uses knots located at these measurement times to model
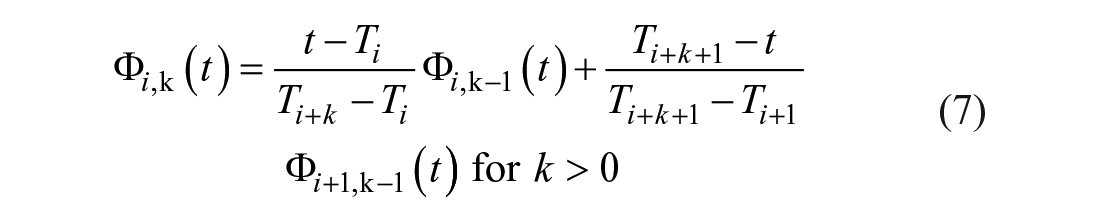
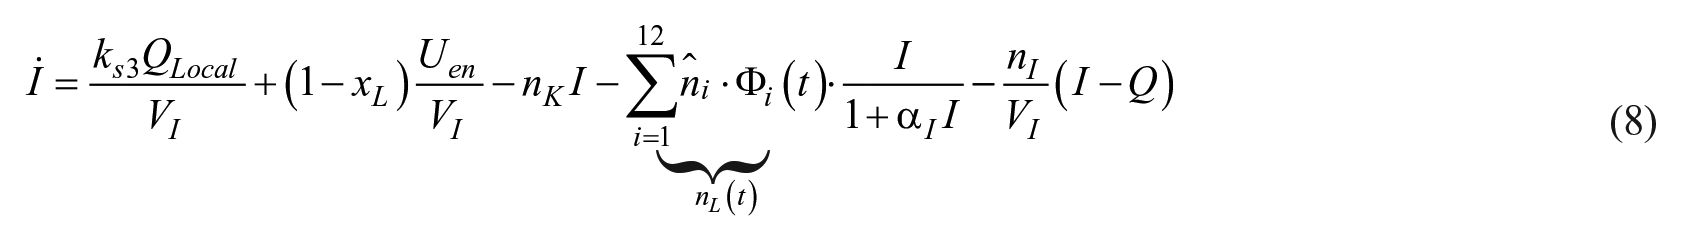
The spline definition in Equation (5) is applied to the compartment equation in Equation (3), where
For this definition,
Spline weightings
Interpolate N insulin assay measurements to get a minute-wise
Analytically solve Equation (4) to get a minute-wise estimate of
Substitute
Numerically integrate Equation (8) between pairs of measurement times
Using linear least squares regression solve for optimal weightings
To ensure the identified
In addition, the rate of change of

Mathematically, these constraints are applied at all knot locations,
Identification of
With the overall dynamics of the
Analyses
The primary analysis is determining the range of optimal loss factor values present for this cohort. Comparing the accuracy of the modeled
The second analysis involves the magnitude of general hepatic clearance
Finally, the sensitivity of identified
Results
A selection of
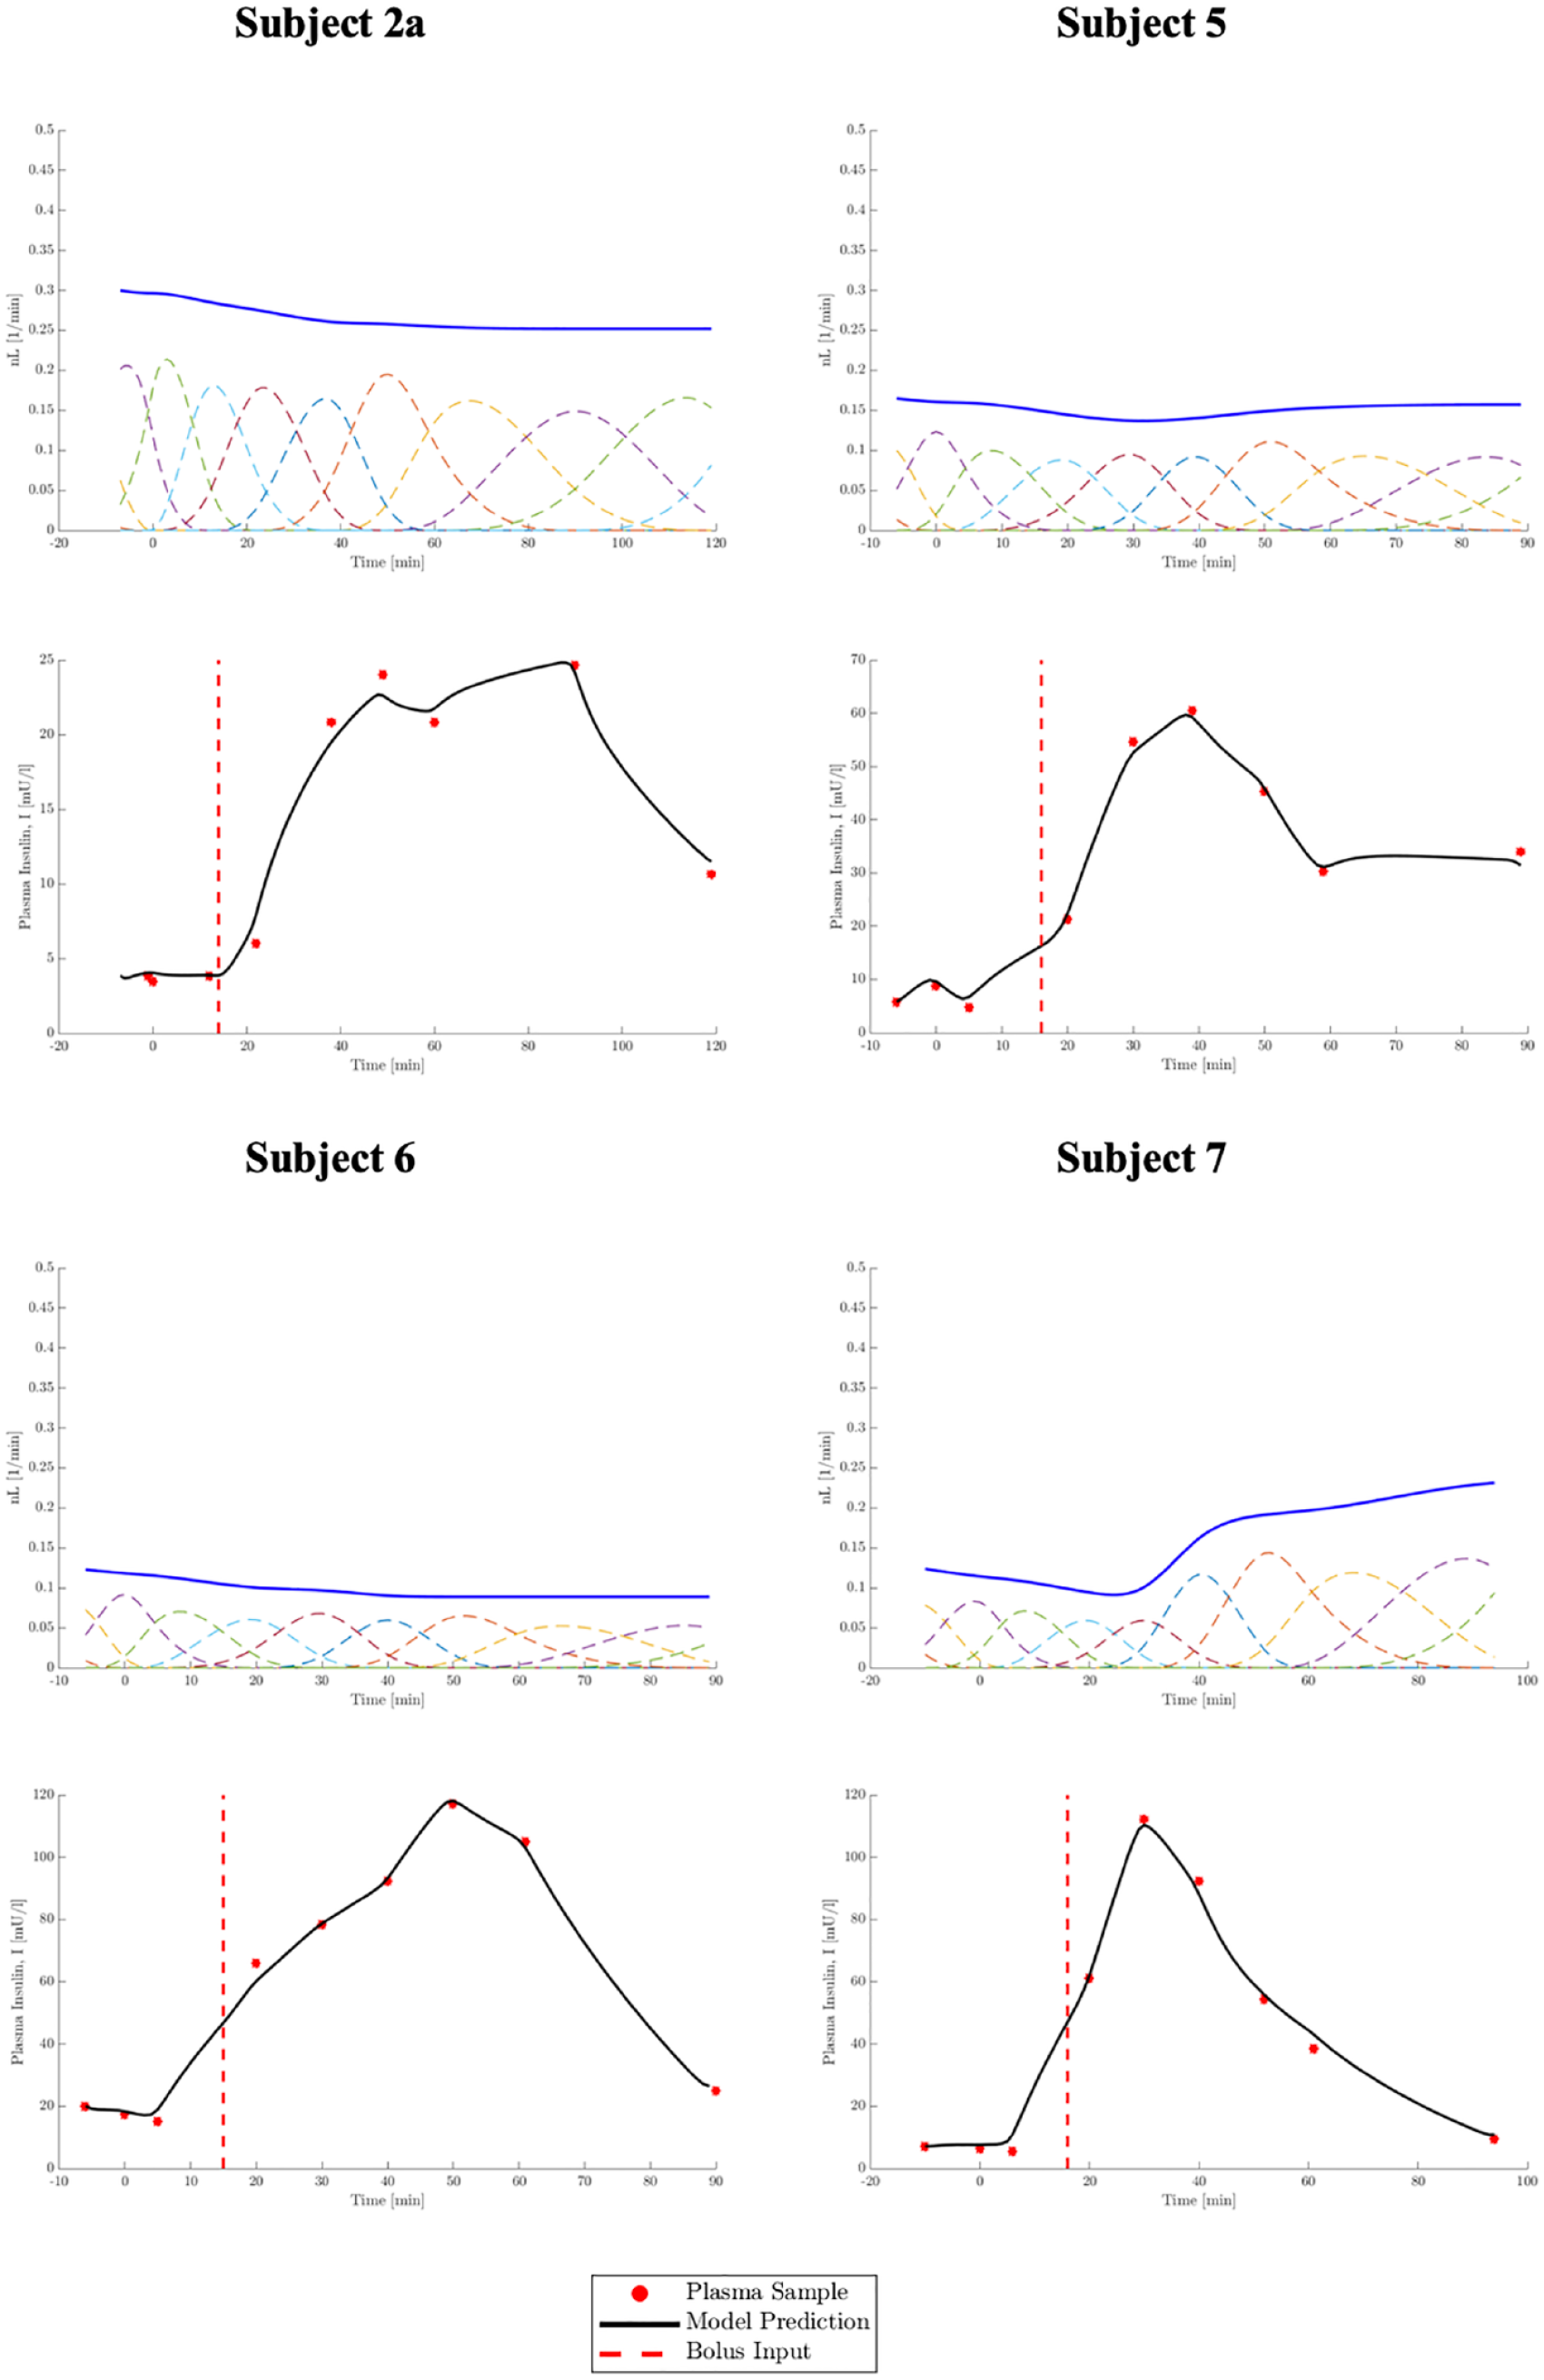
Selection of four
Table 4 presents the
Insulin Fit RMS Errors for Cases.
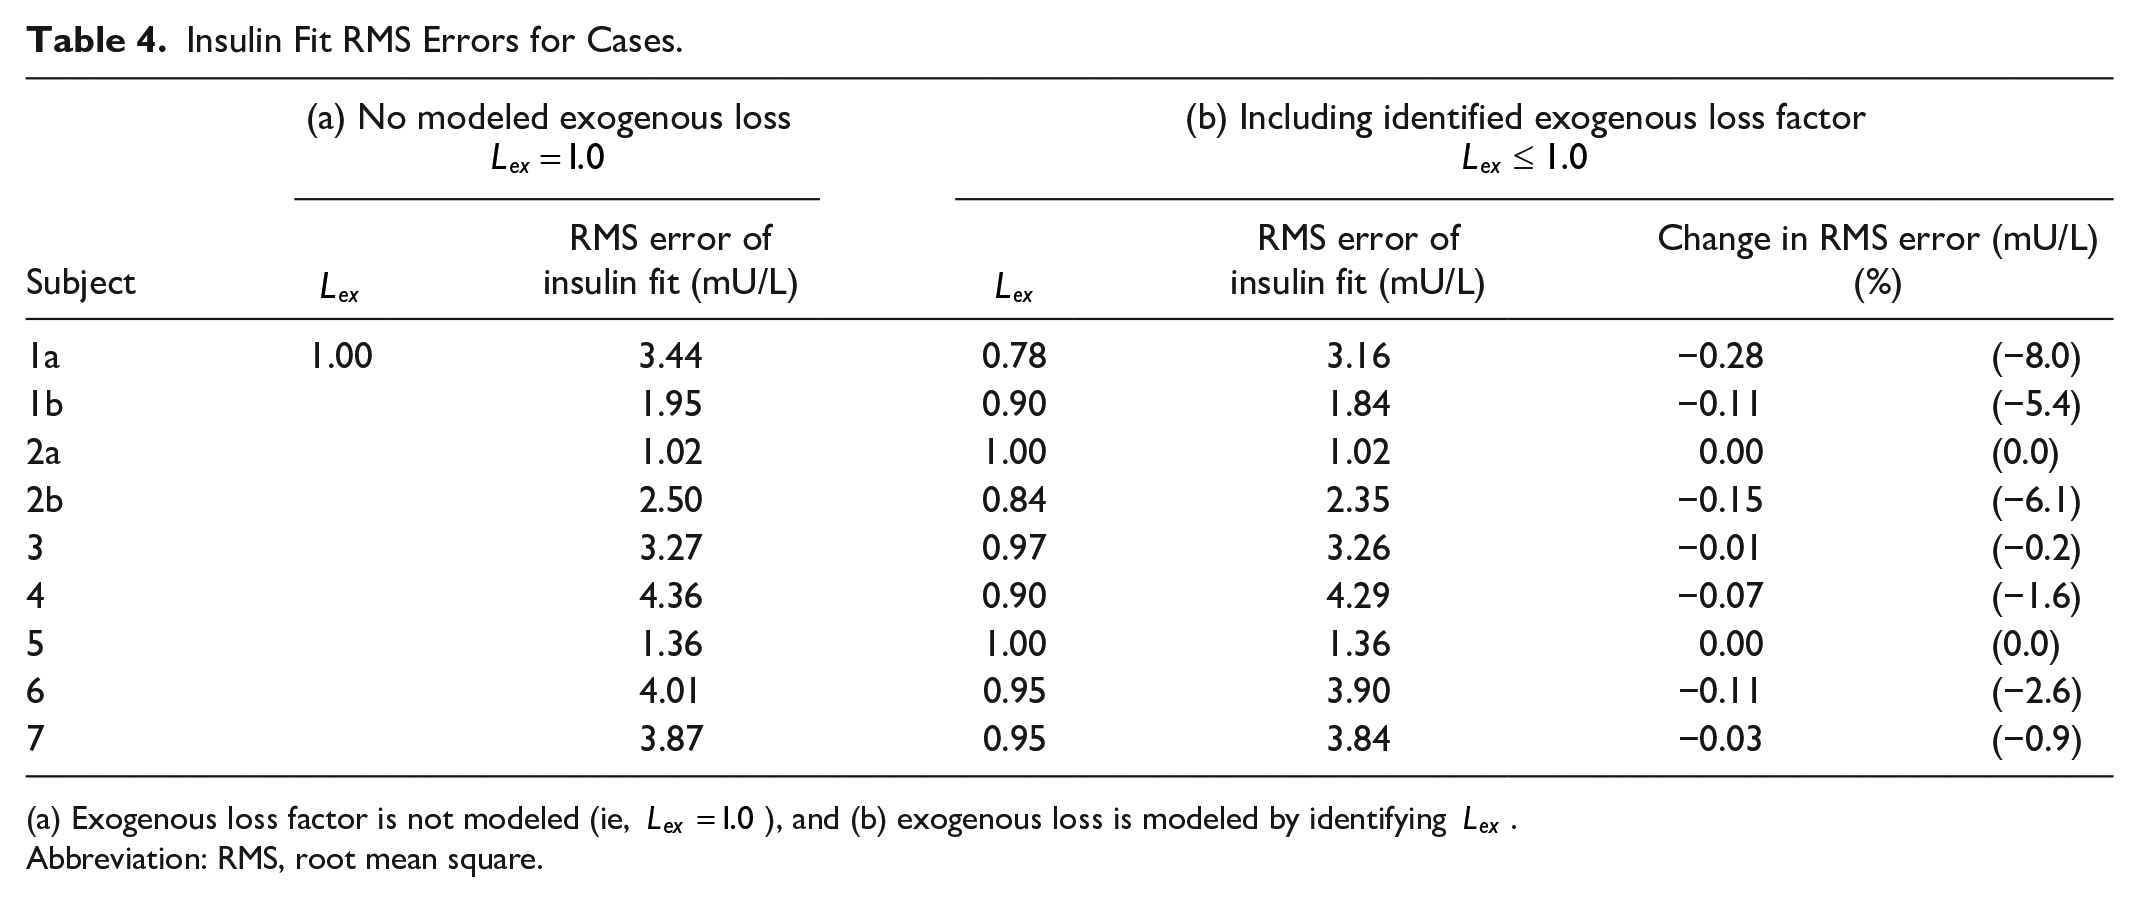
(a) Exogenous loss factor is not modeled (ie,
Abbreviation: RMS, root mean square.
Where insulin fit error is high relative to other subjects, such as for subjects 1a, 3, and 4, this is consistently due to modeled insulin not rising fast enough to meet measured data points during first-phase secretion
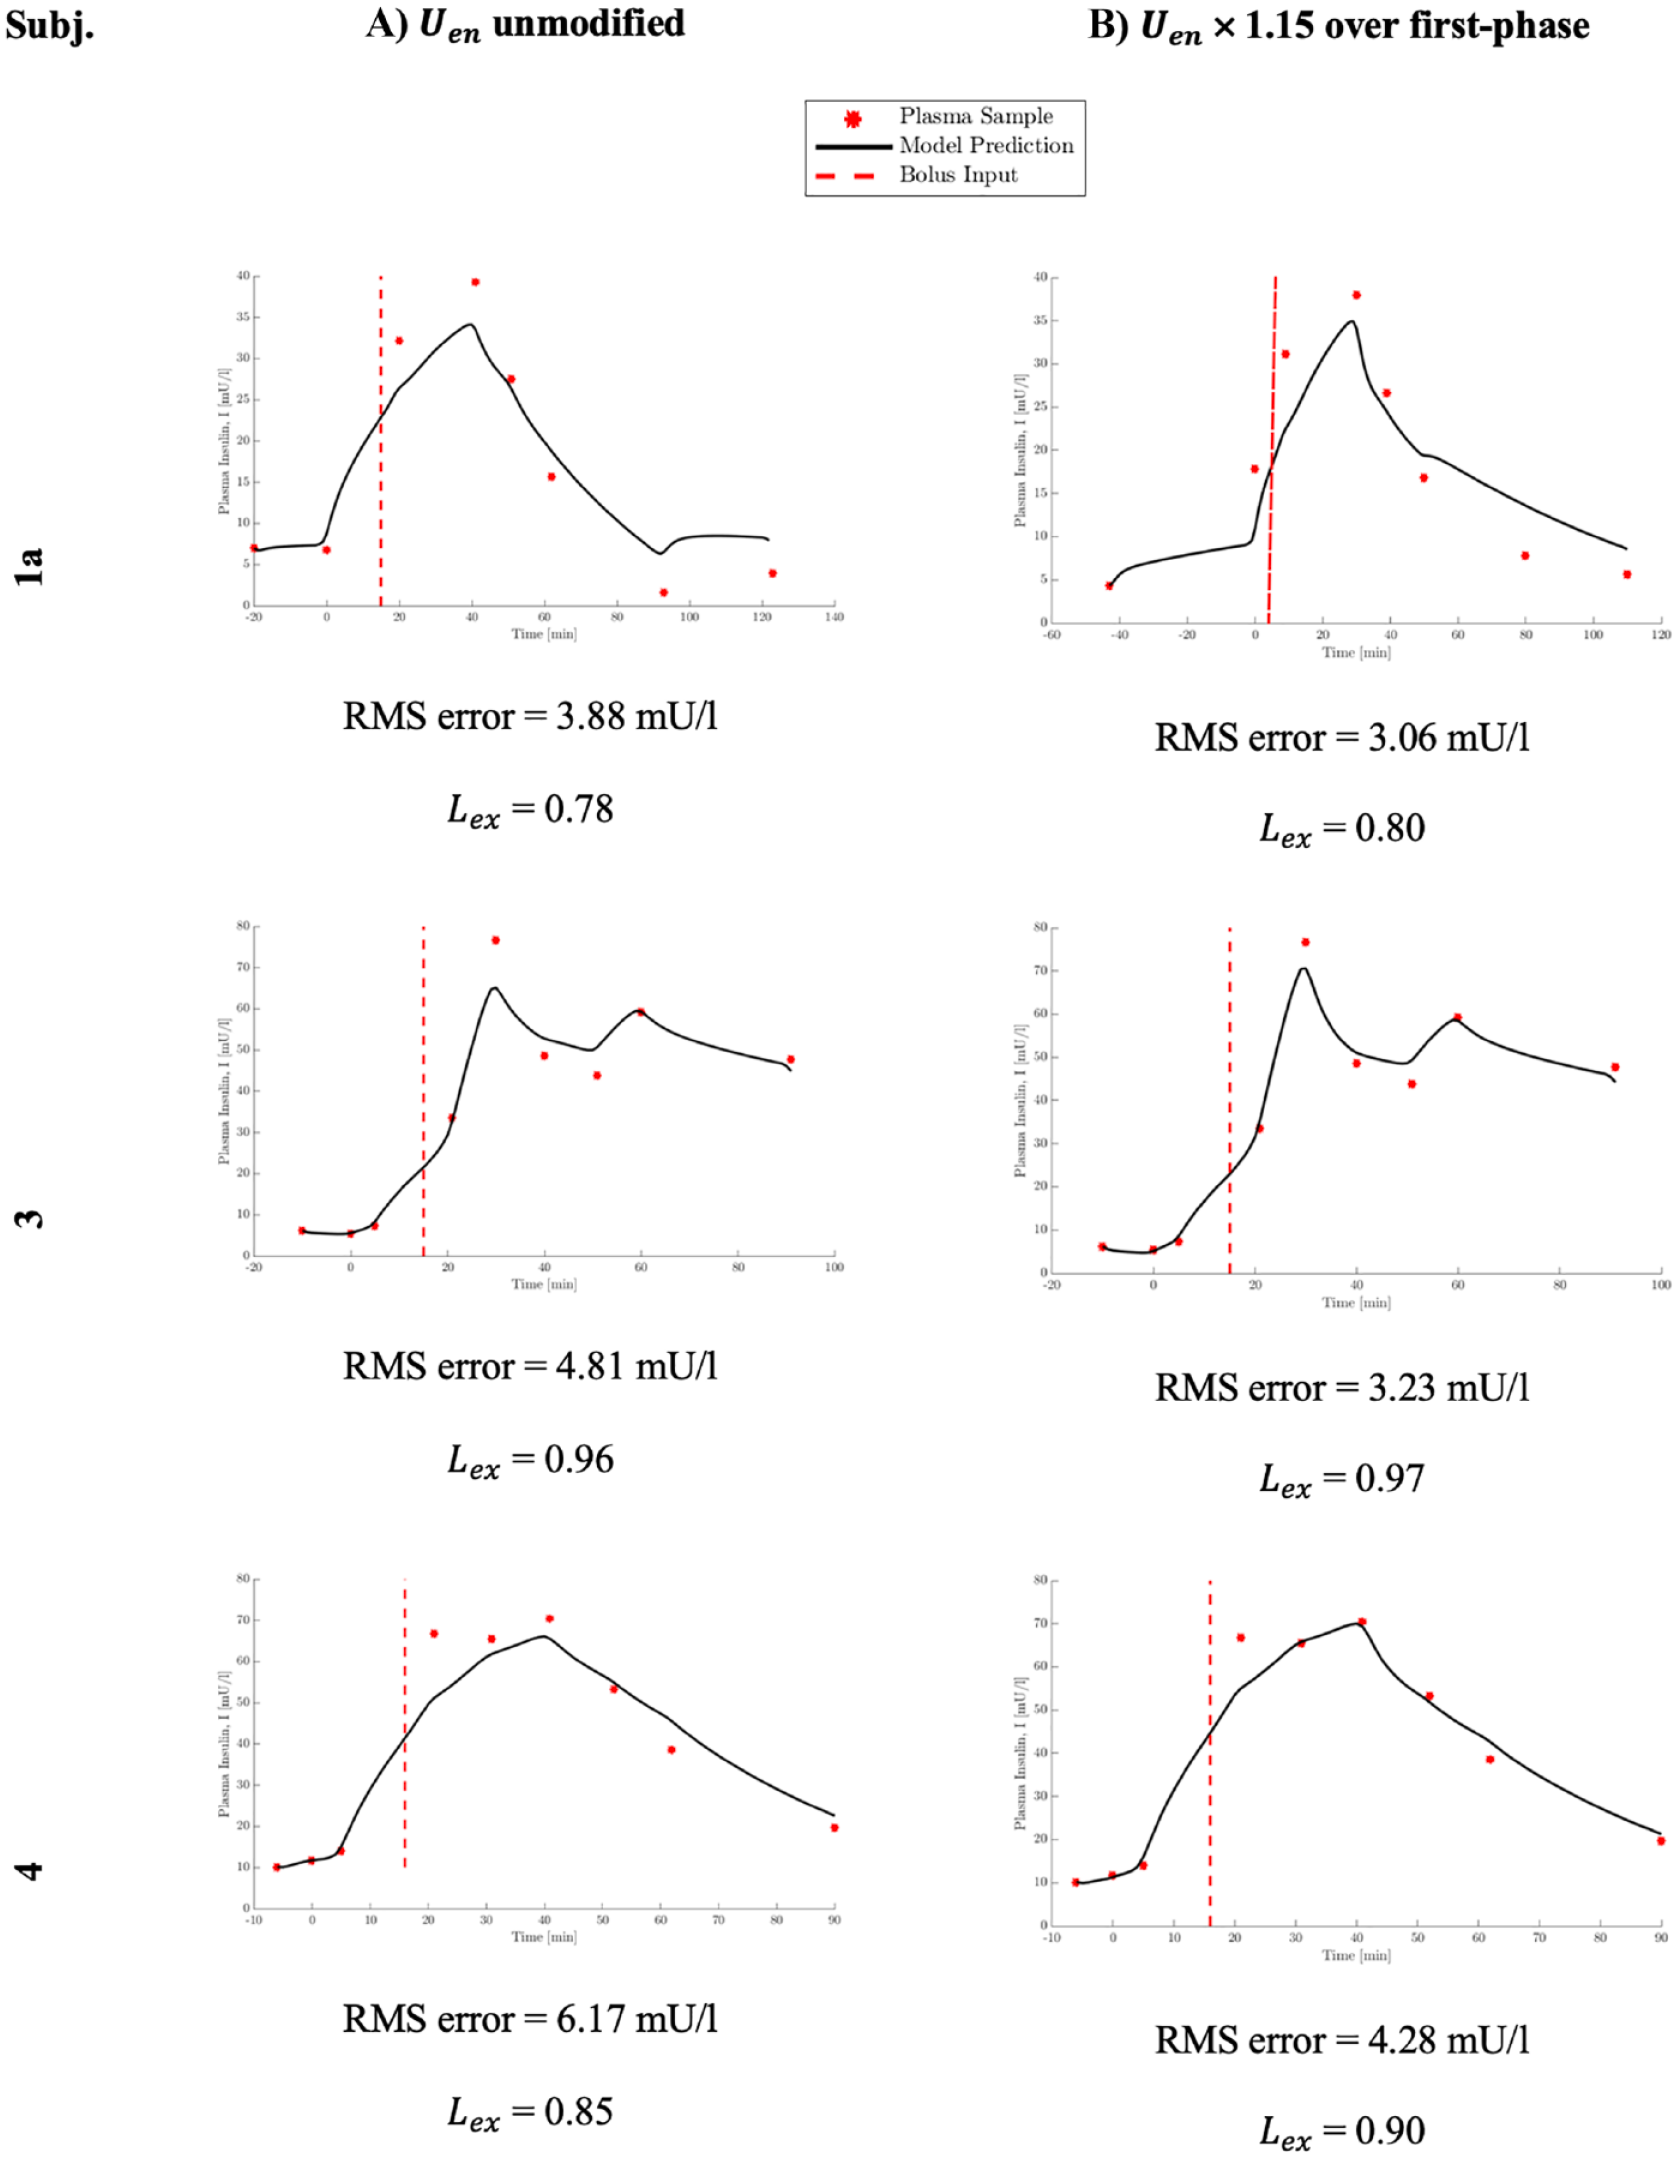
Insulin profiles. (a) As originally modeled with no modification to
The sensitivity of
Sensitivity Analysis of
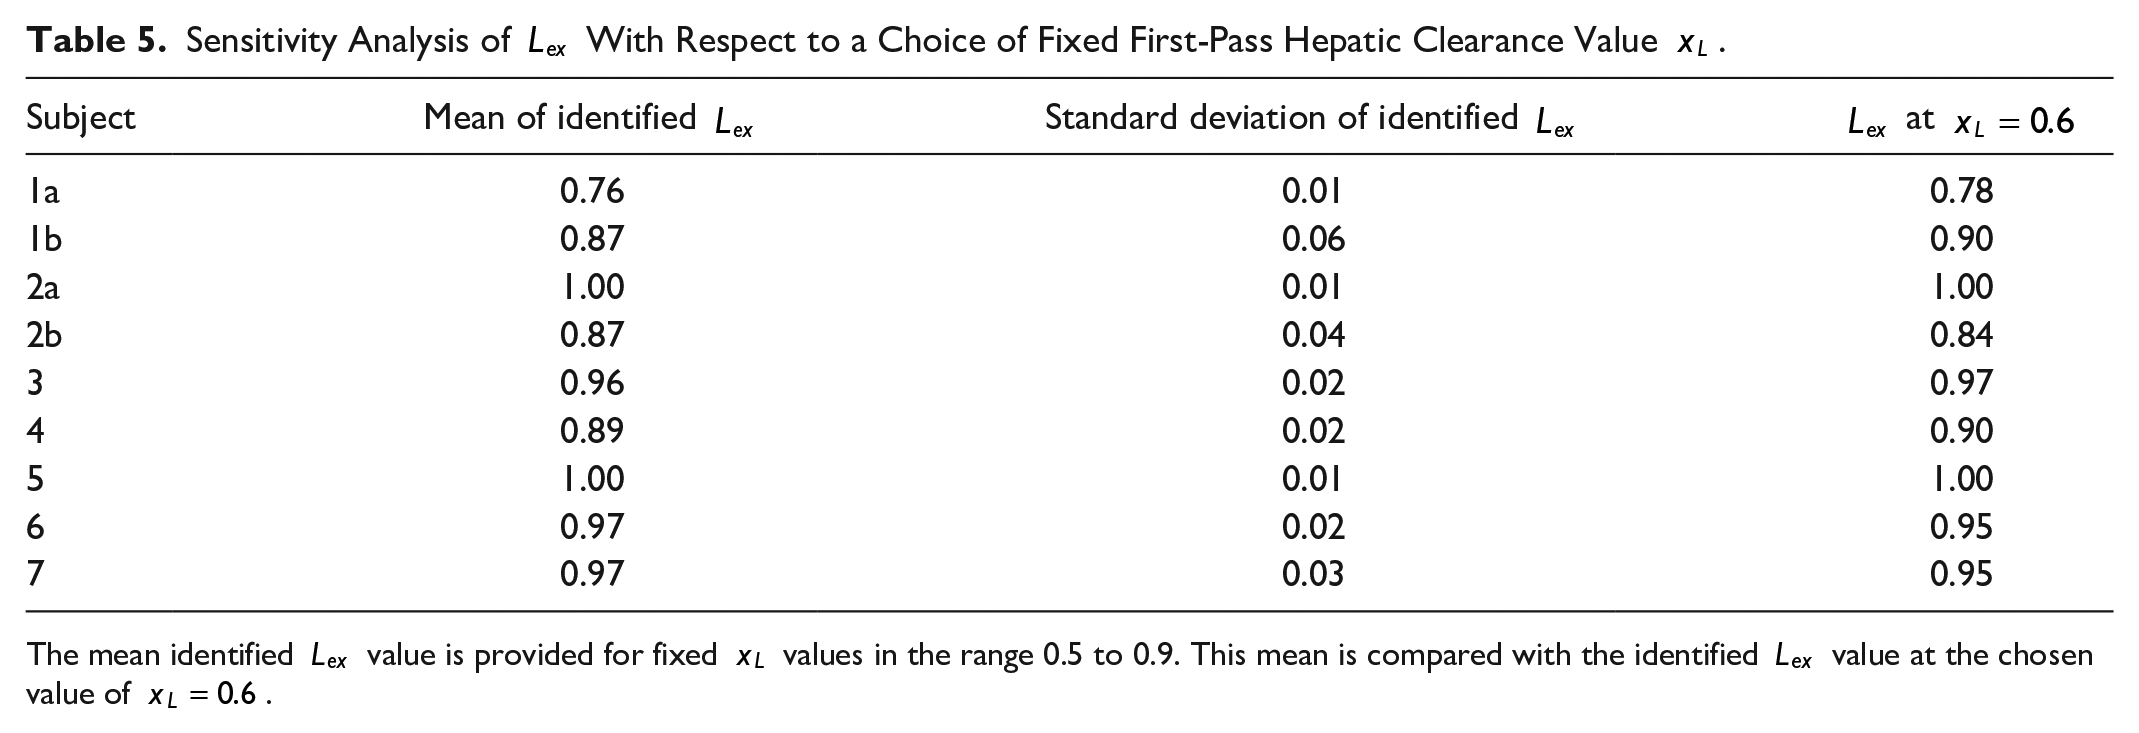
The mean identified
Discussion
Outcomes
Modeling accuracy is significantly improved when accounting for potential SC delivery losses, as observed in Table 4. Where a subject’s optimal loss factor is
Multiple factors may contribute to this apparent loss, including pooling at injection sites42 and incomplete ejection from the jet injector or incomplete injection into the skin. These factors are difficult or impossible to measure directly. Thus, identifying this loss on a per-subject basis from clinical assays and modeling post-test are a useful result when considering this type of new technology where losses are a potential likelihood. While inaccurate model parameters could cause apparent loss, these models have been well validated in clinical trials28,43,44 and for assessing insulin kinetics
45
and its parameter values validated with research of human physiology.21,24,27,37 Thus, the loss factor,
The analysis in Figure 4 shows significant insulin fit errors are not due to identification of
The sensitivity analysis in Table 5 shows for any physiologically realistic choice of
Therefore, for the purposes of identifying a loss factor which best explains the appearance of exogenous insulin, it is justified to choose a fixed value of
Overall, these results demonstrate a significant degree of loss may be present for some subjects during SC jet injection delivery of insulin. Expanding the modeling approach to capture this effect allows indirect measurement of SC delivery loss, and improves the accuracy of modeled insulin profiles.
Limitations
Due to the number of variable parameters in the model, the value of
Subcutaneous absorption rate parameters
While the number of subjects examined in this trial could be seen as a limitation, Table 4 shows every subject experienced improved insulin fit accuracy where any significant loss over 5% was identified. Given delivery loss is a known factor in this type of exogenous delivery, accounting for it in the model can only improve fit accuracy. If no loss is present, the optimal loss factor will be near 1.0, as demonstrated by subjects 2a and 5 in Table 4. As such, further subjects would demonstrate the same improvements in accuracy where any insulin loss is present, as seen for subjects 1a, 1b, and 4. Thus, this cohort is sufficient to demonstrate modeling potential loss allows for a significant improvement in fit accuracy. However, the results showing 33% of subjects had a significant loss over 5% of the delivered amount might not hold in a larger study or with greater use of the device.
Due to safety limitations on this specific trial and the healthy cohort subjects used, the quantity of insulin delivered was limited to 2U to avoid hypoglycemia. A cohort with type 1 or severe type 2 diabetes, of more relevance to jet injection therapy, would be treated with a larger dose, whether fixed for each subject or relative to subject weight. However, the dynamic insulin sensitivity and secretion test protocol on which our methods are based was designed with a low-quantity, fixed dose, 28 and exhibits no difference to identification between fixed or weight-dependent doses. 37 This protocol is proven to accurately identify insulin kinetics and sensitivity; 36 therefore, a 2U dose is appropriate for demonstrating the identification protocol used in this study.
Table 4 quantifies the proportion of nominal insulin dose which enters plasma. However, the above data and analysis do not consider the potential of constant insulin losses, for example, a fixed volume lost to surface pooling It is possible the degree of loss is dependent on dosage volume and amount, 46 where these were constant and relatively low in this study. These results alone cannot conclude what level of consistent or proportional exogenous insulin loss is expected. Rather, the method presented identifies a trial-specific proportion of loss, and provides a method for identifying this value when it is significantly different from 1.0 (no loss). Future research should analyze this loss effect with different volumes or amounts of insulin using the methods presented in this study.
Implications
The methodology described above has been shown to determine trial-specific magnitude of exogenous loss factors in a clinical setting when using jet injection delivery or any similar delivery method which might have significant losses. Furthermore, the methodology can quantify apparent losses of unknown quantity, such as pooling or leakage at an injection site. These results demonstrate loss is variable between subjects, and between trials on one subject, where this is not considered in some analyses of jet injectors.13,14 Understanding the degree and variability of jet injection delivery can provide significant insight into subject-specific control outcomes, as well as a means to evaluate new technologies with typical, traditional metabolic tests. Thus, for accurate assessment and glycemic management of an individual, delivery-specific loss must be considered, and accounted for where dose accuracy is a priority.
Conclusion
Modeling insulin loss in SC jet injection delivery has enabled quantification of loss on a per-subject basis and demonstrated its intra-subject variability. Identified losses are in accordance with clinical assessments of bioavailability of jet-injected insulin. For all subjects with loss greater than 5% of the nominal dose, the accuracy of insulin prediction improved when loss was included in the model. Quantification of jet injection loss and variability without novel measurement techniques will support further development of jet injectors and other promising insulin therapy technologies.
Footnotes
Appendix
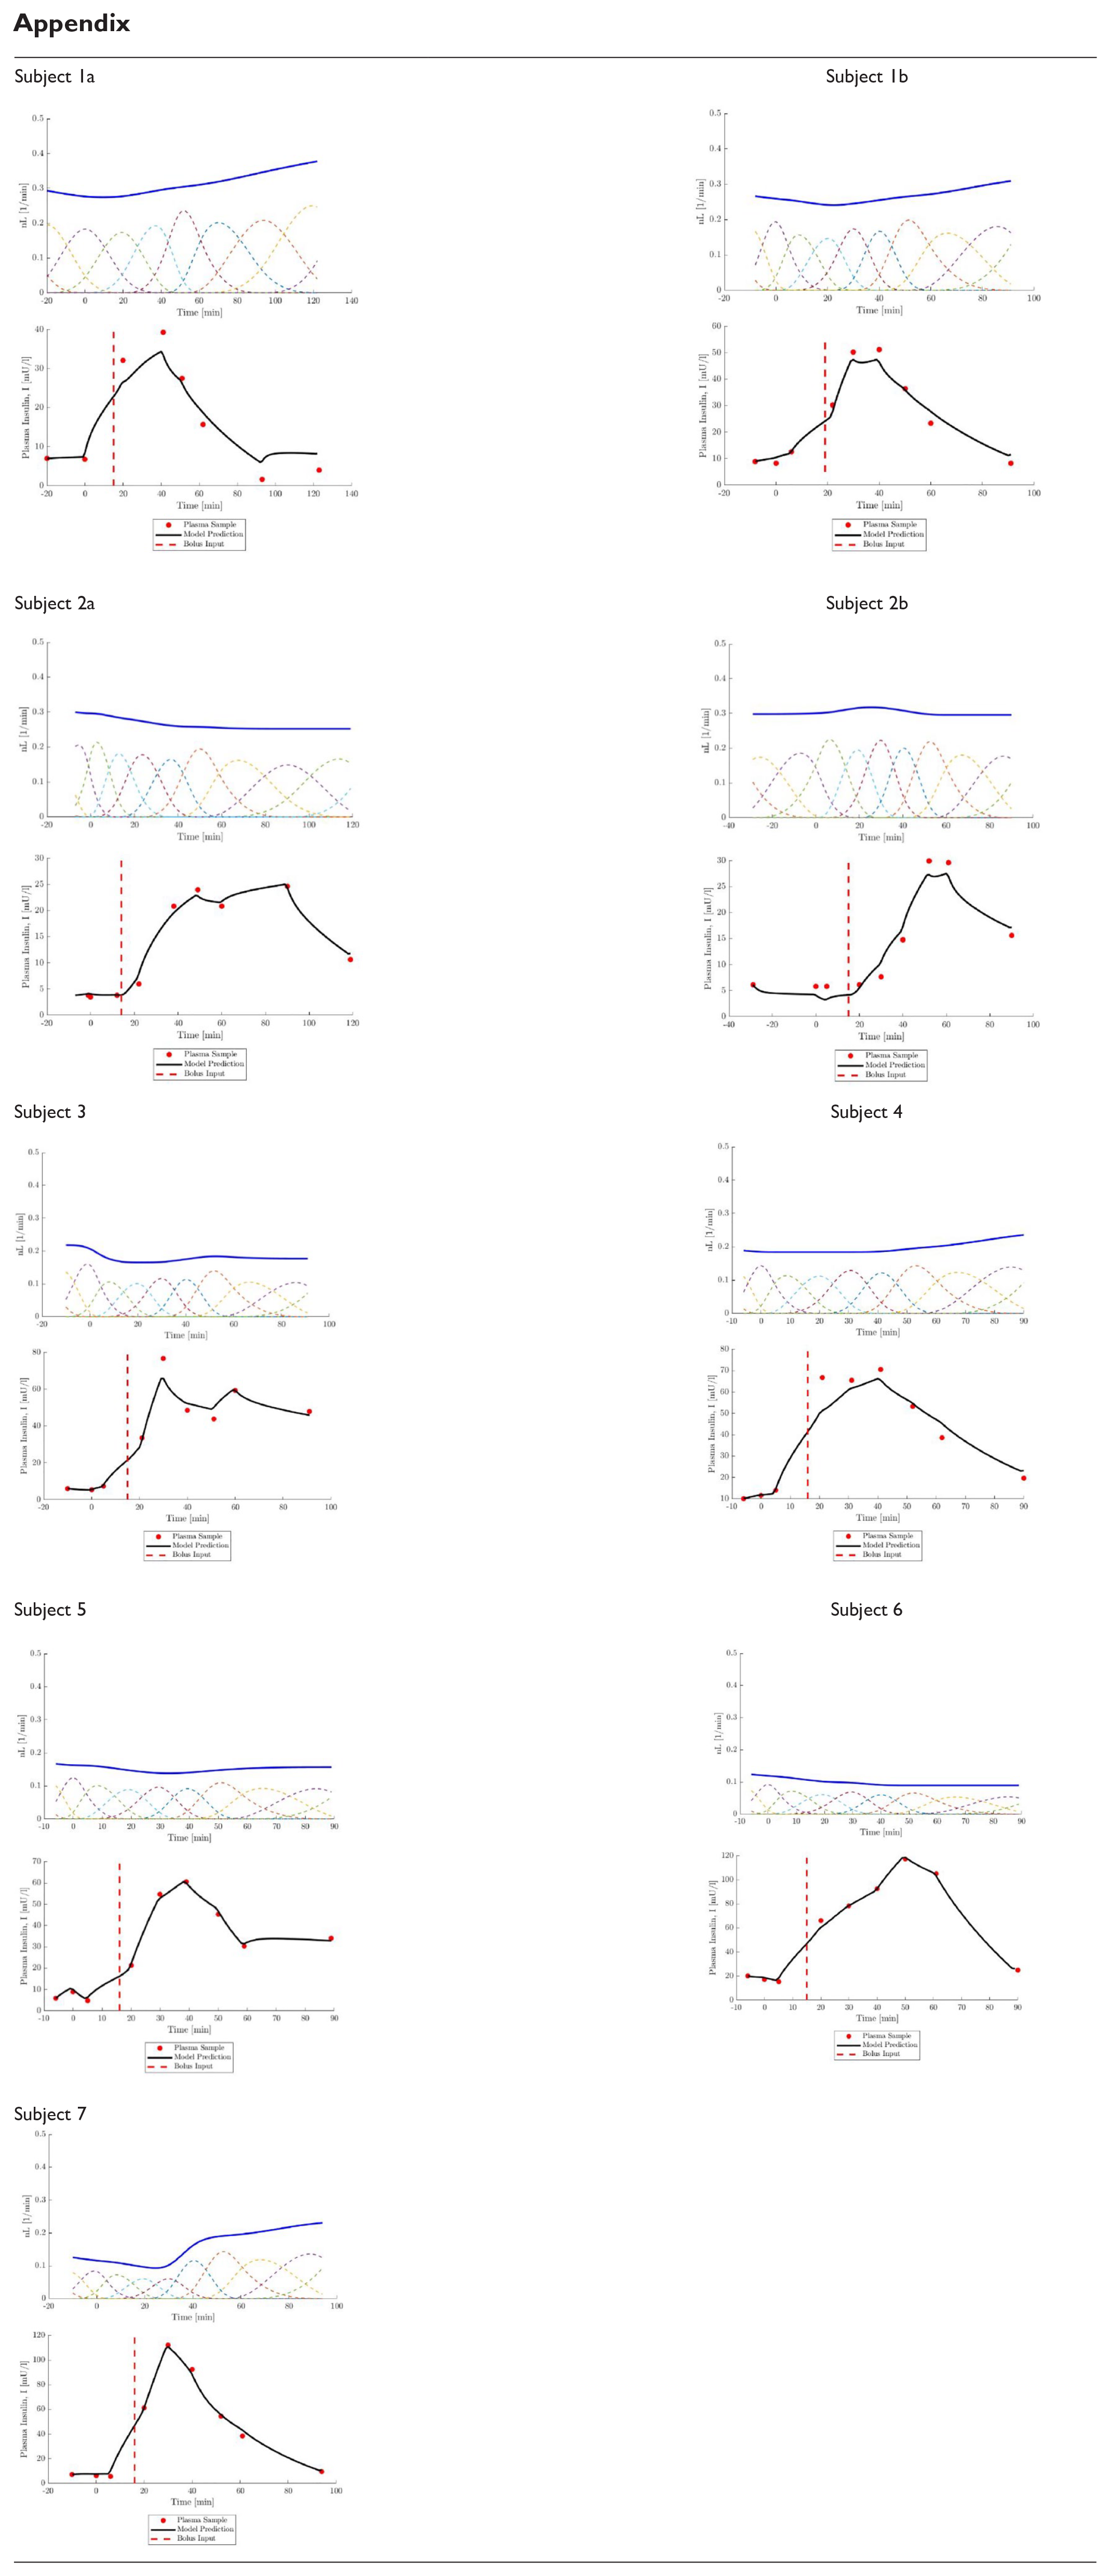
| Subject 1a |
Subject 1b |
| Subject 2a |
Subject 2b |
| Subject 3 |
Subject 4 |
| Subject 5 |
Subject 6 |
| Subject 7 |
Abbreviations
SC, subcutaneous; OGTT, oral glucose tolerance test; GC, glycemic control; BMI, body mass index; DISST, dynamic insulin sensitivity and secretion test.
Declaration of Conflicting Interests
The author(s) declared no potential conflicts of interest with respect to the research, authorship, and/or publication of this article.
Funding
The author(s) disclosed receipt of the following financial support for the research, authorship, and/or publication of this article: The authors are supported by New Zealand Science for Technological Innovation National Science Challenge [#CRS-53-2019] and MedTech Core [TEC #370571].