
Abstract
Objective:
Model-based metabolic tests require accurate identification of subject-specific parameters from measured assays. Insulin assays are used to identify insulin kinetics parameters, such as general and first-pass hepatic clearances. This study assesses the impact of intravenous insulin boluses on parameter identification precision.
Method:
Insulin and C-peptide data from two intravenous glucose tolerance test (IVGTT) trials of healthy adults (N = 10 × 2; denoted A and B), with (A) and without (B) insulin modification, were used to identify insulin kinetics parameters using a grid search. Monte Carlo analysis (N = 1000) quantifies variation in simulation error for insulin assay errors of 5%. A region of parameter values around the optimum was identified whose errors are within variation due to assay error. A smaller optimal region indicates more precise practical identifiability. Trial results were compared to assess identifiability and precision.
Results:
Trial B, without insulin modification, has optimal parameter regions 4.7 times larger on average than Trial A, with 1-U insulin bolus modification. Ranges of optimal parameter values between trials A and B increase from 0.04 to 0.12 min-1 for hepatic clearance and from 0.07 to 0.14 for first-pass clearance on average. Trial B’s optimal values frequently lie outside physiological ranges, further indicating lack of distinct identifiability.
Conclusions:
A small 1-U insulin bolus improves identification of hepatic clearance parameters by providing a smaller region of optimal parameter values. Adding an insulin bolus in metabolic tests can significantly improve identifiability and outcome test precision. Assay errors necessitate insulin modification in clinical tests to ensure identifiability and precision.
Keywords
Introduction
Validated mathematical models can be used to describe patient-specific insulin and nutrition kinetics, and outcome glycemic state.1-4 They also enable mathematical identification of patient-specific parameters from clinical data.5,6 Intravenous glucose tolerance tests (IVGTTs) use insulin assay data to determine insulin sensitivity and insulin kinetics. These tests are primarily used for assessing the diagnosis and progression of type 2 diabetes, which is characterized by impaired insulin sensitivity and impaired β-cell function.7-10 Metabolic tests additionally assess treatments such as diet,11,12 drug efficacy,13-15 and the dynamics of insulin resistance. 16
The precision of metabolic models and tests is important for accurate prediction of subject-specific parameters and subsequent outcome assessment.17,18 Derived metrics such as insulin sensitivity are used in care and incorporated in model-based glycemic control. 19 Thus, test precision is important in achieving desired safety and control outcomes as well as in accurately assessing new therapeutics or treatment approaches.
While structural identifiability of a model assesses theoretical ability to identify a parameter value,20,21 practical identifiability also considers the impact of noise and other factors in finding precise, specific values.5,22 A highly identifiable model enables mathematically distinct and precise determination of subject-specific parameters from discrete data. 5
Model complexity influences data requirements and identifiability. A complex model may describe additional physiological dynamics but may also require more frequent or invasive sampling. 2 Conversely, a simple model may have less intensive data requirements but fail to describe certain dynamics or encounter identification and prediction limitations due to having a more general representation of a system.4,23 Model-based approaches seek to provide the most precise outcome possible for the lowest clinical intensity.
Identification of subject-specific model parameters is significantly impacted by factors such as measurement frequency, timing, and assay error.5,23,24 However, the impact of insulin modification on the identifiability of glycemic model parameters has not yet been explicitly examined with clinical data. Insulin modification is not frequently applied in IVGTTs but potentially allows more dynamic information to be collected from a trial, improving parameter identification and thus accuracy of subject representation. Specifically, this study seeks to determine the impact of small intravenous insulin boluses on the identification of insulin kinetic parameters in clinical glycemic tests.
Methods
Data
Study data come from two IVGTTs: the insulin-modified Dynamic Insulin Sensitivity and Secretion Test (DISST) study 25 (Trial A) and a glucose tolerance study undertaken at the University of Auckland, Auckland, New Zealand (Trial B). Both trials received ethics approval from the New Zealand Health and Disability Ethics Committee (HDEC). Both trials collected plasma insulin, plasma glucose, and C-peptide assays over 30-40 minutes. Figure 1 shows test protocol and timing for both trials.
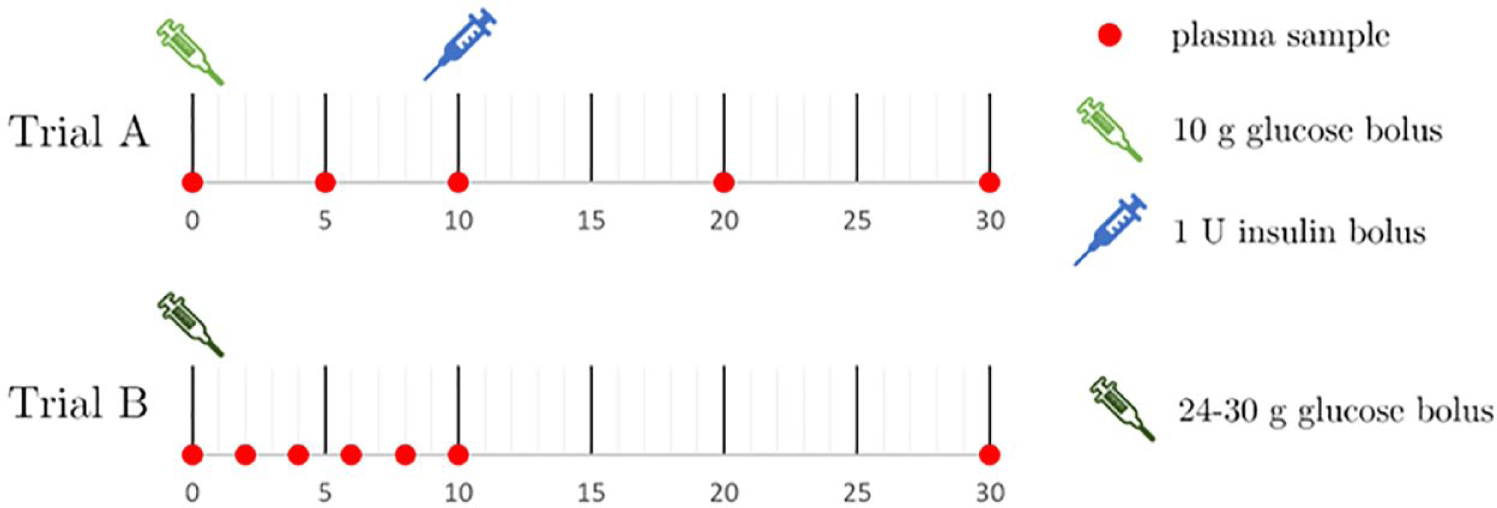
IVGTT protocol timing, including sampling and intervention timing (minutes). Plasma samples were assayed for glucose, insulin, and C-peptide. IVGTT: intravenous glucose tolerance test.
In Trial A, a 10-g glucose bolus is delivered intravenously to subjects at t = 0, followed by a 1-U intravenous insulin bolus delivered 12-13 minutes later. Trial A’s cohort consists of 50 healthy males and females. Glucose concentration was measured with the YSI 2300 STAT PLUS Glucose and L-Lactate analyzer (YSI Incorporated, Yellow Springs, OH, USA), and insulin and C-peptide concentrations with the Roche Elecsys Insulin assay (Roche Diagnostics, Basel, Switzerland).
Trial B’s protocol includes a glucose bolus delivery of 0.3 g per kilogram of body mass up to a maximum of 30 g, with no insulin modification. Trial B’s cohort consists of 43 healthy adult males. Glucose concentration was measured with the HemoCue Glucose 201+ System analyzer (HemoCue AB, Ängelholm, Sweden) and insulin and C-peptide concentrations with the Roche Elecsys Insulin assay (Roche Diagnostics, Basel, Switzerland).
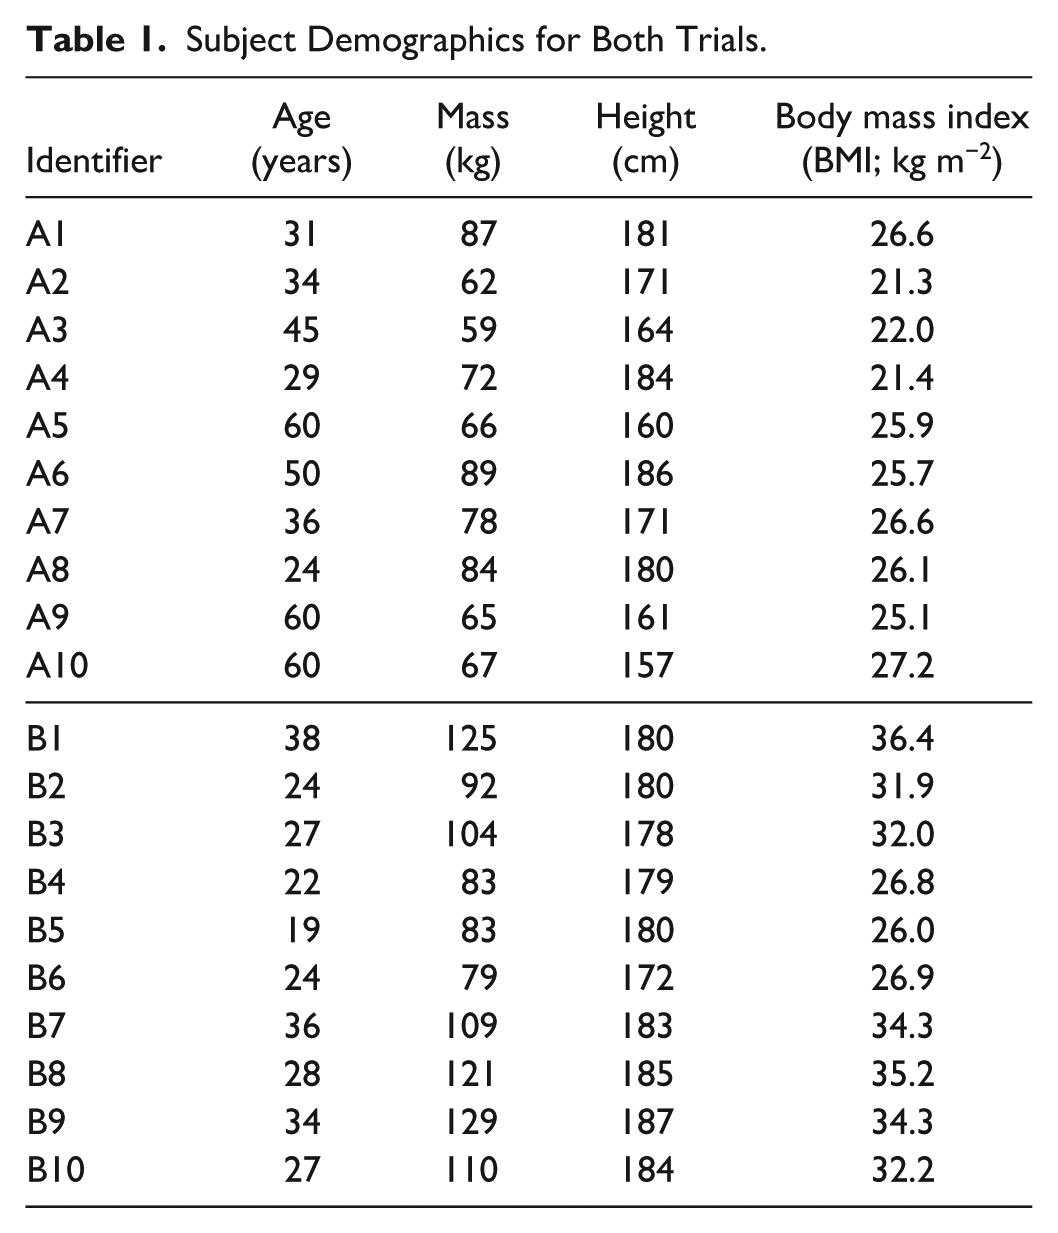
N = 10 subjects were randomly selected for analysis from each trial. Table 1 shows subject demographics for selected cohorts from both trials.
Subject Demographics for Both Trials.
Model
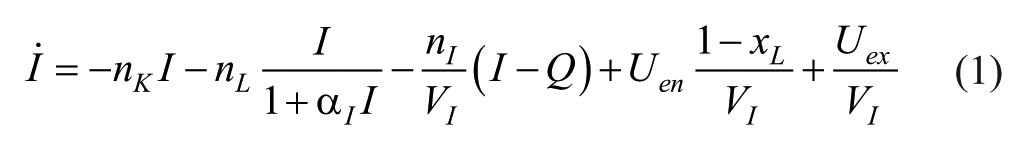
A clinically well-validated three-compartment model1,26,27 describes subject metabolic dynamics over time to enable identification of subject-specific parameters. Compartments include plasma glucose, G [mg/dl]; plasma insulin, I [mU/l]; and interstitial insulin, Q [mU/l]. Plasma insulin concentration is the compartment of interest for identifying insulin kinetics from insulin assay data and is defined: 1
The interstitial insulin compartment is defined:
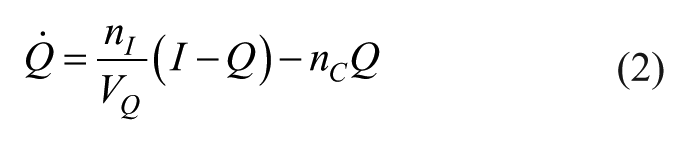
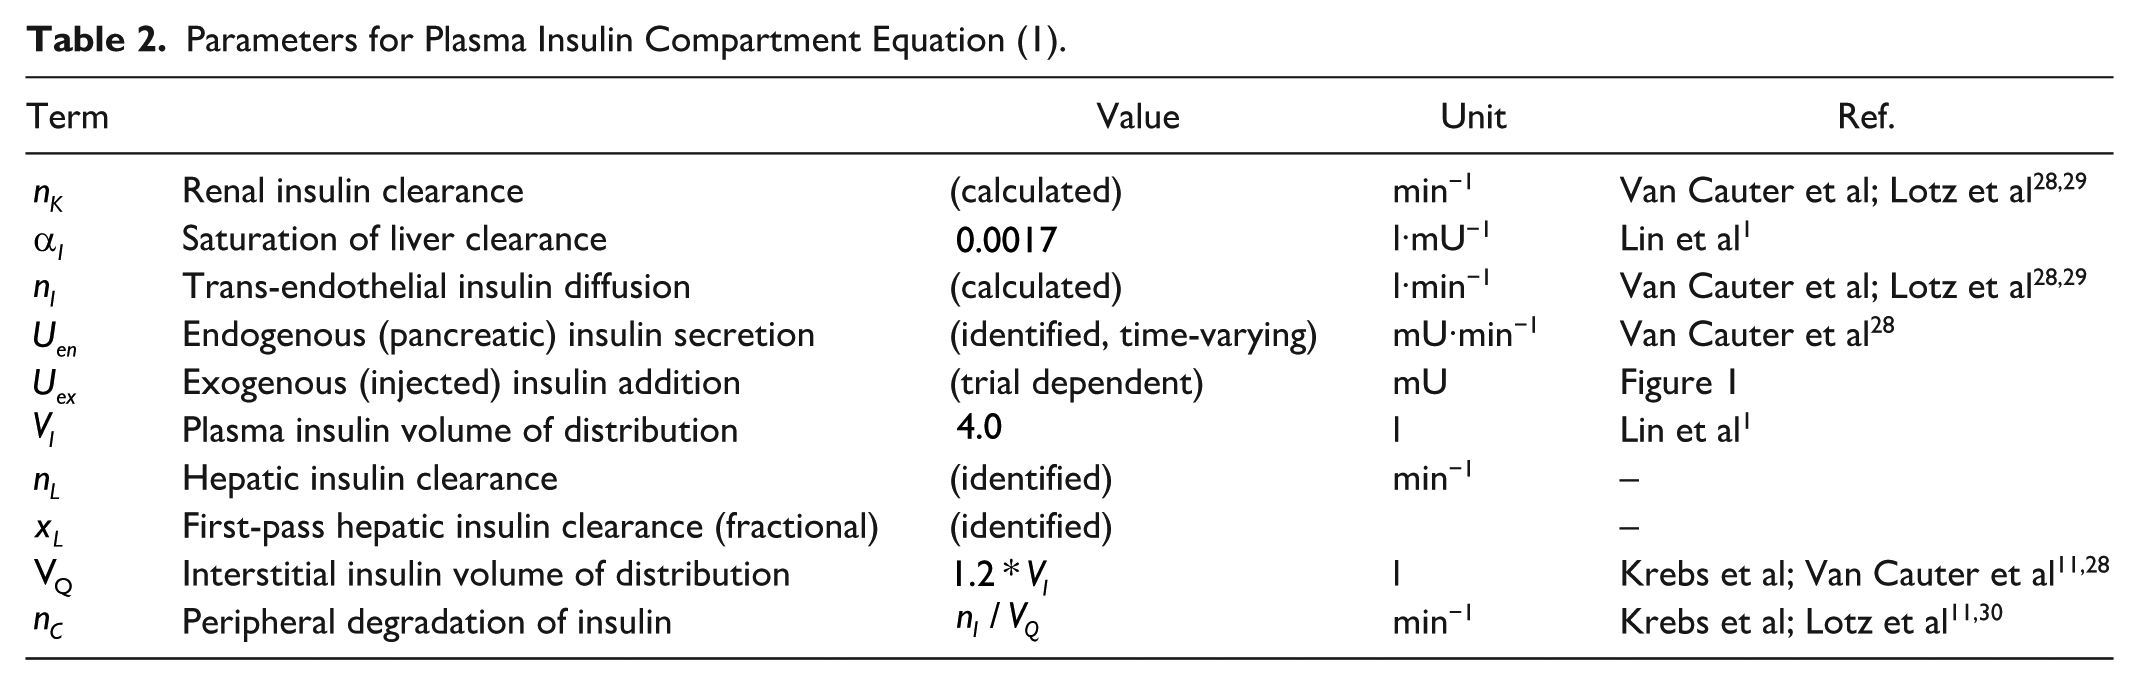
Table 2 describes the parameters in Equations (1) and (2), where the well-accepted van Cauter model
28
is used to determine
Parameters for Plasma Insulin Compartment Equation (1).
Identification
Equation (1) is used to simulate each subject’s plasma insulin appearance, I. C-peptide assays are used to estimate endogenous insulin secretion,
A grid search over a range of parameter values yields an error surface and identifies optimal clearance values for each subject. Values of
For each
Highly identifiable cases produce error surfaces with a distinct local optimum in a physiological range of parameter values.5,6,34,35 Poorly identifiable cases have a larger region of parameter pairs whose simulation errors are close or equal to the optimum. To assess the uniqueness of an identified optimum, all parameter pairs around the optimum are located whose model errors are within the variance expected from 5% assay error.36,37
To assess parameter equivalence due to assay error, a Monte Carlo analysis (N = 1000) is performed for each subject to determine how 5% assay error36,37 influences model error. For each Monte Carlo trial, each insulin assay sample is multiplied by a normally distributed random variable with a mean of 1 and a standard deviation of 5%, thus adding variability equivalent to assay error. Additionally, insulin simulations are generated for each
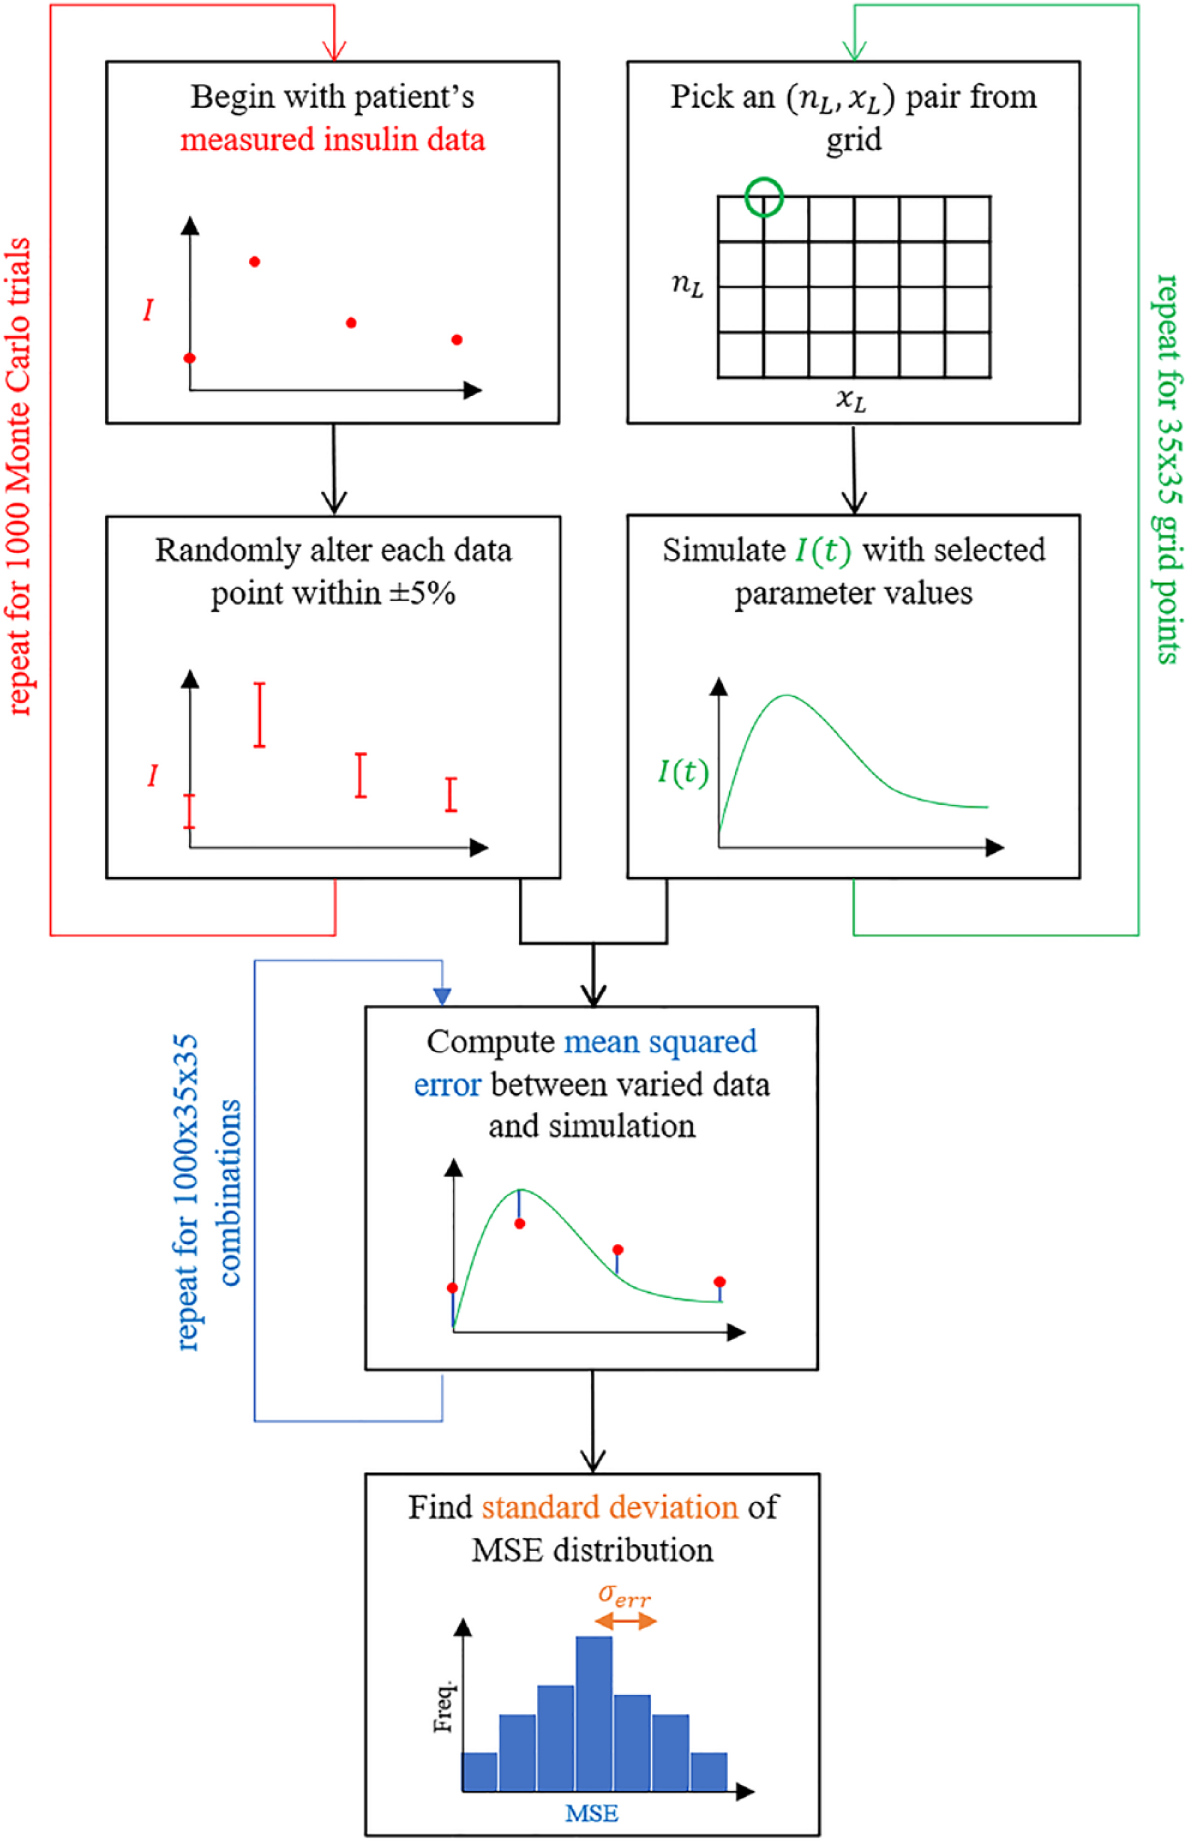
Flowchart illustrating the Monte Carlo process used to determine
A subject’s identifiable optimal parameter region is thus defined as the set of all
Analyses
The optimal parameter regions for Trial A and Trial B subjects are compared to assess the impact of differences in trial design in the use of insulin modification. These differences quantify the identifiability of the insulin pharmacokinetic parameter values. The resulting errors can further impact the resulting identification of insulin sensitivity and other clinical diagnostic parameters. Insulin kinetic parameters
Results
Figure 3 shows typical examples of model-identified and simulated insulin profiles for Trials A and B at the optimal parameter values. With no exogenous insulin bolus (Trial B), insulin profiles are relatively flatter with only pancreatic secretion. The addition of a relatively small 1 U insulin bolus yields a more dynamic insulin response.
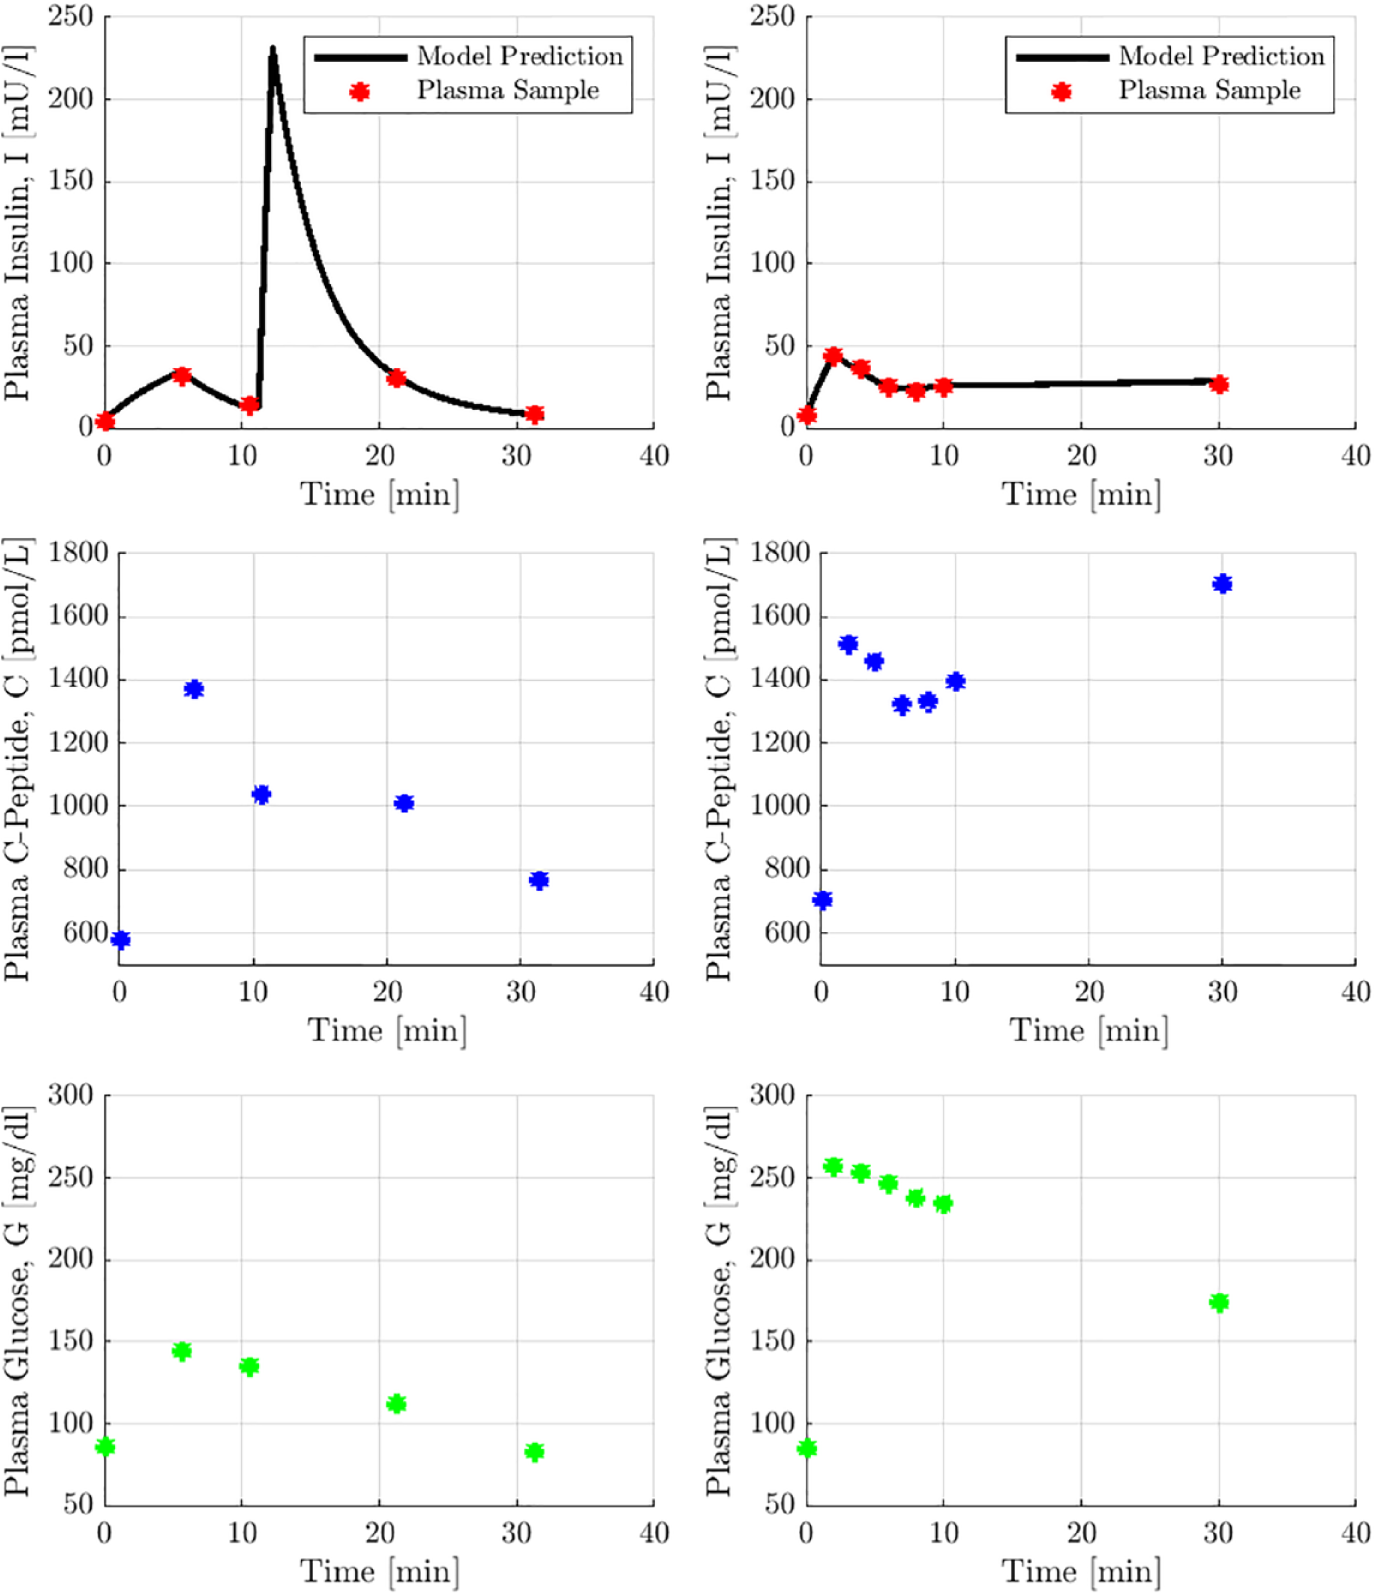
Sample of optimal insulin simulations from both trials, with corresponding glucose and C-peptide data. Subject A1 (left) displays a dynamic insulin response to exogenous insulin. Subject B2 (right) displays a relatively flat endogenous insulin profile.
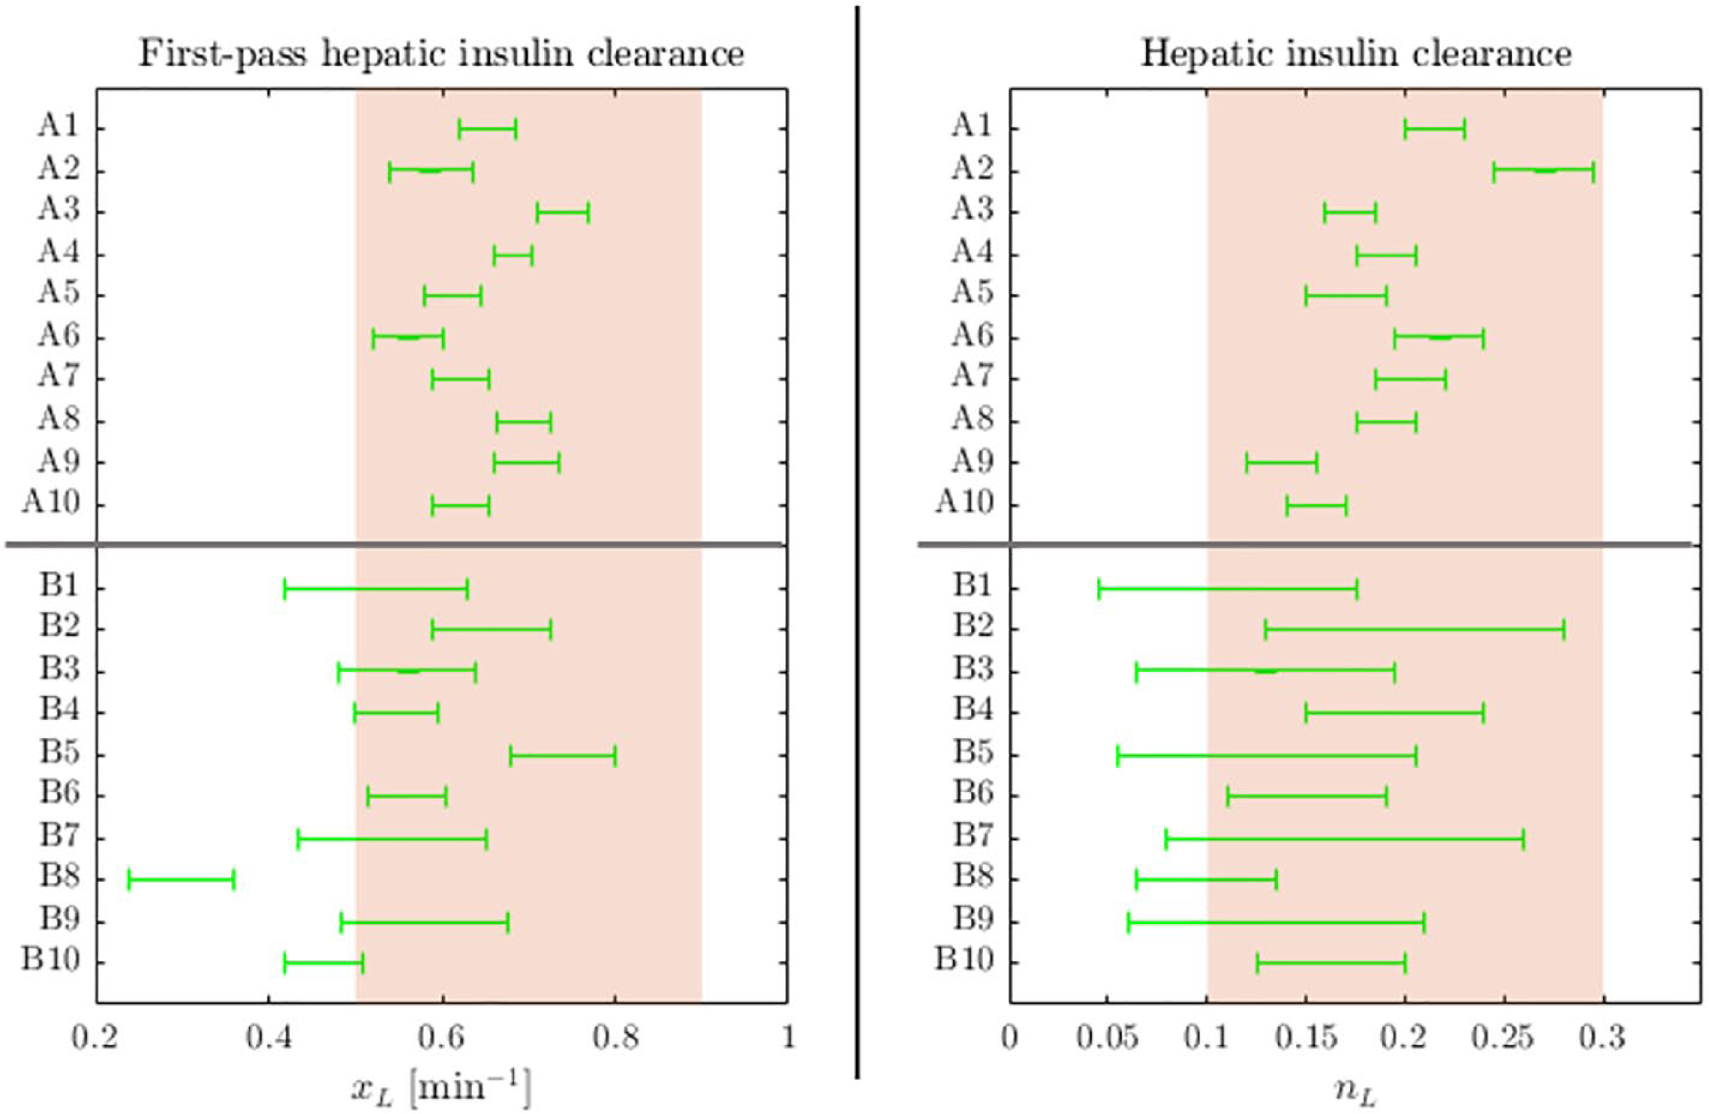
Error surfaces for each subject are shown in Figure 4, where subject-specific optimal parameter regions are displayed in green. The optimal ranges of either parameter for each subject are additionally illustrated in Figure 5. The relative sizes of optimal parameter regions and accuracy of optimal insulin fits are provided in Table 3.
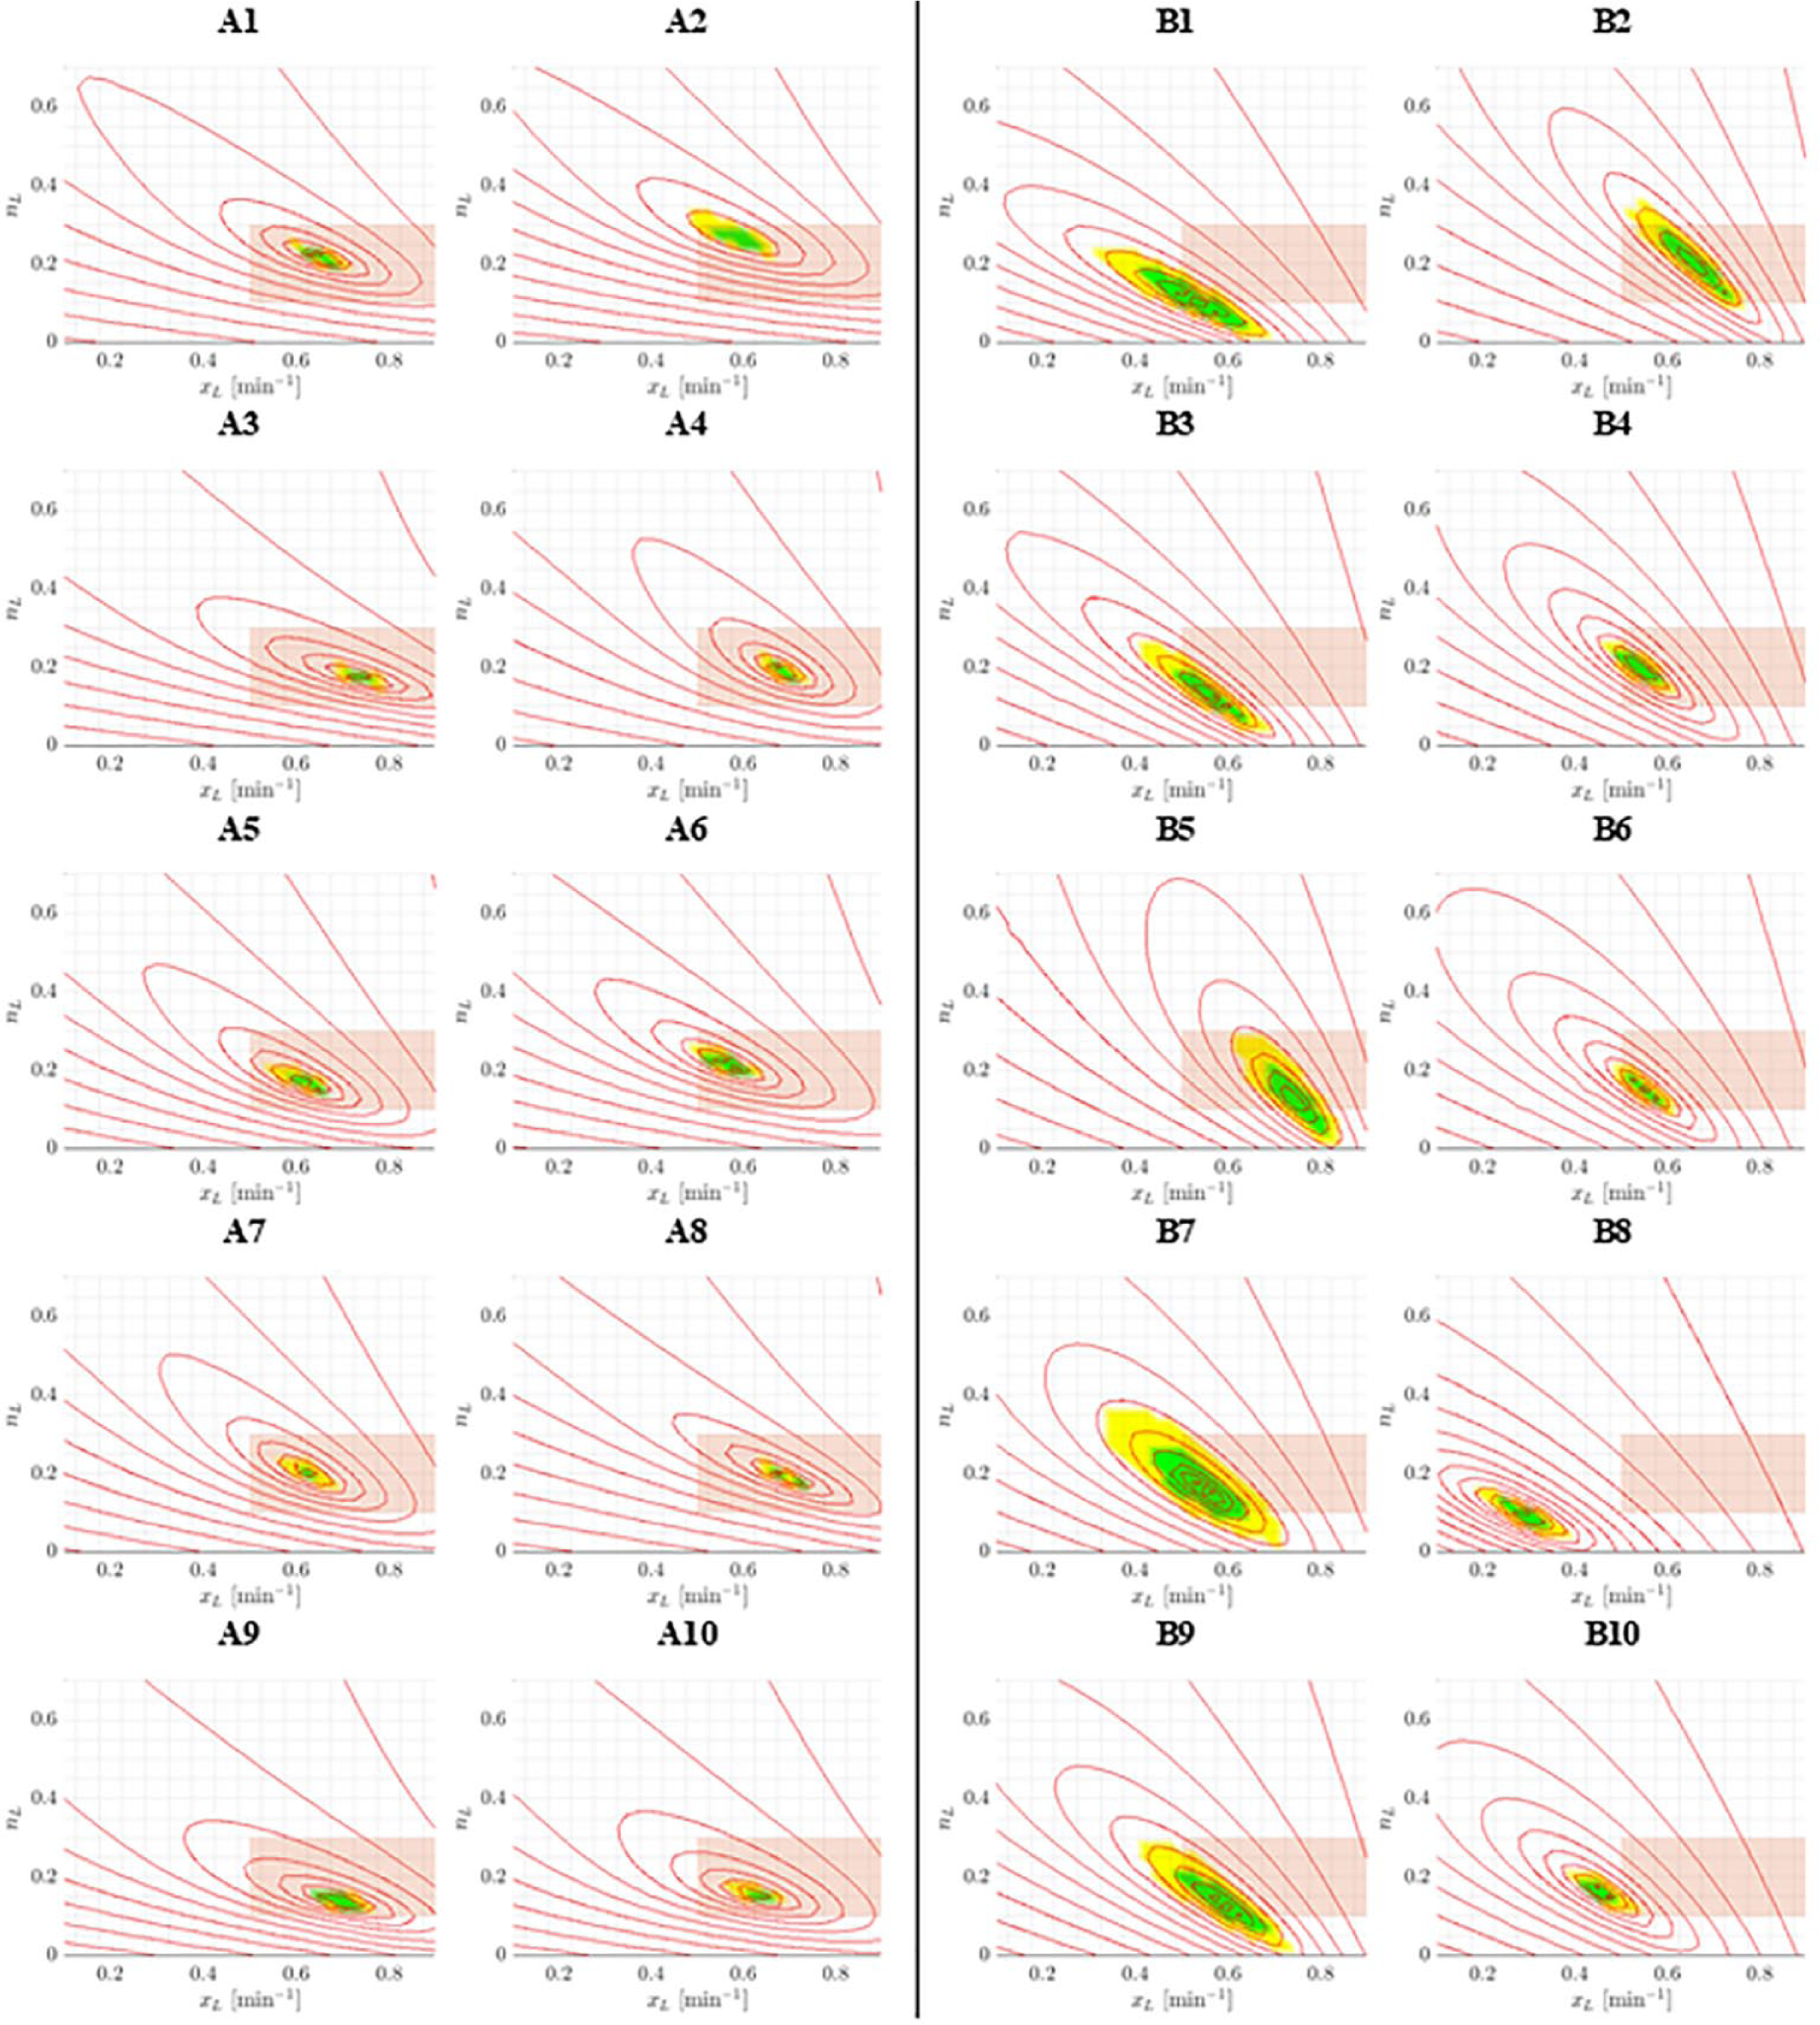
Error surfaces for each subject in Trials A and B. Each optimal parameter region (green) contains errors within
Optimal Parameter Regions Sizes and Mean Absolute Percentage Error of Optimal Insulin Fit for Each Subject.
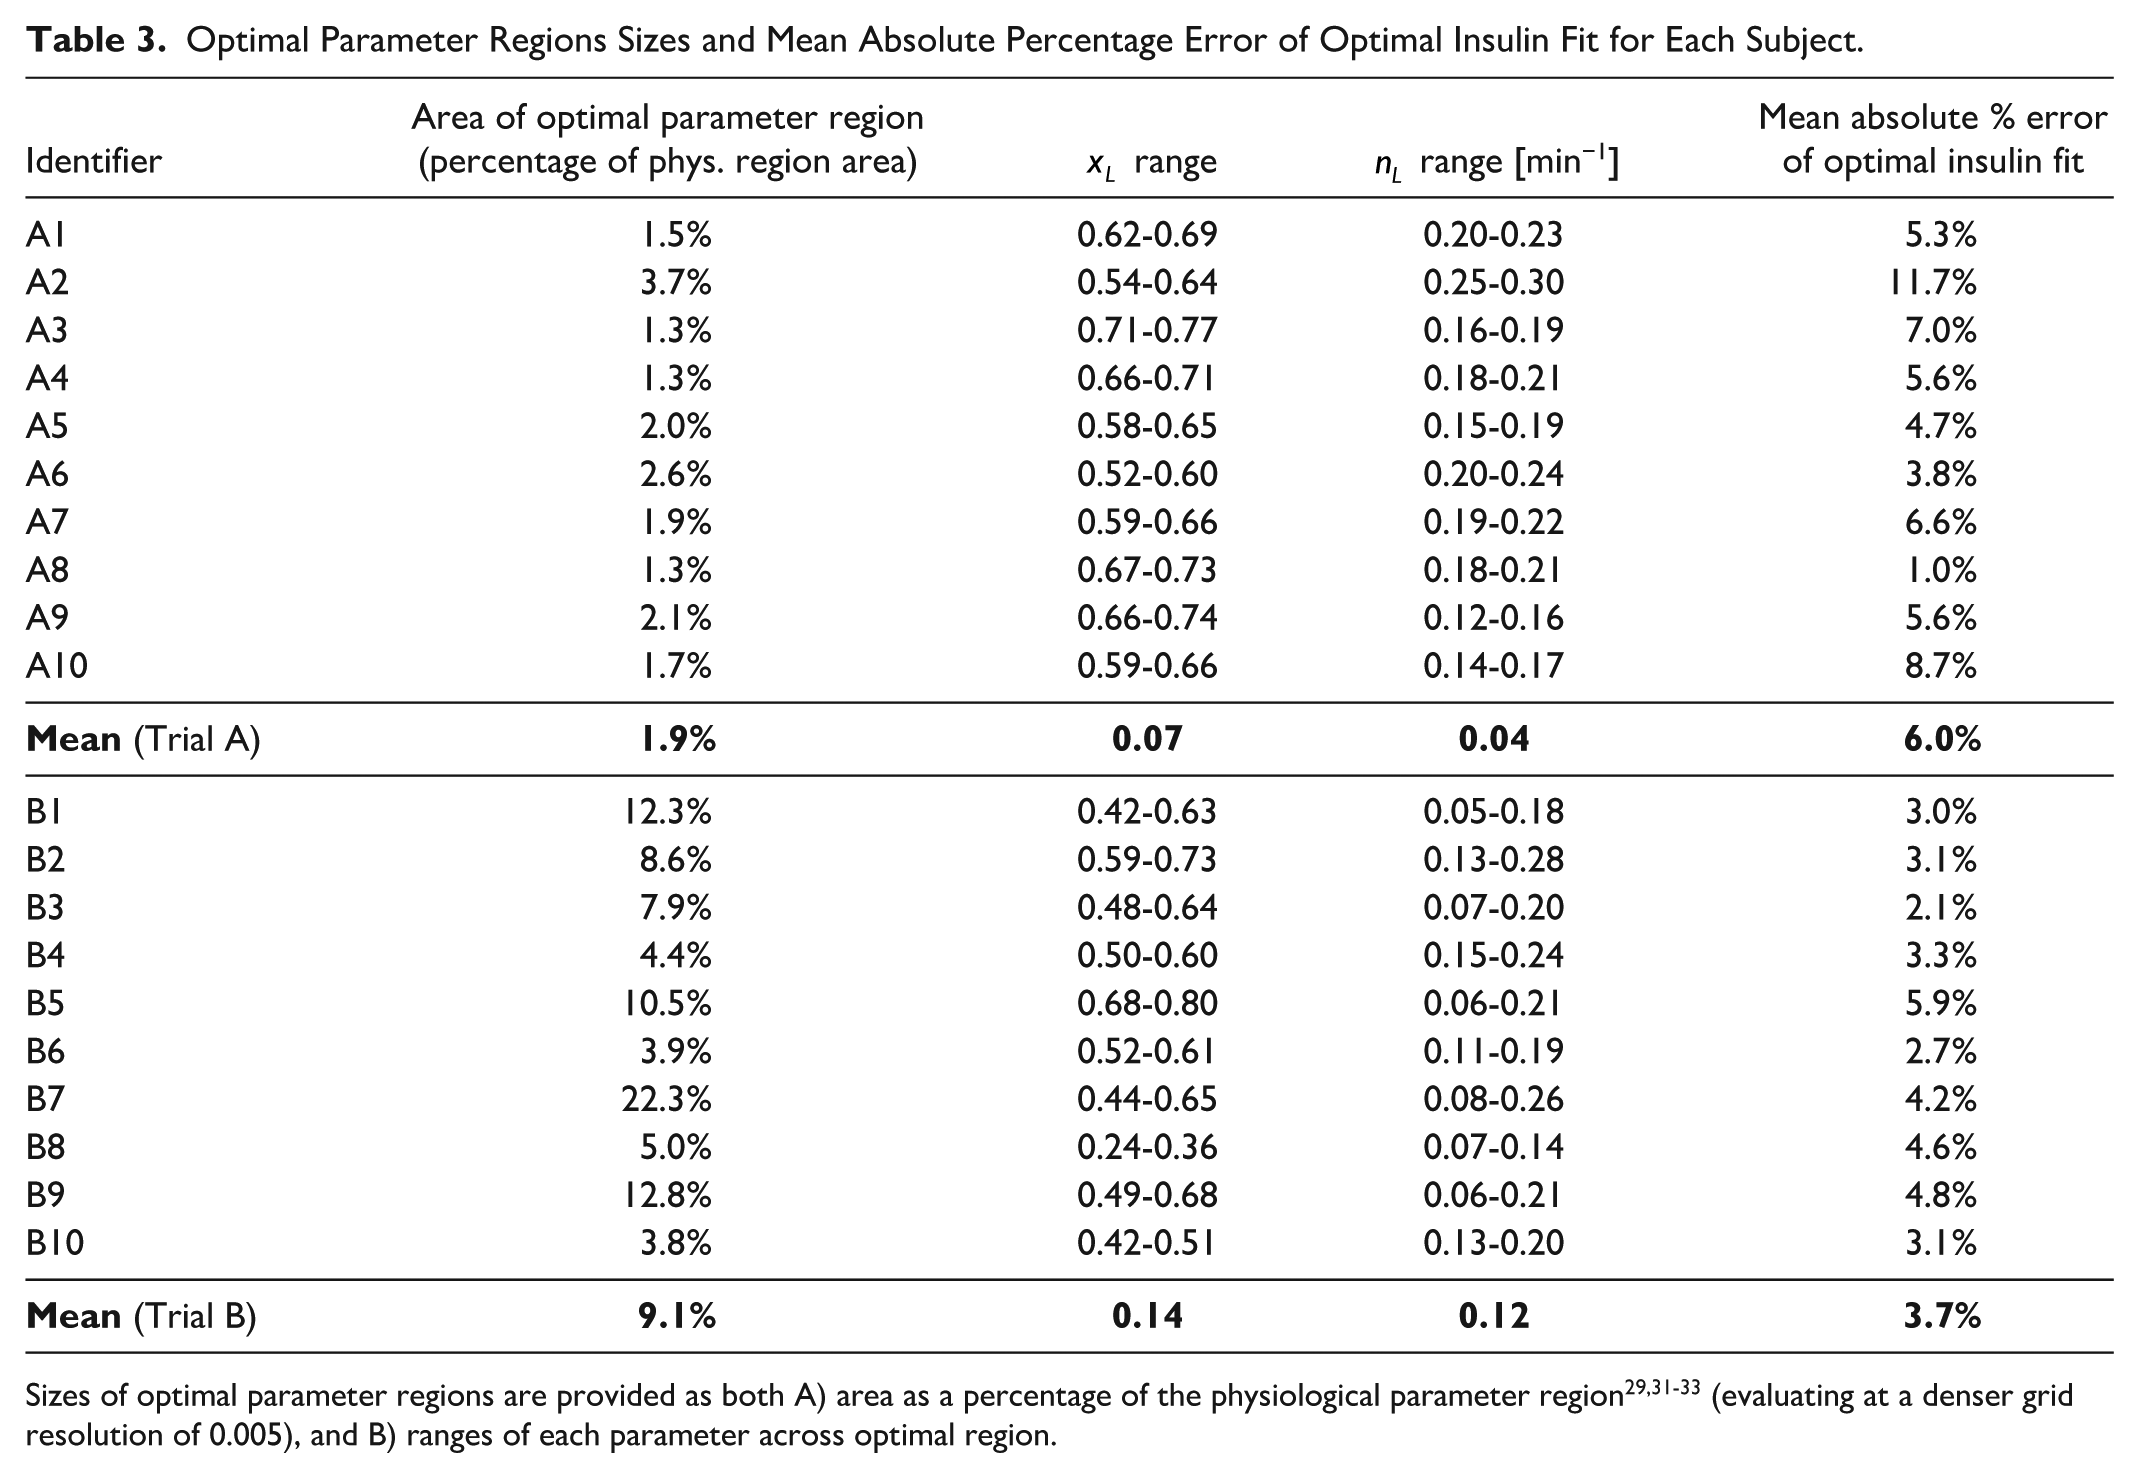
Sizes of optimal parameter regions are provided as both A) area as a percentage of the physiological parameter region29,31-33 (evaluating at a denser grid resolution of 0.005), and B) ranges of each parameter across optimal region.
In Figures 3 and 4 and Table 3, Trial A has smaller regions more concentrated in physiologically accepted ranges. The optimal parameter ranges for both parameters from Trial A were significantly smaller than the those from Trial B (Wilcoxon rank-sum/Mann-Whitney U test P value < .001). These results suggest insulin modification provides a tighter range of physiologically acceptable identified parameter values and is thus a more identifiable case.
Discussion
Outcomes
A significant parameter trade-off between
Trials A and B vary in the size of the glucose bolus delivered. Trial B includes a glucose bolus up to three times greater than Trial A. Subjects in Trial B thus have a stronger pancreatic trigger for insulin secretion, and a stronger endogenous insulin response could be expected. However, improved identification is observed in Trial A, despite the weaker endogenous insulin response. Improved identification is thus caused by the addition of exogenous insulin changing the insulin profile, and the magnitude of the insulin profile is not a factor. Overall, this suggests that the exogenous insulin bolus aids differentiation of general and first-pass hepatic clearance during parameter identification, where endogenously secreted insulin is influenced by both, and exogenous insulin does not undergo a first-pass hepatic cut.
These results suggest exogenous insulin boluses should be included in glycemic test protocol design if precision of modelled kinetics is a priority. The addition of even a single unit of insulin provides dynamic information which improves identification of insulin kinetics parameters. However, there is a small risk of hypoglycemia despite the small bolus size in Trial A. 38 While 1 U is a relatively small dose, subject-specific insulin sensitivity and resulting susceptibility to hypoglycemia should be assessed. Equally, the original DISST study included lean subjects with high insulin sensitivity and any hypoglycemia was light (blood glucose concentration > 54 mg/dl), posing minimal risk. 25 The DISST pilot study saw measurable insulin dynamics with 0.5 U boluses. 30
Limitations
Simulation error may be caused by model dynamics not accurately fitting observed dynamics in these patients. However, the model is very well-validated in clinical use in ICU,1,19,39,40 in insulin sensitivity testing25,31,41 and in assessing insulin kinetics, 40 including as virtual patients.18,26 The clinical validity of the model provides certainty as to its representation of clearance dynamics.
The findings of this study are limited by the amount of data available and a limited set of subjects. While differences between Trials A and B may be due to selection error, other larger analyses show similar identifiability issues in insulin kinetic models.23,42-46 The consistency of identifiability results, even with a very small insulin bolus, strongly suggests the insulin modification and its change in the observed dynamics causes the improvement in identification, matching prior analyses. 5 However, differences between cohorts in age, ethnicity, sex, and BMI should be noted, and further research should repeat this study with one consistent cohort. While the limited number of subjects per trial could be seen as a limitation of these results, Figures 3–4 and Table 3 show the differences in identifiability are consistent and clear. Equally, the addition of further subjects to from these and other trials would not contribute further information to this analysis. Thus, the number of subjects is large enough to demonstrate the identifiability issue and its consistency across all subjects between trials.
The two cohorts can differ in body weight and BMI, which can affect some kinetics parameters, such as volume of distribution. This model has been very well validated with constant volume parameters.25,30 Furthermore, the identification of the hepatic clearance parameters is dependent on the shape, not the value, of the insulin curve. The effect of changing volume parameters with weight would be to translate the insulin curve up and down without altering the dynamics captured by the
There are timing differences in the Trial A and B protocols (Figure 1). Trial B has more measurements around the peak of the endogenous response, which should more completely capture the peak and improve identification. However, this improvement is not observed in the results, and improved identification is achieved in Trial A despite the less frequently sampled protocol. This outcome matches results in work by Docherty et al 5 on the timing of measurements and identifiability, and thus this difference does not impact the results presented here, as Trial B has a superset of the measurements of Trial A.
Analyzing separate trial cohorts introduces potential error due to inter-trial subject variability. Subjects with a strong first-phase endogenous insulin response likely have inherently more identifiable kinetics than those with weaker first-phase response due to stronger clearance dynamics being evident in the sampled insulin assay data. However, the significant improvement in identification in Trial A outweighs this smaller individual variation. Subjects with strong first phase insulin responses are also not typically the targets of diabetes research and diagnostic metabolic tests. Thus, the consistent results over 20 subjects suggest a benefit from the small added insulin bolus regardless of variability in first-phase response.
The model has several fixed parameters and limited samples, both of which may limit the robustness of identified values. However, the model has been proven to accurately describe dynamics to the limit the model defines them in both clinical use for glycemic control25,41,47,48 and has demonstrated excellent accuracy in identifying insulin sensitivity and other metabolic characteristics. Regarding sampling rates, extra assays with a dense sampling grid are shown to not always improve identification, 5 where this work by Docherty et al showed subjecting a subject to extra samples may be unnecessary as sparser sampling is sufficient for robust identification. Thus, the sampling protocols employed here should be appropriate for this analysis using this model, based on our prior experiences.5,29,41
Implications
While the model used in this study is well-validated in clinical use and research, its predictions and outcomes are only as accurate as the data analyzed. Determining subject-specific clearance responses requires data that display the response dynamics described by the model. If these response dynamics are not strongly observable in the data, the relevant parameters cannot be expected to be accurately identified. The addition of an insulin bolus clarifies differing dynamics of general and first-pass hepatic insulin clearances, thus improving identification of both these rate parameters and subsequent model parameters such as insulin sensitivity.
Overall, improved parameter identification aids outcome test precision by providing a more physiologically accurate model. Accurate determination of subject-specific parameter values within a physiological range improves reliability of model predictions in clinical use to guide care.17,44,49,50 In insulin sensitivity and metabolic testing, improved precision carries over to the insulin sensitivity metric and removes a source of variability in the error, as seen here in the wide range of
Conclusion
Comparison of two intravenous glucose tolerance tests has demonstrated the addition of a 1 U insulin bolus improves identification of general and first-pass hepatic clearance parameter values. Addition of this bolus reduced the region of optimal parameter values by a factor of 4.7 and provided more physiologically acceptable parameter values. Insulin modification is not commonly employed in IVGTTs, but even small insulin additions are shown to improve outcome test precision at minimal additional clinical cost and risk. Thus, future protocol design for model-based tests should consider adding an exogenous insulin bolus for these modelling benefits, especially where accuracy of glucose-insulin kinetics is a priority.
Footnotes
Abbreviations
BMI, body mass index; DISST, Dynamic Insulin Sensitivity and Secretion Test; IVGTT, intravenous glucose tolerance test.
Funding
The author(s) disclosed receipt of the following financial support for the research, authorship, and/or publication of this article: The authors disclosed receipt of the following financial support for the research, authorship, and/or publication of this article: The authors are supported by New Zealand Science for Technological Innovation National Science Challenge [#CRS-53-2019] and MedTech Core [TEC #370571].
Funders of clinical trial A: Health Research Council of New Zealand (HRC).
Funders of clinical trial B: The Auckland Medical Research Foundation (AMRF), the Health Research Council of New Zealand (HRC) and the Maurice Wilkins Centre (MWC). TLM is supported by a Rutherford Discovery Fellowship.
Declaration of Conflicting Interests
The author(s) declared no potential conflicts of interest with respect to the research, authorship, and/or publication of this article.