
Abstract
Background:
Personal insulin pumps have shown to be effective in improving the quality of therapy for people with type 1 diabetes (T1D). However, the safety of this technology is limited by the possible infusion site failures, which are linked with hyperglycemia and ketoacidosis. Thanks to the large availability of collected data provided by modern therapeutic technologies, machine learning algorithms have the potential to provide new way to identify failures early and avert adverse events.
Methods:
A clinical dataset (N = 20) is used to evaluate a novel method for detecting real-time infusion site failures using unsupervised anomaly detection algorithms, previously proposed and developed on in-silico data. An adapted feature engineering procedure is introduced to make the method able to operate in the absence of a closed-loop (CL) system and meal announcements.
Results:
In the optimal configuration, we obtained a performance of 0.75 Sensitivity (15 out of 20 total failures detected) and 0.08 FP/day, outperforming previously proposed literature algorithms. The algorithm was able to anticipate the replacement of the malfunctioning infusion sets by ~2 h on average.
Conclusions:
On the considered dataset, the proposed algorithm showed the potential to improve the safety of patients treated with sensor-augmented pump systems.
Introduction
Personal continuous subcutaneous insulin infusion pumps (CSII)1-4 deliver insulin into the subcutaneous tissue through an intradermal catheter, allowing a more physiological delivery of insulin than multiple daily injections. 4 The efficacy of CSII pumps can be further enhanced by integrating them with a continuous glucose monitor (CGM) sensor. This sensor-augmented therapy is associated with improvement of glycemic control and reductions in HbA1c levels.5,6 Recently developed closed-loop (CL) insulin delivery systems, such as the Artificial Pancreas, use a control algorithm to automate insulin delivery based on the glycemic requirements as measured by the CGM and achieve further improvement in glucose control.
A problem of interest for insulin pump therapy is the possibility of observing adverse events related to mechanical failure of pump parts, infusion sets, or insertion site problems. Infusion set failures represent the more clinically relevant source of hazard for artificial pancreas users. These events, consisting of pump occlusions (partial or complete), or set dislodgement, cause interruption of insulin delivery to varying degrees including a complete stop. 4 When unrecognized, the reduced or missed delivery of insulin typically lead to hyperglycemia and ketonemia.7,8 It is also observed that problems with infusion sets is one of the main factors that contribute to diabetic ketoacidosis.9-12 Automated methods for detecting infusion site failures aim to warn the pump user to reduce hyperglycemia and related complications.
Infusion Site Failures Detection: State of Art
The problem of automatically detecting ISF was extensively investigated using model-based fault detection.13-17 This method requires to identify a mathematical model of the patient’s physiology, which is used to perform a prediction of current glycemia and compare it with CGM measurements, with the aim being of detecting large differences that are associated with faults. The identification of an accurate model of T1D physiology is non-trivial due to the large inter- and intra-subject variability, which makes the use of fixed, average or population models without customization on the subject and periodic updates hardly viable. 18 In fact, as of now, none of the model-based approaches have been tested on real data.
Other approaches have addressed the problem using model-free techniques and were validated using clinical data. These methods do not require identification of a patient model but are based only on observation of historical data. Cescon et al 19 proposed a three-step procedure algorithm designed for anticipating rather than detecting insulin pump failures. CGM trend and the amount of injected insulin over a time window was used to identify possible infusion site failures. Howsmon et al20,21 also proposed a method based on the monitoring of glucose trends and insulin requirements over a time windows. Recent values (average over last 1 h) are compared with baseline values (average over last 24 h) and alarms occur when thresholds are exceeded.
Recently, in Meneghetti et al22,23 we proposed a new solution for the detection of infusion site failures. The methodology relies on unsupervised anomaly detection algorithms, a field of machine learning that is used to detect anomalies (e.g., frauds or faults) in large datasets without the need of training data. 24 Unlike model-based approaches, this solution does not require to identify a physiological model of the patient. Nevertheless, the method is personalized: the decision is performed based on the historical data collected during the personal use of CGM and insulin pump thus it is patient specific.
So far, the methodology was designed to be applied on CL systems and developed and extensively tested on in-silico data.22,23 Such data are particularly appropriate for the development of fault detection algorithms since faults can be simulated in perfectly known positions, obtaining an accurate ground truth without posing any real person at danger. A concept validation test was performed in Meneghetti et al 22 using data from a clinical study carried out to test the use of a CL system in home setting. 25 However, in this study, patients were encouraged to frequently replace the infusion set to decrease the likelihood of occlusions 26 therefore, a low occurrence of infusion site failures was observed.
In this work, we test our proposed methodology using real data collected from a clinical study 7 in which patients were asked to wear an infusion set over the recommended period, increasing the occurrence of infusion site failures. Additionally, unlike the dataset used in Meneghetti et al 22 people involved in this study did not use a CL system. Therefore, in this work, we adapt our method by modifying the feature engineering procedure, to be able to detect infusion site failures in the case where we cannot observe a crucial information, that is, the controller action on the commanded insulin when attempting to counteract hyperglycemia excursions. Finally, the adaptation proposed does not rely on rigorous meal announcements provided by the pump user, which improves the reliability of our method.
Methods
Dataset
The dataset used in this paper is obtained from a unique study performed in 2013 investigating the effect of infusing insulin in lipohypertrophic sites. 7 The secondary outcome of the study was to develop and apply real-time algorithms to detect infusion site failures.
For this purpose, N = 23 people with type 1 diabetes (T1D) were recruited at two clinical sites. All subjects used Silhouette or Comfort infusion sets and they wore two Dexcom G4P® CGM sensors. Study participants returned to the clinic every week for 4 wk for a clinical examination and wore an infusion set in ambulatory conditions for the subsequent 7 d.
At each visit, infusion sites were inspected, and new infusion sites were initiated.
During the ambulatory use, subjects were requested to replace their infusion sets in the event of one of the three following conditions:
(1) Blood glucose (assessed on the glucose meter) does not decrease by at least 50 mg/dL within 1 h of a correction bolus to treat a blood glucose greater than 250 mg/dL;
(2) Presence of serum ketones >0.6 mg/dL with a glucose >250 mg/dL (in the absence of illness);
(3) Signs of infection at the infusion site (erythema or induration >1 cm in diameter).
Patients were asked to record when the infusion sets were removed and to document the reason for the removal of the sets. If a failure had occurred before day 7, subjects were instructed to replace the infusion set at home to ensure insulin delivery until the new set provided by the investigators on day 7 was inserted.
Every infusion set replacement was then analyzed by the clinicians. A spreadsheet was produced, in which every infusion set replacement was given a label according to the set failure criteria: (A) ketones >0.6 or failed correction; (B) failed correction by sensors; (C) high glucose over hours; (D) indeterminant; (E) no failure. In our data set, we have only considered as faults infusion set replacements that have been labeled by the study team as (A), (B) or (C).
Figure 1 reports the number of infusion site failures episodes per patient. In total, 20 fault episodes were recorded. Out of the 20 total patients, 10 did not have pump fault episodes, three patients had one fault episode, four patients had two fault episodes, three patients had three fault episodes. Figure 2 reports the statistics of the fault criteria labels. Out of the 21 fault episodes, six were labeled as “A”, six were labeled as “B”, and eight were labeled as “C”.
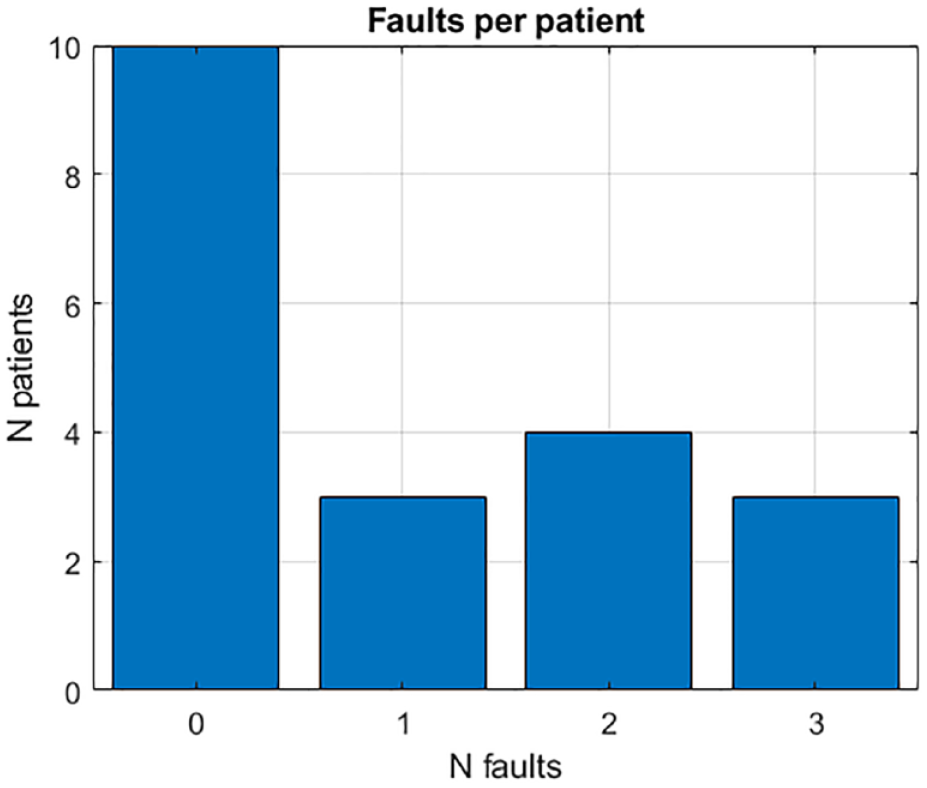
Distribution of failures per patient.
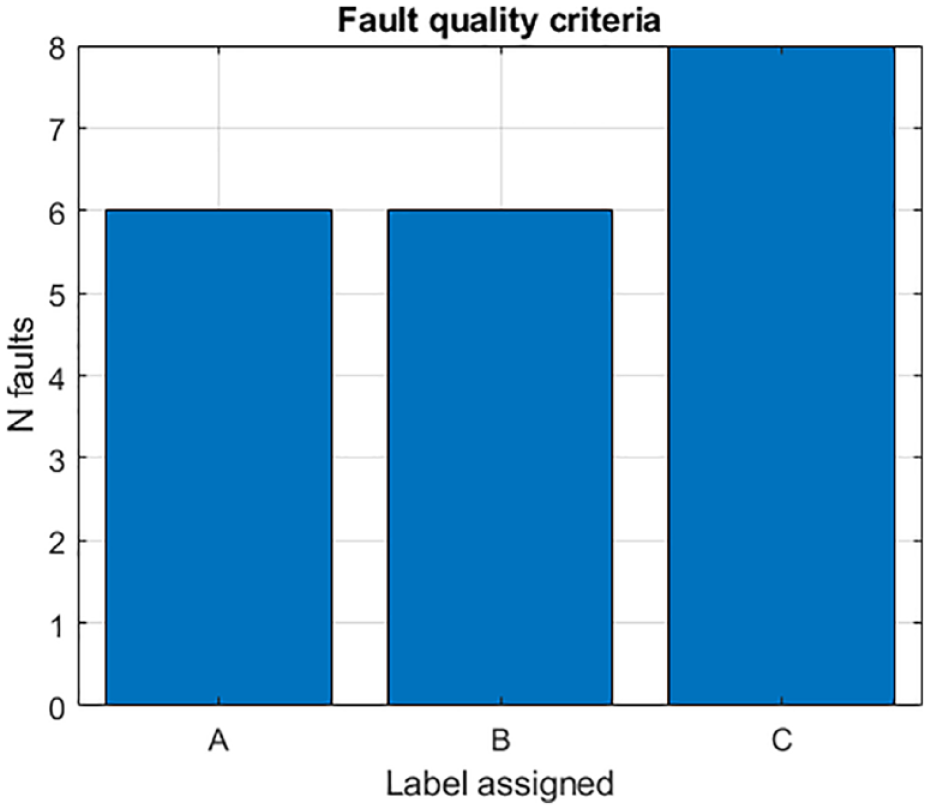
Distribution of failures labels.
Since a lot of missing portions were present in the data, both data streams coming from the two CGM sensors were used. When available simultaneously, the average of the two measurements was taken. From the resulting average CGM signal, portions of missing data shorter than 60 min were filled using linear interpolation. Insulin data was retrieved from the pump log and divided into manual bolus injections commanded by the user and basal insulin. Information about basal suspensions that occurred automatically to mitigate hyperglycemia was retrieved from the pump log. Meal information, when input by the user, was also collected from the pump log. More details on the data collected can be found in the Appendix.
Subjects’ age (mean ± SD) was 28.1 ± 9.0 y, body mass index was 26.3 ± 4.8, duration of diabetes was 17.5 ± 8.8 y, HbA1C was 7.3% ± 0.8%, insulin dose was 0.7 ± 0.3 l/kg/day, and diameter of LH was 8.0 ± 4.6 cm. Glucose control metrics in this population during the trial were: time in range 51.70% ± 14.34; time in hypoglycemia 3.54% ± 2.38; time in hyperglycemia 44.76% ± 15.46; Mean CGM (mg/dL) 181.00 mg/dL ± 28.62; CGM standard deviation 70.27 mg/dL ± 11.33 and CV 0.39 ± 0.05.
Evaluation Criteria
Since malfunctioning were determined by a team of clinicians, the time of the replacements is known with certainty. However, due to the delayed effect of insulin and meals on blood glucose, it is impossible to determine the exact time of the beginning of the infusion site failures. We considered as successful the algorithm alarms that were raised within a maximum of 6 h before the replacement and we define them as True Positive (TP). The 6 h value is long enough to include the whole infusion site failures dynamics but also conservative enough to ensure that the alarm is raised because of the malfunctioning and not by mistake. If no alarm is raised 6 h before the replacement, a False Negative (FN) is assigned.
If an alarm is generated but no replacement of the infusion set (due to malfunctioning) occurs in the next 6 h, a False Positive (FP) is assigned. After a malfunctioning, some time is required before a situation of normality can be restored. Therefore, late alarms, i.e., alarms raised 6 h after the replacement, are not considered and thus do not count as FP. The calculation of True Negatives (TN) for this problem is complex but also of limited interest, 27 since we are dealing with a highly unbalanced dataset (very few fault events over several weeks of data). For such reason, TNs are not calculated.
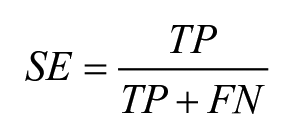
Sensitivity (SE) was used to evaluate the ability of the algorithm to effectively detect infusion set failures.
Moreover, since the number of FPs is expected to increase as the length of the study increases, we also calculate the average number of FPs per day (FP/day) in the population. Finally, timeliness of correct alarms (true positives) was evaluated by computed the time gain, Tgain, defined as the difference from the time the alarm is raised from the time the infusion set is replaced. A small value of Tgain indicates that the algorithm was not so effective at anticipating the faults. On the contrary, a large value of Tgain indicated effective anticipation of the event. It should be noticed that, given our definition of TP, Tgain can be at most 6 h. Large Tgain thus are not imputable to premature alarms.
Detection Methodology
Overview of the methodology
The proposed method is explained in detail in Meneghetti et al.22,23 We defer the interested reader to the original articles for more details on the implementation. Briefly at each time step, the incoming data are processed and numerical features describing the status of the pump user are derived. Then, the obtained features are fed to the unsupervised anomaly detection algorithm, which produces an anomaly score (AS) that measures how much the new data differs from the others previously observed. When the AS exceeds a threshold, an alert is generated to warn the patient of a possible infusion site failures. Figure 3 depicts an illustrative scheme of the proposed method.
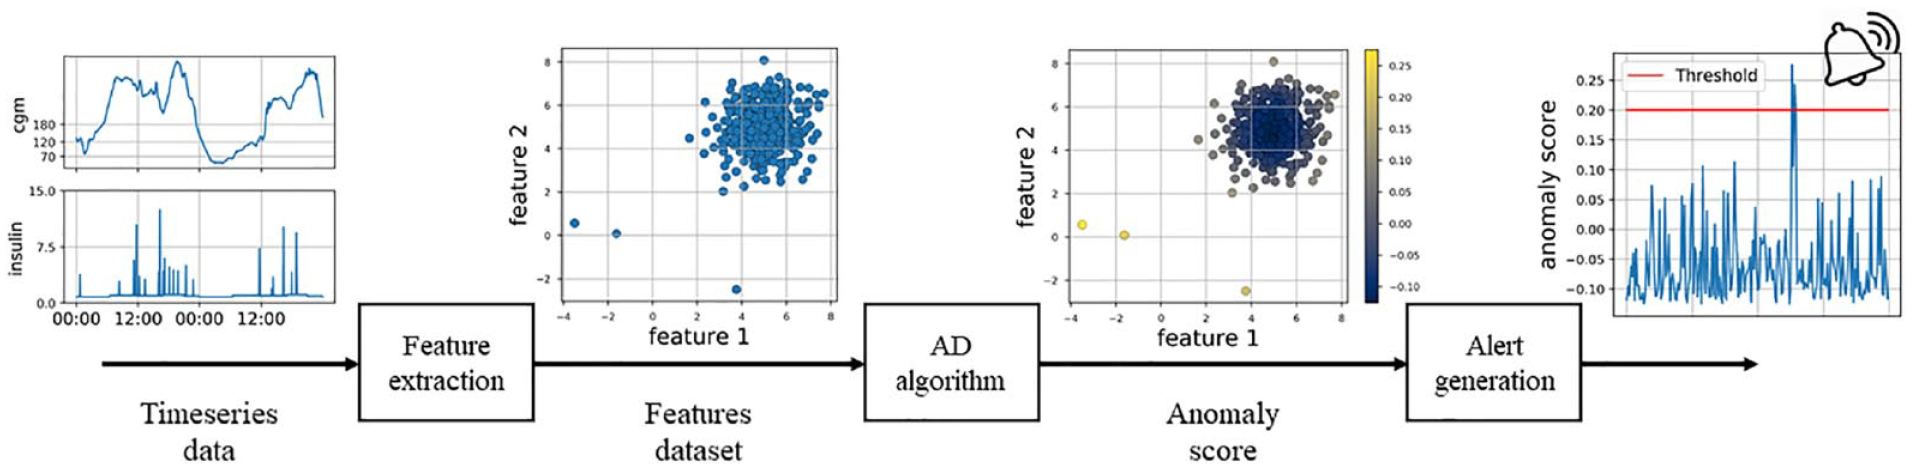
Scheme of the proposed method.
Various unsupervised anomaly detection algorithms have been proposed in machine learning, differing mostly on the criteria used to assign the AS. In Meneghetti et al. 23 we conducted an analysis to the determine the most efficient algorithms for the purpose of automatically detecting pump faults. In this work, we employ the three algorithms that resulted to be the most effective in our previous analysis: Isolation Forest 28 (IF), Histogram Based Outlier Score 29 (HBOS), and K-Nearest Neighbors 30 (KNN). More details on how the algorithms calculate the AS are reported in the additional material to this paper. For the implementation of the algorithms we used a distribution that is available at PyOD, 31 an open source library of anomaly detection algorithms.
Feature engineering and selection
An important step for the application of machine learning algorithms is the feature engineering procedure, i.e. the transformation of the available data into appropriate numerical attributes to be used by the algorithms. Modern deep-learning methods allow to avoid this procedure and were recently used for predicting BG values in people with T1D. 32 However, deep-learning methods require a very large amount of data to be efficient. Therefore, in this work we resort to a manual feature engineering procedure, which uses data collected exclusively from the CGM sensor and the CSII pump. The extracted features differ from those proposed in Meneghetti et al 23 which aimed to be used in the presence of a CL system. Additionally, the newly obtained feature set does not rely on rigorous meal announcements provided by the user.
Since insulin does not impact the BG levels immediately and its effect can only be observed after a minimum time of 30 to 60 minutes, the information of injected insulin collected from the pump is transformed to better account for the underlying physiological dynamics. The transformation consists of a second-order low-pass filtering with impulse response h(t) =
In Meneghetti et al 23 we proved the efficacy of including a feature inspired by model-based fault detection techniques, i.e. the prediction residuals, obtained as the difference between the BG predicted by a model and the BG measured by the CGM. Therefore, prediction residuals are also used in this work as a feature. The prediction is obtained from a Kalman filter that uses autoregressive-moving-average models with exogenous inputs (armax). The prediction horizon is set at 2 hours ahead. The models are identified using the information derived from the CGM sensor and the pump log, with the MATLAB system identification toolbox. 2 From the pump log, we used information on injected insulin and consumed meals (when input by the user).
When monitoring the signals of measured glycemia and injected insulin, for the purpose of detecting infusion site failures, besides current values, it is important to capture signal variability over different time scales, as proposedin Refs. .19-21 For instance, persistently high glycemia for a period up to 24 h, quantified by the average glucose in 24 h, can be an indicator of partially reduced insulin infusions, possibly because of a malfunctioning infusion set. On the other hand, a complete pump occlusion can result in a glycemia raise that leads to high average glucose even in shorter time window (1-3 h). Similarly, in the presence of a malfunctioning infusion set, we also expect to observe an increment of the average insulin infused as compared to usual, caused by the patient’s attempt to correct hyperglycemia (unsuccessfully). Therefore, it is convenient to monitor average insulin over both long and short time-windows. To capture different time scales, we defined a feature set that is composed of the moving average of the three considered signals (CGM, insulin, and prediction residuals) performed with six different time windows: 1 h, 3 h, 6 h, 12 h, 24 h and 48 h. This procedure produces a feature set containing 6 × 3 = 18 features.
The final feature set contains an additional feature: the time since the last infusion set replacement. Since prolonged wearing of the infusion set is associated with increased risk of malfunctioning, it is important to monitor this variable along with the other features described above.
The obtained features are evidently highly correlated and machine learning methods are known to benefit from a parsimonious feature set with uncorrelated features.
33
Automated dimensionality reduction techniques were considered (such as principal component analysis) but were not effective in increasing the performance. Therefore, we performed a backward feature selection
34
for every algorithm to determine the optimal feature set. Backward feature selection starts by considering all the features and works backward from there, removing one by one the feature that leads to the highest performance improvement (or the lowest performance degradation) until no more are left. The importance of a feature can thus be measured by the order in which the feature is selected. During this procedure, the performance improvement/degradation achieved by removing a feature is evaluated using the cost function
Alarm mechanism
The alarm is generated when the AS produced by the algorithm crosses a threshold value. Once the optimal feature set is defined, the threshold value is selected performing a leave-one-out procedure, to avoid overfit. In this procedure, one subject at a time is removed from the dataset and the optimal threshold value is calculated on the remaining 19 subjects as. The procedure is repeated for every subject, calculating a different threshold using only the remaining subjects, obtaining 20 optimal threshold values. The optimal value was calculated as the median of the obtained values. The obtained values were almost identical for all the subjects and differences observed did not affect the final performance significantly.
Results
Figure 4 reports an example of the AS obtained using IF and the entire feature set (without feature selection) on representative subject 1. The first two panels show two features: average CGM using a moving window of 1 h and 24 h; the subsequent two panels show another two features representing the injected insulin average using a moving window of 1 h and 24 h; the last subplot shows the feature representing the days since the last infusion set replacement. Each point of the time-series is colored according to the AS produced with IF: blue and red represent the lowest and the highest AS, respectively. Thin vertical gray bars show the beginning of each day of the trial, the two thick vertical black bars represent the moment of infusion set replacements due to failures. In correspondence of the first and second failure, the algorithm would have raised the alarm 3 and 6 h before the replacements, respectively, possibly reducing the time in hyperglycemia. At ~1.5 d before the first failure, the algorithm assigns a very high AS due to the high values of insulin and CGM observed in the long period. This alarm was considered a false alarm because it occurred more than 6 h before the replacement however, it can be speculated that the infusion set was already in bad conditions at this point given that the infusion set had been worn for almost 4 d already.
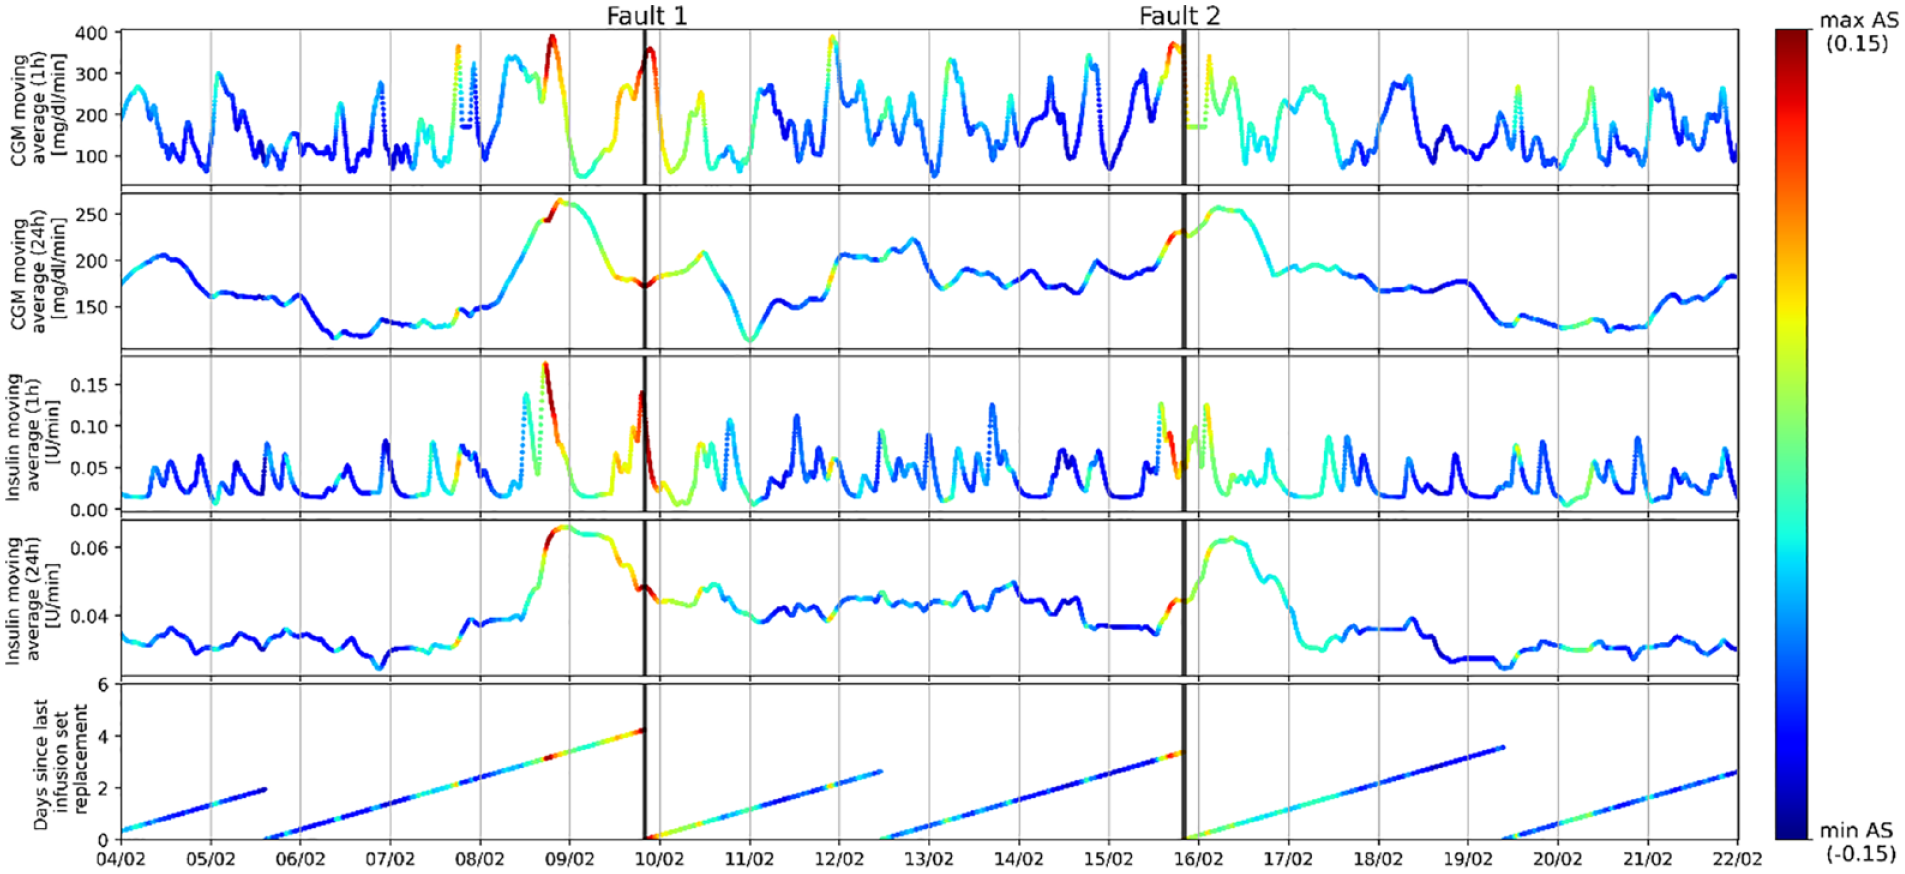
Example of the anomaly score (AS) assigned by IF on subject CO-01JG, represented using CGM data, insulin data and infusion set life. The color is given according to the score, normalized between minimum and maximum values observed.
Table 1 reports the results obtained without feature selection. Here we observe that the highest performance overall is obtained by IF, with 0.65 sensitivity and 0.14 FP/day. A slightly lower number of false-positives is observed with KNN although with considerably less sensitivity. The simpler algorithm, HBOS, obtained the worst performance. The time gained thanks to the detection (median [25th, 75th percentile]) is highest for HBOS (275 min), followed by KNN (160 min) and IF (135 min).
Performance Results Without Using the Feature Selection Procedure.
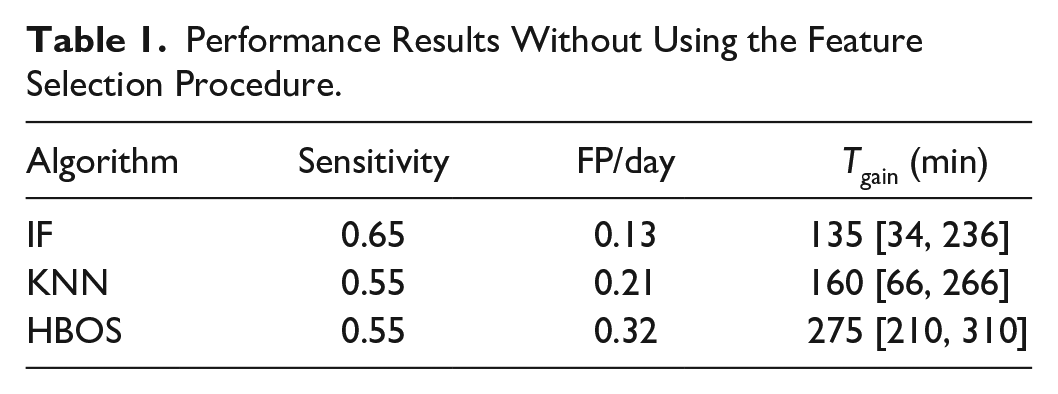
Table 2 reports the results obtained with the feature selection procedure. In this case, the highest performance overall is obtained by KNN, with 0.75 sensitivity (15 out of 20 total reported failures detected) and 0.08 FP/day. The sensitivity of IF is unchanged (0.65), but its precision is improved (0.08 FP/day). The performance of HBOS is improved overall (0.55 sensitivity with 0.05 FP/day); however, it remains inferior with respect to the other two considered algorithms. In this configuration, the Tgain is lowered for every algorithm, with the best performance obtained by HBOS (125 min), followed by KNN and IF (85 min).
Performance Results Using the Feature Selection Procedure.
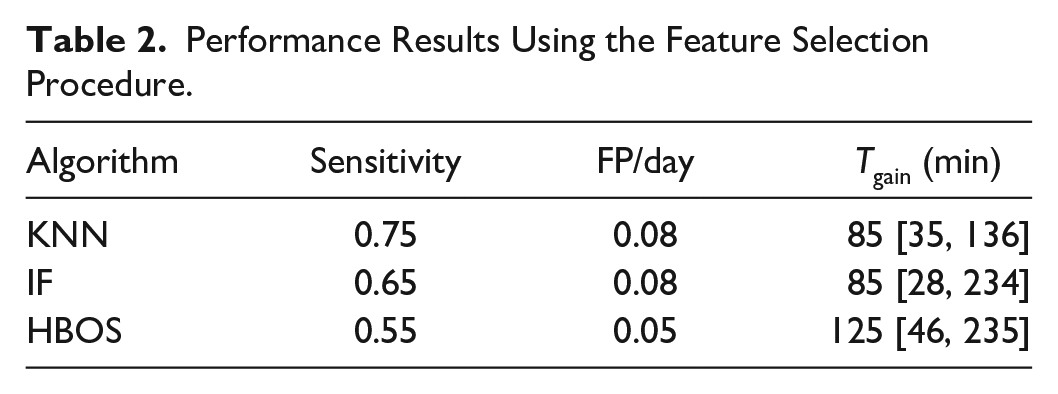
This proves the importance of the feature selection step: the procedure improved the performance of HBOS and KNN by drastically reducing FP/day and improving the sensitivity in the case of KNN. The performance of IF was adjusted towards less FP/day with slightly less sensitivity. Overall, the selected features had the effect of improving the precision of the algorithms at the cost of a lower time gain.
The algorithm proposed by Howsmon et al was reimplemented to be compared with our method. Figure 5 reports the results of the comparison. Regarding the algorithm by Howsmon et al two results are visualized: one is obtained using the hyperparameters reported in their paper and the other is obtained after retuning the hyperparameters on our dataset. Differences in the performance reported in their paper and that obtained in our reimplementation are likely due to a different evaluation criterion and a different definition of the set failure start they used (last CGM signal trough). When considering the feature set obtained after the feature selection procedure, the performance of each anomaly detection algorithm is superior to that obtained by Howsmon et al.
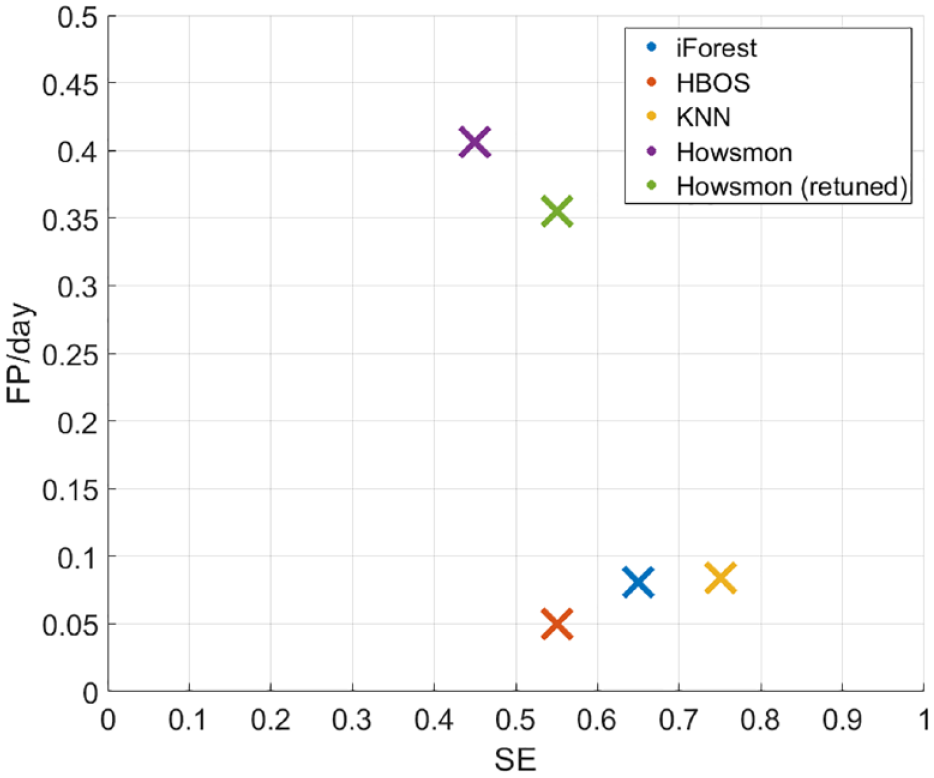
Performance obtained by the three anomaly detection algorithms considered and comparison with the performance obtained using the algorithm proposed by Howsmon et al. 20
Conclusions
In this work we tested a method for automatic detection of infusion site failures in real-time using unsupervised anomaly detection algorithms, which can detect anomalies through the analysis of patient historical data. This approach was previously proposed for CL data and validated using in-silico data. In this paper, the method was adapted to be used also in the absence of CL systems and without meal announcements. This was achieved by proposing a new feature set that uses data collected exclusively from the CGM sensor and the CSII pump. Furthermore, the method was tested on data coming from a clinical trial where the occurrence of infusion site failures was increased by requesting patients to wear the infusion set for prolonged time and failures where labeled by the clinical team.
In the best configuration, the proposed approach achieved a performance of 0.75 sensitivity (15 out of 20 total failures detected) along with 0.08 FP/d, which outperforms previously proposed literature algorithms, tested on the same dataset.
For what it concerns the generalizability of these finding, it should be noted that different performances might be observed in subjects whose glycemic control significantly differs from the one in the study population. Moreover, the detection performance can be affected by the quality of CGM sensors data: high frequency of missed samples, large CGM error, and accuracy degradation over time are expected to reduce detection efficacy. Finally, it should be noted that in the dataset under analysis, the study team manually labelled each infusion set replacement, deciding if this was to be imputed to an infusion set failure or not. Incorrect manual labelling unavoidably influences the subsequent analysis.
In this study, we assumed the availability of 30 days of data (the full duration of the trial) although in practice we would need to assume a startup period for the initial data collection. Nonetheless, this issue can be mitigated by pre-filling the historical data using population data or even simulated data. About the computational costs of implementing this method on CSII pumps, the common sampling time of CGM systems (5 min) is long enough to grant portability. Cloud computing can further simplify the computational task and provide a framework to implement fault detection inside remote monitoring applications.
The developed method focuses on detecting infusion site failures; however, future works will investigate the possibility of extending it to the detection of other anomalies such as sensor faults or communication errors in CGM pump-integrated systems. Further performance assessment through real-time testing of the proposed method in dedicated clinical trials is needed.
Supplemental Material
sj-pdf-1-dst-10.1177_1932296821997854 – Supplemental material for Machine Learning-Based Anomaly Detection Algorithms to Alert Patients Using Sensor Augmented Pump of Infusion Site Failures
Supplemental material, sj-pdf-1-dst-10.1177_1932296821997854 for Machine Learning-Based Anomaly Detection Algorithms to Alert Patients Using Sensor Augmented Pump of Infusion Site Failures by Lorenzo Meneghetti, Eyal Dassau, Francis J. Doyle and Simone Del Favero in Journal of Diabetes Science and Technology
Footnotes
Acknowledgements
The authors would like to thank Prof. Bruce Buckingham and Prof. Wayne Bequette for helping in the data acquisition, as well as Dr. Marzia Cescon and Dr. Sunil Deshpande for providing helpful discussions for the development of this work.
Abbreviations
BG, blood glucose; CGM, continuous glucose monitoring; CL, closed-loop; CSII, continuous subcutaneous insulin infusion pumps; HBOS, histogram based outlier score; IForest, isolation forest; KNN, K-nearest neighbors; T1D, type 1 diabetes.
Declaration of Conflicting Interests
The author(s) declared the following potential conflicts of interest with respect to the research, authorship, and/or publication of this article: L.M and S.D.F. hold patent applications related to the proposed method. ED is currently an employee and shareholder of Eli Lilly and Company. The work presented in this paper was performed as part of Dr. Dassau’s academic appointment and is independent of his employment with Eli Lilly and Company.
Funding
The author(s) disclosed receipt of the following financial support for the research, authorship, and/or publication of this article: This work was partially supported by the Ministero dell’Istruzione, Università e Ricerca (Italian Ministry of Education, Universities and Research) through the project Learn4AP: Patient-Specific Models for an Adaptive, Fault-Tolerant Artificial Pancreas (initiative “SIR: Scientific Independence of young Researchers”, project ID: RBSI14JYM2).
Supplemental Material
Supplemental material for this article is available online.
References
Supplementary Material
Please find the following supplemental material available below.
For Open Access articles published under a Creative Commons License, all supplemental material carries the same license as the article it is associated with.
For non-Open Access articles published, all supplemental material carries a non-exclusive license, and permission requests for re-use of supplemental material or any part of supplemental material shall be sent directly to the copyright owner as specified in the copyright notice associated with the article.