
Abstract
Mean amplitude of glucose excursion (MAGE) is considered as the “gold standard” for assessing the short-term within-day glycemic variability (GV), which is an important component of overall glycemic control. A 14-day continuous glucose monitoring system is now widely used and allows easier assessment of GV. However, it is still unknown whether MAGE, usually calculated on a 48-hour period is identical whatever the time during the 14-day lifespan of the sensor and whether a longer time period might give additional information. We evaluated in 68 patients with type 1 diabetes, MAGE during three 2-day periods (day1-day3; day6-day8; day11-day13) and during periods of 3 days and 4 days. MAGE calculated at the three 2-day periods were identical and not different from MAGE of the 3-day or 4-day periods.
Introduction
During the last decade, a lot of attention has focused on glycemic variability (GV).1,2 Indeed, several studies have shown an independent association between GV and diabetic complications in patients with type 1 or type 2 diabetes. GV was associated with diabetes neuropathy independently of other factors including HbA1c. 3 In patients from the Diabetes Control and Complications Trial (DCCT), time in range (TIR), which account for both mean glucose and GV, was associated with retinopathy progression and development of microalbuminuria with a higher hazard ratio than HbA1c. 4 GV has been shown to be independently associated with the presence and the severity of coronary artery disease in patients with type 2 diabetes.5,6 GV was, after an acute coronary syndrome or after percutaneous coronary intervention, a strong independent predictive factor of short term or midterm Major Cardiovascular Adverse Events, in patients with type 2 diabetes,.7,8 In addition, GV significantly correlated with endothelium dysfunction and carotid intima-media thickness in both patients with and without diabetes. 9 Moreover, GV has been shown to be a robust discriminator of hypoglycemia in patients with diabetes. 10
A 14-day continuous glucose monitoring (CGM) is now available and frequently used as an everyday CGM method, especially in patients with type 1 diabetes. CGM allows to easily evaluate GV in patients with diabetes. 2 CGM will develop as the usual mean to assess GV, which may become an important metabolic outcome in many clinical studies performed in patients with diabetes. The mean amplitude of glycemic excursions (MAGE) is considered as the “gold standard” for assessing the short-term within-day GV.2,11,12 MAGE, which evaluates major glucose fluctuations from peaks to nadirs beyond mean blood glucose values, reflects the instability of daily blood glucose levels in patients with diabetes.
Data from CGM obtained with the 14-day CGM system, Freestyle Libre® (FL), allow with simple calculation to measure MAGE. MAGE is usually calculated on a 2-day period. However, we do not know whether MAGE measured during two days at the beginning, at the middle or the end of the 14-day monitoring period of the 14-day CGM system gives similar results. In addition, we do not know whether evaluation of MAGE during a longer period, such as three or four days, may give additional information.
This prompted us to perform a prospective study in patients with type 1 diabetes using the 14-day CGM system to evaluate (1) possible differences of MAGE measured during two days at the beginning, at the middle or the end of the 14-day CGM period; (2) possible differences of MAGE measured during two days, three days, or four days.
Patients and Methods
This prospective study was approved by our regional ethics committee and written informed consent was obtained from all patients before study inclusion (trial registered as NCT03496597).
Sixty-eight patients with type 1 diabetes, from two centers for diabetic care, were included in the prospective study. All patients were using the 14-day unblinded CGM system FL, for at least six months. Thirty-two patients were treated by insulin basal-bolus regimen and 36 with insulin pump. No patient had a closed loop insulin pump or a pump combined with CGM technology. The patients were asked to maintain their usual activities throughout the 14-day study period.
GV data were analyzed during a 2-day period from day 1 to day 3, from day 6 to day 8 and from day 11 to day 13 as shown on Figure 1. Day 1 was considered to start 24 hours after the application of the 14-day CGM sensor. GV data were also analyzed during a 3-day period from day 5 to day 8 and during a 4-day period during day 5 to day 9 (Figure 1).
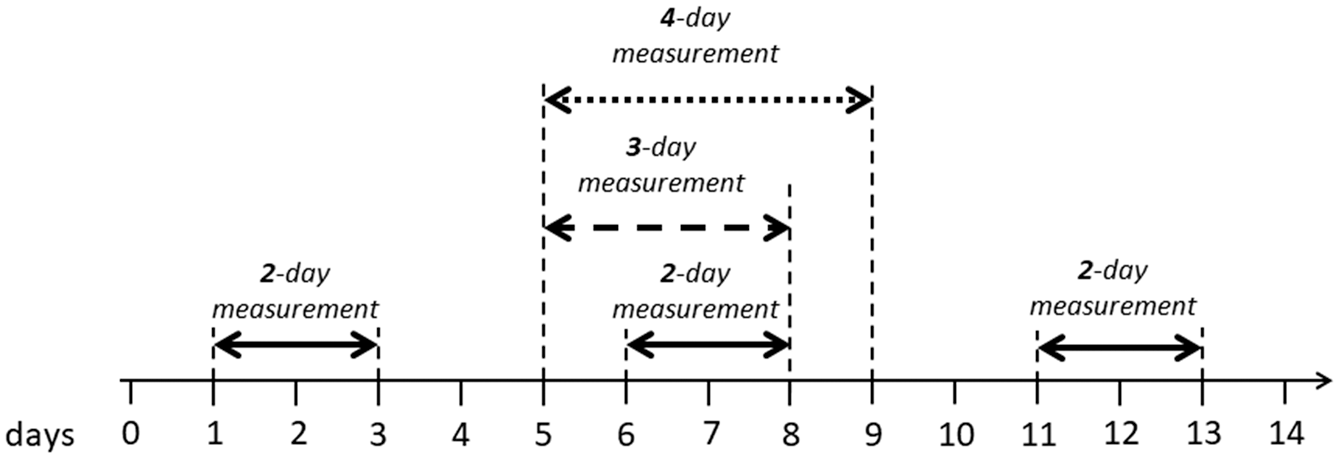
Different periods used to assess glycemic variability during the 14-day CGM sensor lifespan, in the study.
For each period, means, standard deviations (SD), coefficients of variation (CV) and MAGE were calculated. MAGE was calculated by tacking the arithmetic mean of the glucose increases or decreases (from nadirs to peaks or vice versa), when both ascending and descending segments exceeded the value of the SD for that period. 11 CV for glucose, as an index of short-term variability not dependent on overall exposure to glucose, was calculated as %: [SD/mean glucose] × 100
Data are reported as mean ± SD. We used the SPSS software package (Chicago, Illinois, USA) to perform the statistical analysis. Student’s t test was used to compare means between two groups. Comparisons of means between more than two groups were performed by analysis of variance (ANOVA). Analysis of covariance (ANACOVA) was used to compare means between different groups after controlling for some covariates. Linear regression analysis was used to determine the Pearson correlation coefficients (r). Statistical significance was considered for P values less than .05.
Results
The main characteristics of the studied population are shown in Table 1.
Main Clinical and Biological Characteristics of the 68 Patients with Type 1 Diabetes.
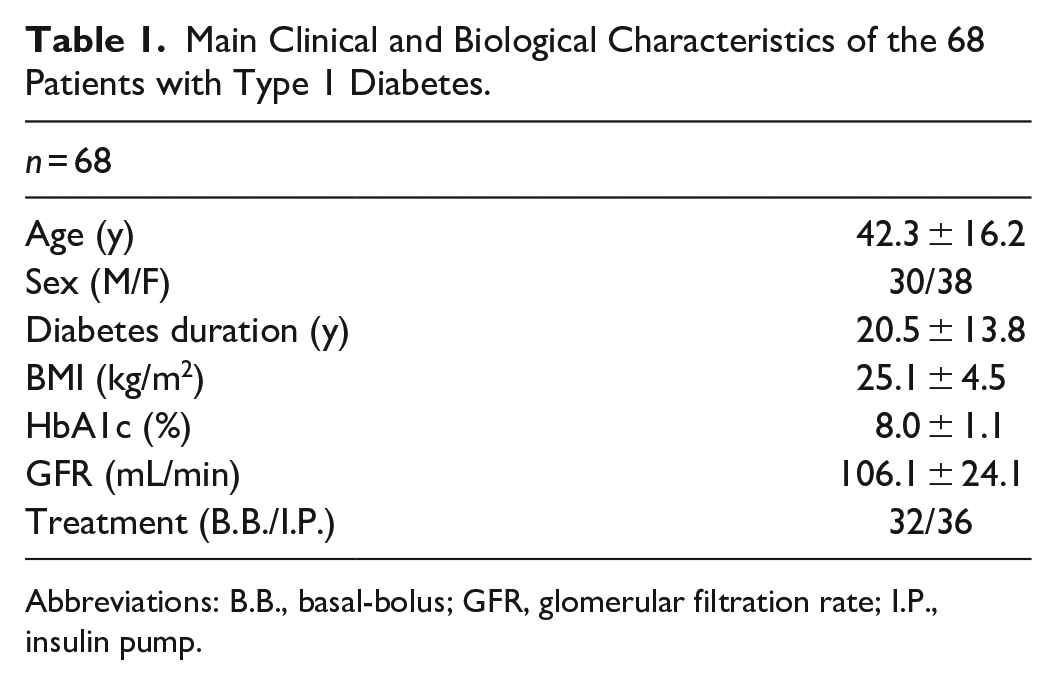
Abbreviations: B.B., basal-bolus; GFR, glomerular filtration rate; I.P., insulin pump.
GV data (means of SD, CV, and MAGE) are shown in Table 2. Means of SD, CV, and MAGE were not different between the three 2-day measurement periods (initial [day1-day3], middle [day6-day8], and final [day11-day13]) when compared by ANOVA. In addition, GV data from each 2-day period compared separately with each other 2-day period were not significantly different.
GV Data (Mean ± SD) for Each Measurement Period.
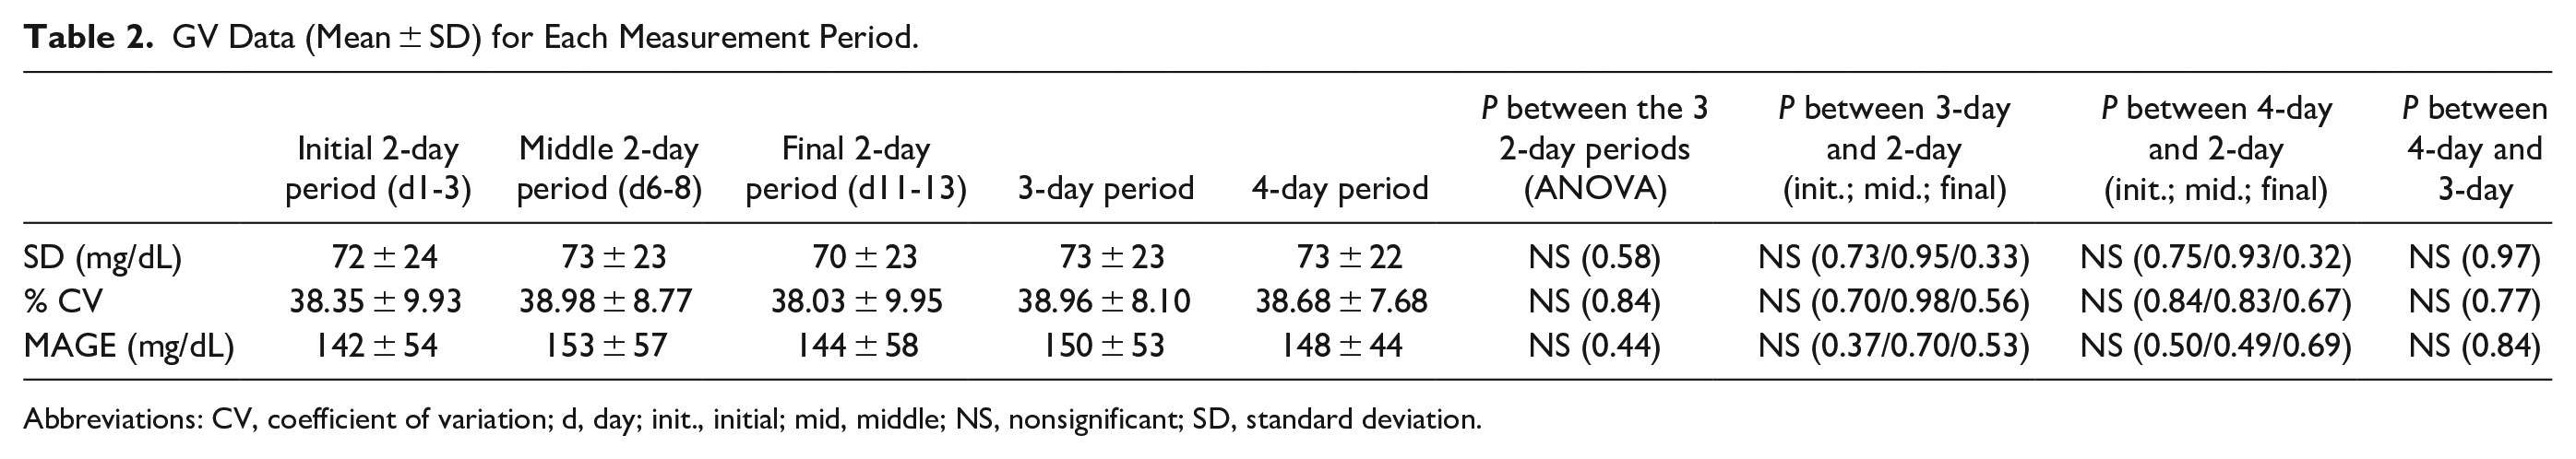
Abbreviations: CV, coefficient of variation; d, day; init., initial; mid, middle; NS, nonsignificant; SD, standard deviation.
GV data from each 2-day period compared with the 3-day period or the 4-day period were not significantly different (Table 2). Furthermore, GV data from the 3-day period and the 4-day period were not significantly different (Table 2). Figure 2 shows the five MAGE measurements for each patient.

Five MAGE measurements for each patient: initial 2-day period (), middle 2-day period ( ), final 2-day period (
 ), the 3-day period (
 ), and the 4-day period (
 ). MAGE values are expressed in mg/dL.
Means of MAGE remained still significantly not different between the five measurement periods after controlling for age, duration of diabetes, BMI and HbA1c.
We, then, compared the means of SD, CV and MAGE between the three 2-day measurement periods and between the five measurement periods separately in patients with the lowest mean MAGE (below the median value) and in patients with the highest mean MAGE (above the median value) and did not find, for each variable, any significant differences between the different time periods, in the two groups of patients.
For each GV parameter, the correlation between each period was very high. For instance, MAGE during the initial 2-day period was highly correlated with MAGE during the middle 2-day period (r = 0.65, P < .0001), with MAGE during the final 2-day period (r = 0.60, P < .0001), with MAGE during the 3-day period (r = 0.70, P < .0001) and with MAGE during the 4-day period (r = 0.68, P < .0001). As shown on Figure 3, the regression lines between MAGE during the initial 2-day period and MAGE during each other period (middle 2-day, final 2-day, 3-day and 4-day) were very similar.

Regression line and correlation coefficient between MAGE during the initial 2-day period and MAGE during the middle 2-day period (), MAGE during the final 2-day period ( ), MAGE during the 3-day period (
 ) and MAGE during the 4-day period (
 ).
).
Discussion
In the present study we show that MAGE, an essential index for GV, can be performed during two continuous days at different times of the 14-day CGM sensor lifespan, providing similar results and that a longer time measurement of MAGE during three or four days does not provide additional information.
GV has emerged during the past years as an important component of overall glycemic control with strong association with diabetic complications.4-8 The recent development of CGM with the 14-day CGM system, FL, allows assessing GV in clinical practice and, on a larger scale, in clinical trials. On a practical term, it is important to know whether GV assessment may be modified by the period used to measure GV data during the 14-day CGM sensor lifespan and whether longer period than 48 hours may give more information. These points have never been specified and our present study gives clear answers by showing that a 2-day period measurement is sufficient and that it can be performed at different time of the 14-day CGM sensor lifespan. This information is important for the use of the 14-day CGM system, FL, to assess GV in population with diabetes, in clinical studies.
In our study, we gave more attention to MAGE, which is considered as the “gold standard” for assessing the short-term within-day GV.2,11,12 The mean MAGE values in our population were very similar to the ones observed in other clinical trials of patients with type 1 diabetes.13-15 We had, in our study, a wide range of MAGE and have been able to show that, in both patients with the highest GV and patients with the lowest GV, MAGE assessment was identical during all the periods (initial 2-day, middle 2-day, final 2-day, 3-day, and 4-day).
Moreover, we showed that our results were not biased by age, duration of diabetes, BMI of HbA1c suggesting that they can be extrapolated to a wide population of patients with type 1 diabetes without any risk to be confounded by age, body weight, or glycemic control.
We have to acknowledge that our present study was performed in patients who were using the CGM system FL, for at least six months and that our conclusions may not be extrapolated to patients with little experience of the system.
Conclusion
The assessment of GV with MAGE can be easily performed in patients using a 14-day CGM system during a 2-day period at any time of the 14-day lifespan of the sensor. It does not seem necessary to augment the MAGE assessment period more than two days.
Footnotes
Abbreviations
ANACOVA, analysis of covariance; ANOVA, analysis of variance; CGM, continuous glucose monitoring; CV, coefficients of variation; DCCT, Diabetes Control and Complications Trial; FL, Freestyle Libre®; GV, glycemic variability; MAGE, mean amplitude of glycemic excursions; TIR, time in range; SD, standard deviations.
Declaration of Conflicting Interests
The author(s) declared no potential conflicts of interest with respect to the research, authorship, and/or publication of this article.
Funding
The author(s) received no financial support for the research, authorship, and/or publication of this article.