
Abstract
Background:
The ability to measure insulin secretion from pancreatic beta cells and monitor glucose-insulin physiology is vital to current health needs. C-peptide has been used successfully as a surrogate for plasma insulin concentration. Quantifying the expected variability of modelled insulin secretion will improve confidence in model estimates.
Methods:
Forty-three healthy adult males of Māori or Pacific peoples ancestry living in New Zealand participated in an frequently sampled, intravenous glucose tolerance test (FS-IVGTT) with an average age of 29 years and a BMI of 33 kg/m2. A 2-compartment model framework and standardized kinetic parameters were used to estimate endogenous pancreatic insulin secretion from plasma C-peptide measurements. Monte Carlo analysis (N = 10 000) was then used to independently vary parameters within ±2 standard deviations of the mean of each variable and the 5th and 95th percentiles determined the bounds of the expected range of insulin secretion. Cumulative distribution functions (CDFs) were calculated for each subject for area under the curve (AUC) total, AUC Phase 1, and AUC Phase 2. Normalizing each AUC by the participant’s median value over all N = 10 000 iterations quantifies the expected model-based variability in AUC.
Results:
Larger variation is found in subjects with a BMI > 30 kg/m2, where the interquartile range is 34.3% compared to subjects with a BMI ≤ 30 kg/m2 where the interquartile range is 24.7%.
Conclusions:
Use of C-peptide measurements using a 2-compartment model and standardized kinetic parameters, one can expect ~±15% variation in modelled insulin secretion estimates. The variation should be considered when applying this insulin secretion estimation method to clinical diagnostic thresholds and interpretation of model-based analyses such as insulin sensitivity.
Introduction
Diabetes is a metabolic disease characterized by rising insulin resistance, dysfunctional pancreatic beta cell insulin secretion, peripheral tissue insulin resistance, and resulting hyperglycemia. The ability to measure insulin secretion from pancreatic beta cells and monitor glucose-insulin physiology and disease progression is vital to current health needs. It is estimated that worldwide 8.8% of adults aged 20-79 years had diabetes in 2015, increasing to 10.4% (642 million) in 2040. 1 Diabetes is estimated to cost US$2.1 trillion in 2030 2 and there is also considerable public health burden as people with diabetes are more likely to have comorbidities such as cardiovascular disease, 3 amputation, 4 and vision loss. 5 Better understanding of the disease and treatment effectiveness will help to reduce the burden on health systems.
Physiological models and model-based tests, such as the intravenous glucose tolerance test (IVGTT), are common means of estimating parameters defining the complex metabolic dynamics observed in diabetes.6 -12 Many of these tests rely on accurate estimation of endogenous insulin secretion from C-peptide assays and deconvolution. 13 Eaton et al. 14 used a 2-compartment model framework to evaluate plasma insulin levels from C-peptide measurements and Van Cauter et al. 15 then standardized the kinetic parameters to allow for a less clinically intensive way of estimating insulin secretion from plasma C-peptide measurements. The method outlined from Van Cauter is well-accepted and has been used for over 25 years.16-19
Understanding the limitations and expected variability of the insulin secretion estimates is vital to effectively use and interpret model outputs to better inform and make use of model output to influence clinical decisions. This analysis will quantify the expected uncertainty in estimated insulin secretion using C-peptide measurements.
Methods
Patient Demographics
Forty-three healthy adult males of Te Moana Nui a Kiwa [Pacific Ocean; Aotearoa/NZ Māori and/or Pacific peoples (Polynesian)] living in New Zealand participated in a frequently sampled, intravenous glucose tolerance test (FS-IVGTT). The average age was 29 years and ranged from 19 to 41 years. Body mass index (BMI) was calculated and ranged from 26 to 48 kg/m2, with a median and average value of 33 kg/m2. No subject had diagnosed diabetes or were on any diabetes medications, although the data collected was from a trial intending to explore genetic links in diabetes onset. The data set used for this analysis is part of a larger study to investigate potential differences in insulin secretion and sensitivity based on genetic factors. About half of the subjects had a gene variant that increases the risk of Type 2 Diabetes.
Data Collection
Blood samples for glucose, insulin, and C-peptide measurement were taken at (t = 0), and 2, 4, 6, 8, 10, 30, and 60 minutes following an intravenous infusion of 0.3 g dextrose per kg of body mass (up to a maximum of 30 g as a 20% dextrose bolus delivered in <1 minute). Glucose was measured on a HemoCue Glucose 201+ System analyser and insulin and C-peptide was measured using the Roche Cobas e 411 analyser. Four participants were excluded from analysis due to hemolyzed blood samples, resulting in n = 39 complete data sets. Ethics approval from the Health and Disability Ethics Committee, New Zealand (17STH79) was received and informed consent was given before participation in the study.
Van Cauter Model
Van Cauter uses a two-compartment model from Eaton et al. 14 to estimate insulin secretion rates from plasma C-peptide concentration, as shown in Figure 1. C-peptide is secreted in the central compartment including plasma space and tissues, and is where intravenous sampling takes place. The peripheral compartment includes extravascular areas, and kinetic parameters k1 and k2 describe the transfer between the central compartment and the peripheral compartment. The kinetic parameter k3 describes metabolized C-peptide. The rate of change in the compartments is defined: 15


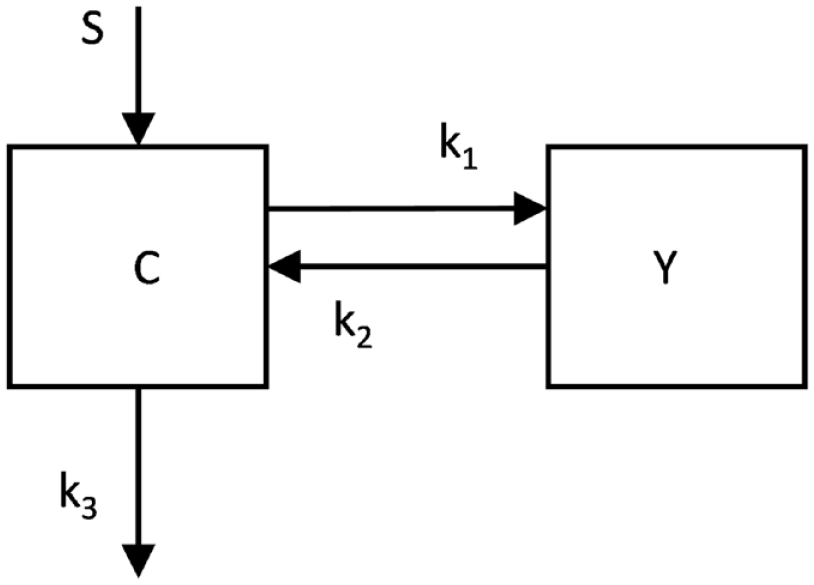
Schematic showing the 2 compartment model for insulin secretion from plasma C-peptide concentration where S is endogenous insulin secretion, C is the amount of C-peptide in the central compartment and Y is the amount of C-peptide in the peripheral compartment. Kinetic parameters are k1, k2, k3.
The kinetic parameters are defined: 15

where F = 0.76 for BMI ≤ 30 kg/m2 and F = 0.78 for BMI > 30 kg/m2


Three main parameters determine estimated insulin secretion: volume of distribution, Vp, short half-life, hf1, and long half-life, hf2. The volume of distribution is determined from body surface area (BSA):

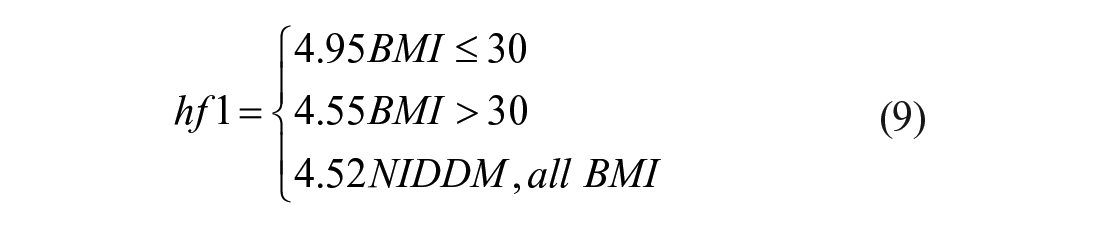
The short half-life is a given value depending on diabetes status, where NIDDM is non-insulin dependent diabetes mellitus, and BMI:
The long half-life is dependent on age:

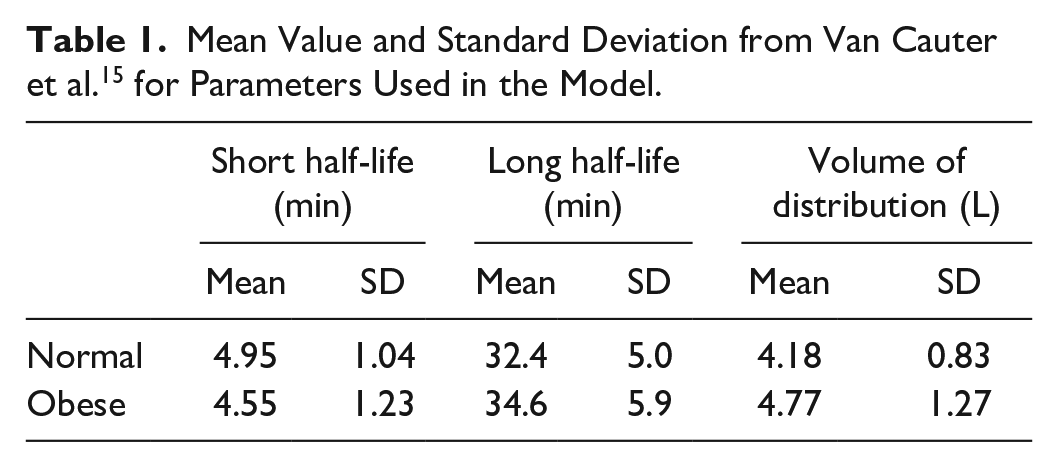
Table 1 shows the mean values and standard deviation of these parameters, as developed from the Van Cauter et al. cohort: 15
Mean Value and Standard Deviation from Van Cauter et al. 15 for Parameters Used in the Model.
Insulin Secretion AUC
Van Cauter’s kinetic parameters 15 were used to calculate an insulin secretion curve for each subject using measured C-peptide from the FS-IVGTT. Fifteen minutes of baseline values were added to the clinical data to assist in calculation dynamics. This was done by shifting all data forward 15 min, and using the baseline samples at t = 0 and t = 15. Thus, the glucose bolus was now given at t = 15 minutes. From the insulin secretion curve, the total area under the curve (AUC) from t = 15 minutes to t = 47 minutes was calculated as a measure of total units of secretion. Phase 1 AUC was calculated from t = 15 minutes to t = 18 minutes, inclusive (4 minute duration), and Phase 2 AUC was calculated from t = 19 minutes to t = 47 minutes (28 minute duration). These durations were chosen based on visual inspection of peak 1 duration, and the availability of C-peptide data at the time point.
Analysis
Insulin secretion profiles were calculated using C-Peptide measurements and Van Cauter’s kinetic parameters. 15 Potential variation in these insulin secretion estimates were generated by varying the parameters within their reported range. 15 Parameters were first modified individually to identify which parameter had the largest effect on insulin secretion. Monte Carlo analysis was then used to independently vary Vp, hf1, and hf2 within ±2 standard deviations of the mean of each variable, using Table 1, with a normal distribution. Based on convergence analysis, N = 10 000 combinations per subject were calculated. The 5th and 95th percentiles were calculated for each subject from the N = 10 000 Monte Carlo iterations and this range determined the bounds of the expected range of insulin secretion for each subject and test. Values within this range have appropriate, normally distributed probability of occurrence given their FS-IVGTT C-peptide assay data, as based on the variation reported by Van Cauter et al. 15
This range is thus a measure of potentially unseen variation in estimated secretion for the test and subject. Cumulative distribution functions (CDFs) were calculated for each subject for AUC total, AUC Phase 1, and AUC Phase 2. Normalizing each AUC by the participant’s median value over all N = 10 000 iterations quantifies the expected model-based variability in AUC, per patient and over the cohort.
Results
The median normalized interquartile range (IQR) of per-patient median C-peptide and insulin measurements was 1293.3 [893.3-1766.7] pmol/L and 80.4 [48.8-117.1] µU/mL. Median peak C-peptide values were 2640.0 [2466.7-3170.0] pmol/L. Insulin secretion profiles are calculated from C-peptide measurements using Van Cauter kinetic parameters. Each of the three main parameters were varied individually to determine the effect of each parameter on modelled insulin secretion, and results are shown for a representative patient in Figure 2. The volume of distribution, Vp, has the largest effect on total insulin secretion estimation from C-peptide measurements, affecting Phase 1 and Phase 2, and the short half-life has the next largest effect, mainly in Phase 2 (Figure 2). The long half-life parameter has negligible effect overall, but was included for completeness of analysis.
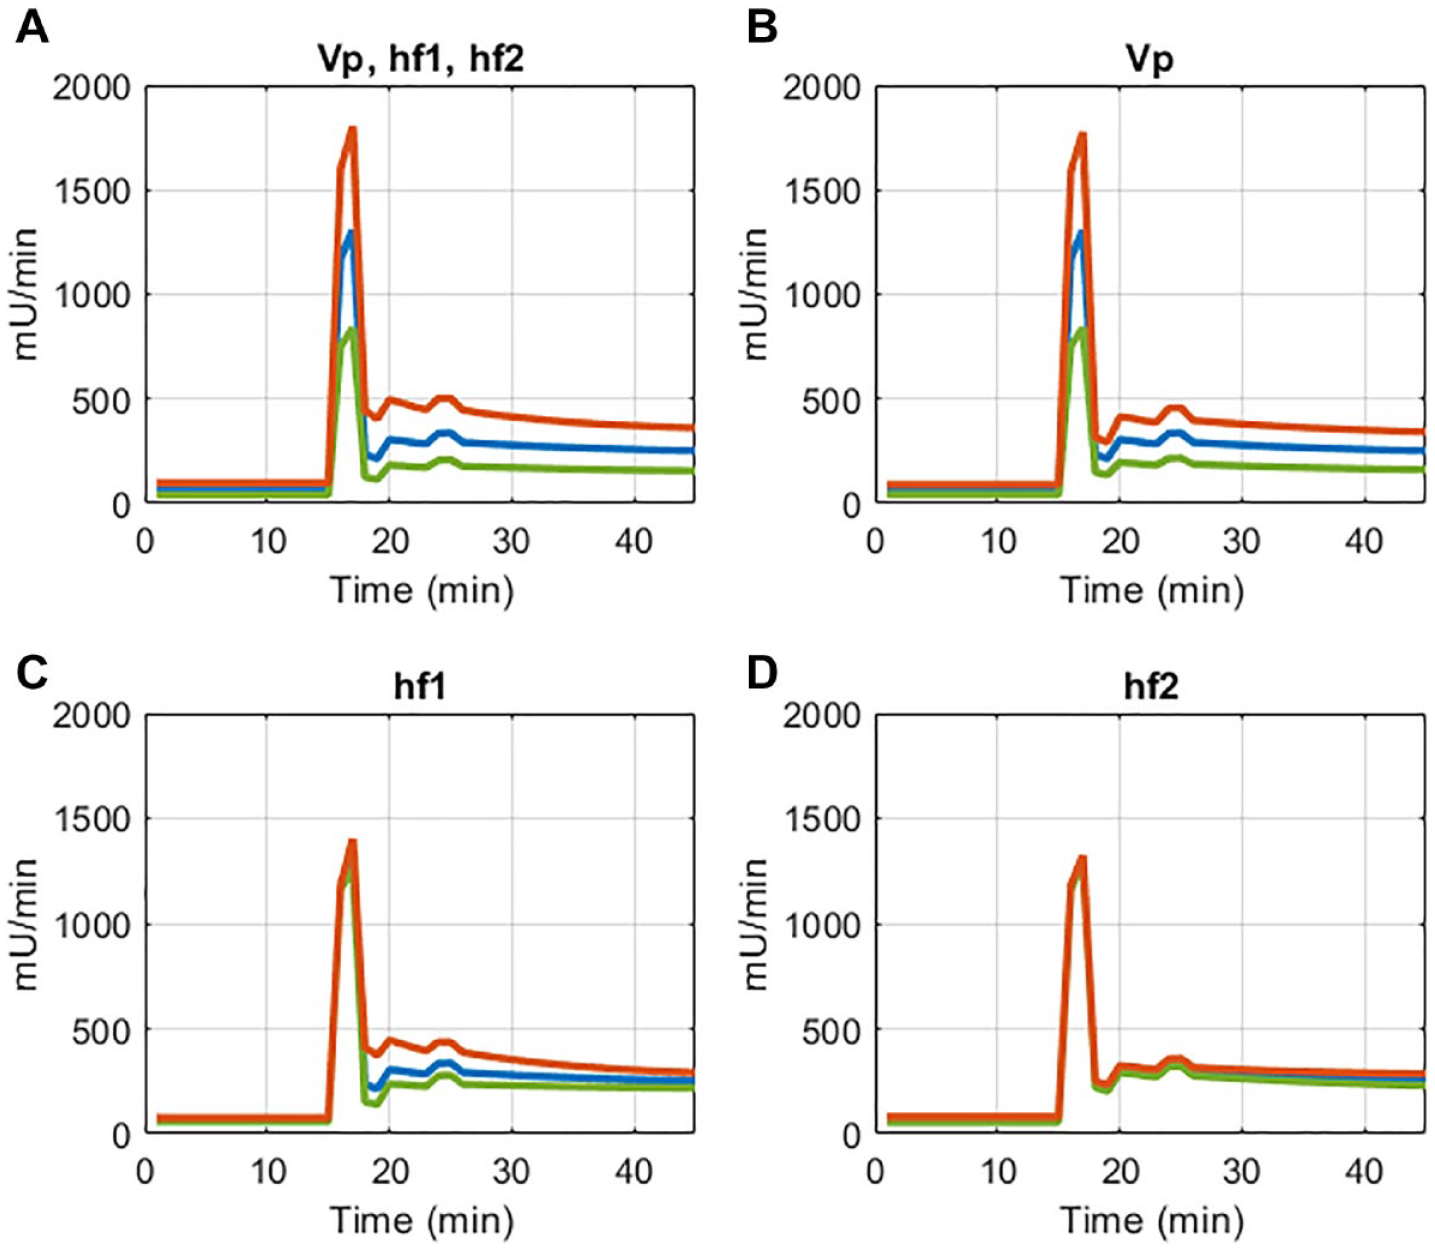
Insulin secretion when varying Van Cauter model parameters by 2 standard deviations when varying (clockwise) (A) Plasma volume (Vp), short half-life (hf1), and long half-life (hf2); (B) Vp; (C) hf1; (D) hf2. The 95th percentile is shown in orange, median is blue, and green depicts the 5th percentile.
Two types of model estimated insulin secretion response are seen. A typical healthy response shows a high first phase and low second phase response (Figure 3). The second type of curve shows a blunted first phase response and an elevated second phase (Figure 4). The mean secretion curve is plotted together with the 5th and 95th percentile from the N = 10 000 Monte Carlo iterations. The distribution of Vp, hf1, and hf2 are normally distributed and truncated to within 2 standard deviations (Figures 3 and 4) for physiological reasonableness. Mean values for the parameters were in similar range to those of the Van Cauter et al. cohort. 15 Plasma volumes were greater than the cohort in Van Cauter because this data cohort has genetic predisposition to being taller than the average population, resulting in a higher actual and calculated plasma volume.
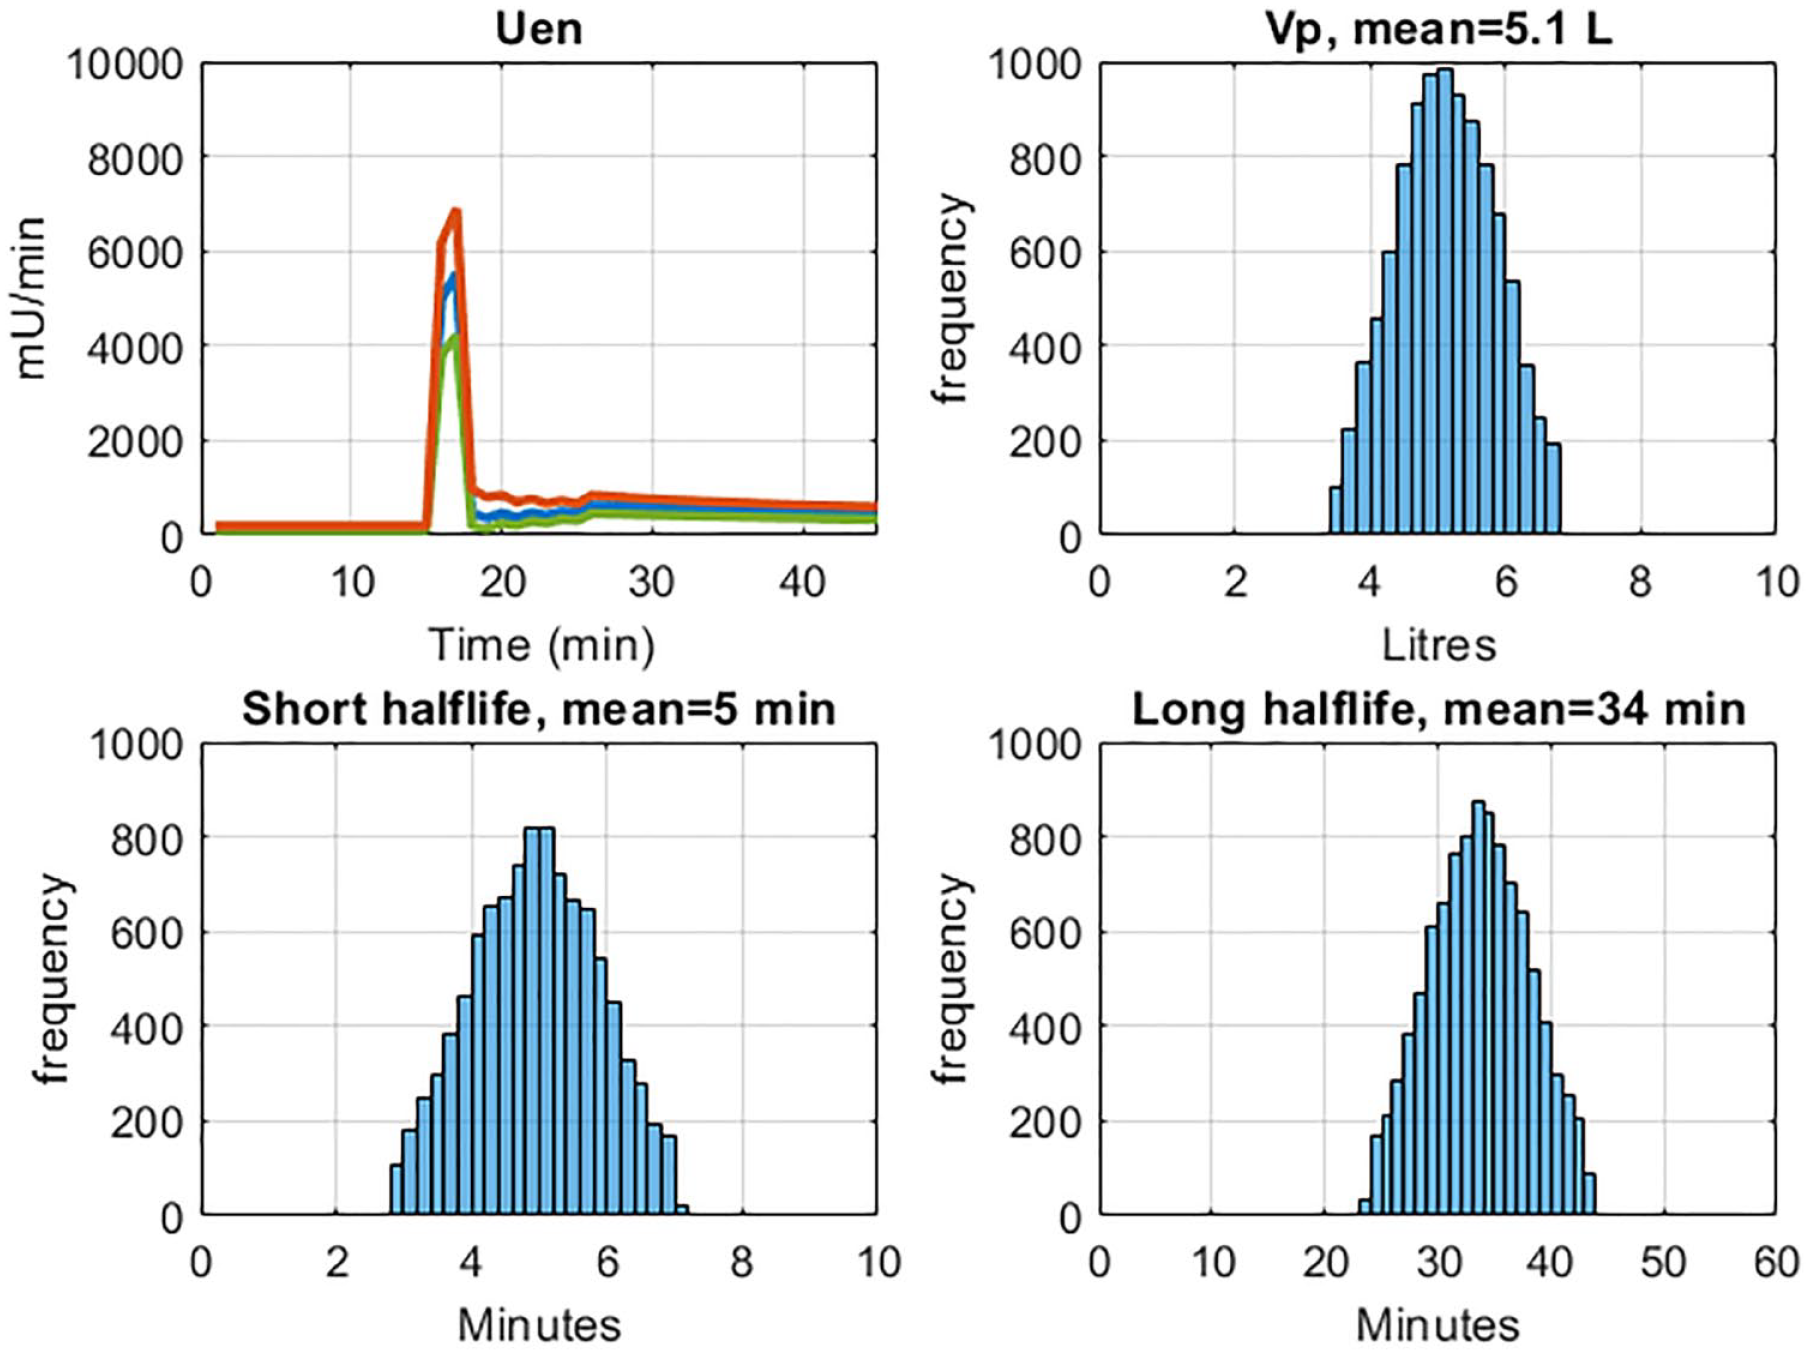
Insulin secretion profile variation resulting from kinetic parameter variation for Subject A, who displays a healthy 2-Phase insulin secretion response. Range of insulin secretion (95th percentile, median, and 5th percentile) shown in top left. Histograms showing the truncated normal distribution of Vp, short half-life, and long half-life.
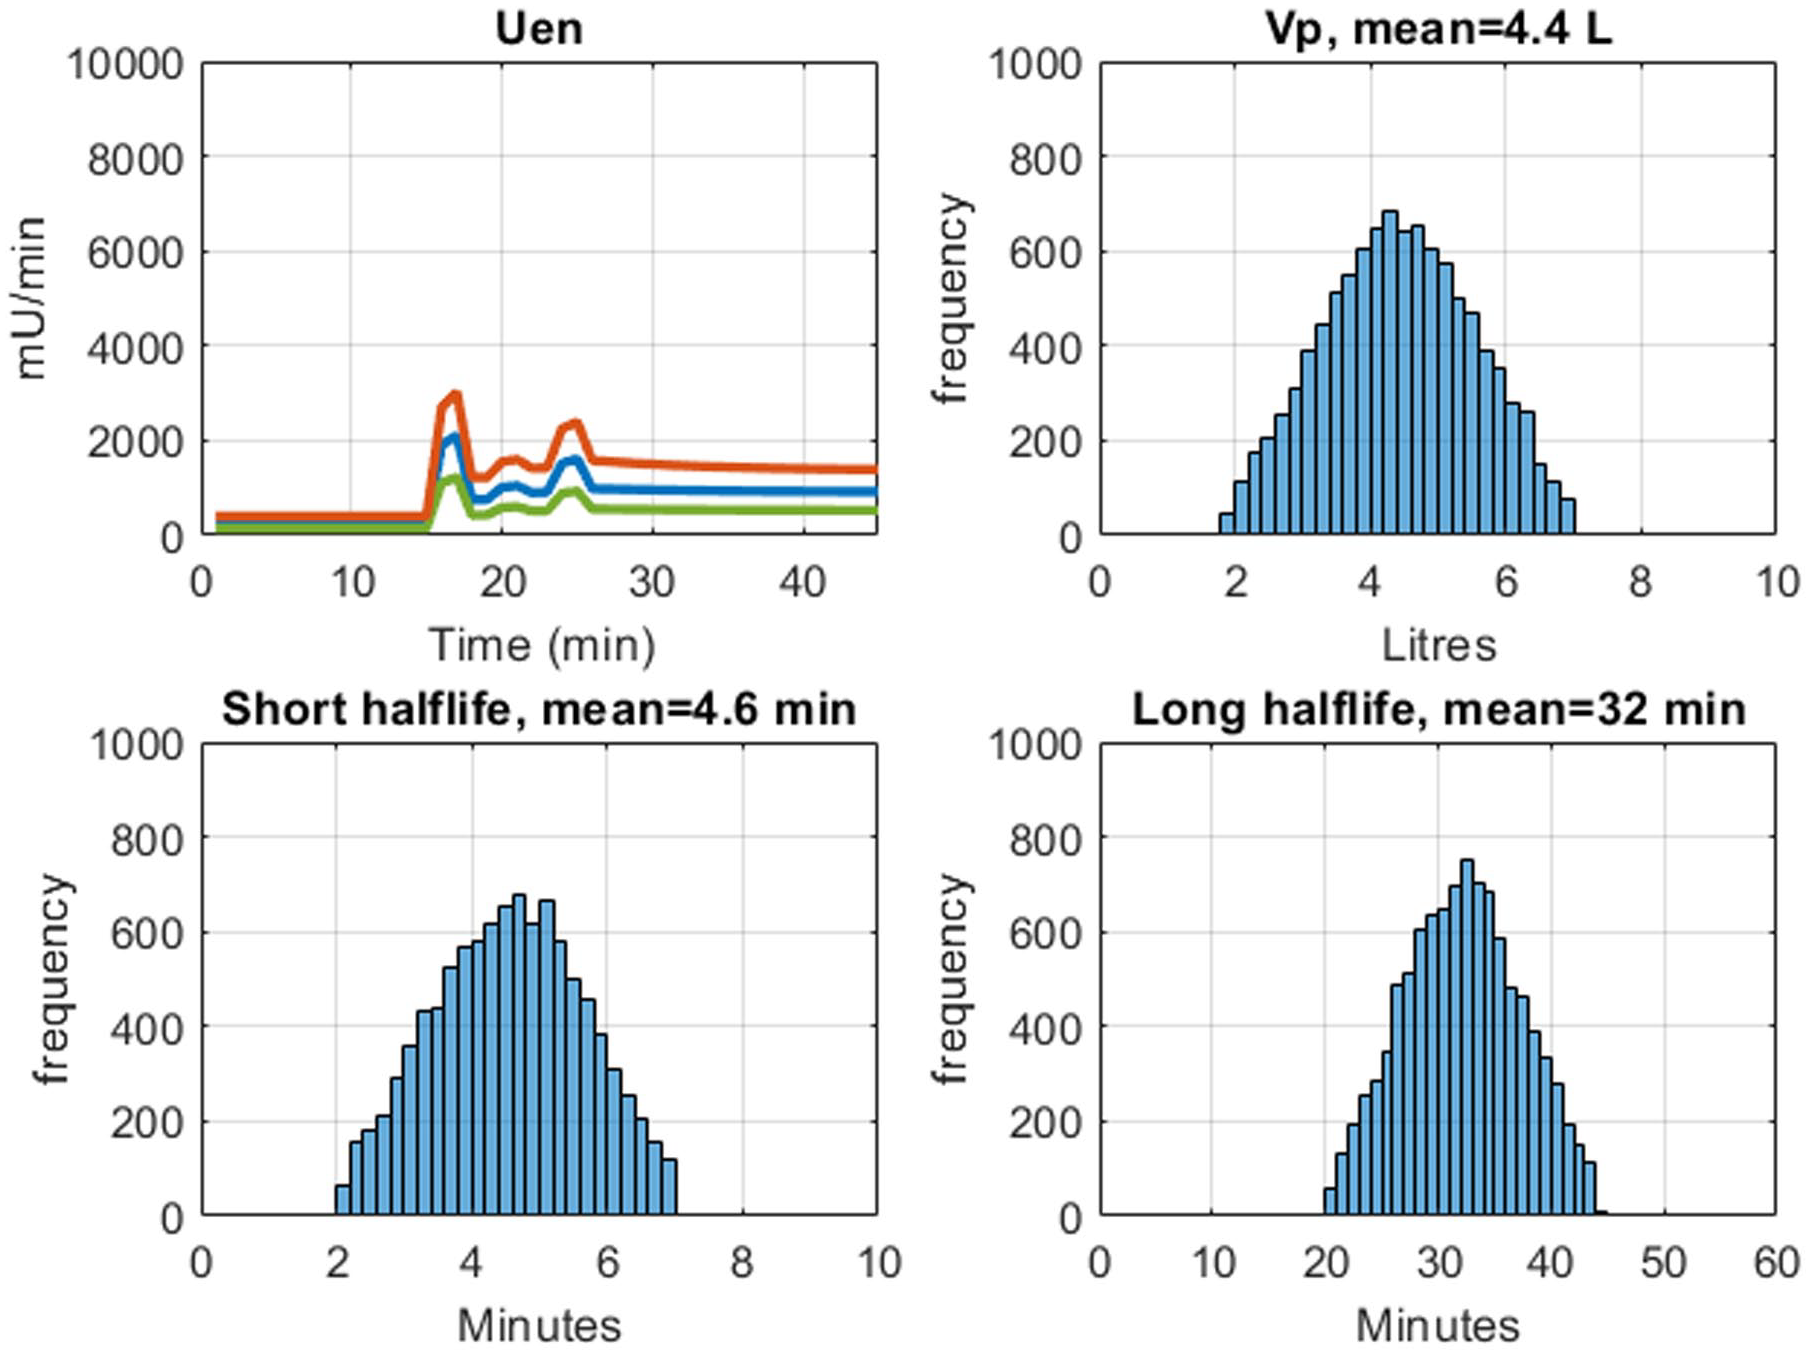
Insulin secretion profile variation resulting from kinetic parameter variation for Subject B, who displays a blunted 2-Phase insulin secretion response. Range of insulin secretion (95th percentile, median, and 5th percentile) shown in top left. Histograms showing the truncated normal distribution of Vp, short half-life, and long half-life.
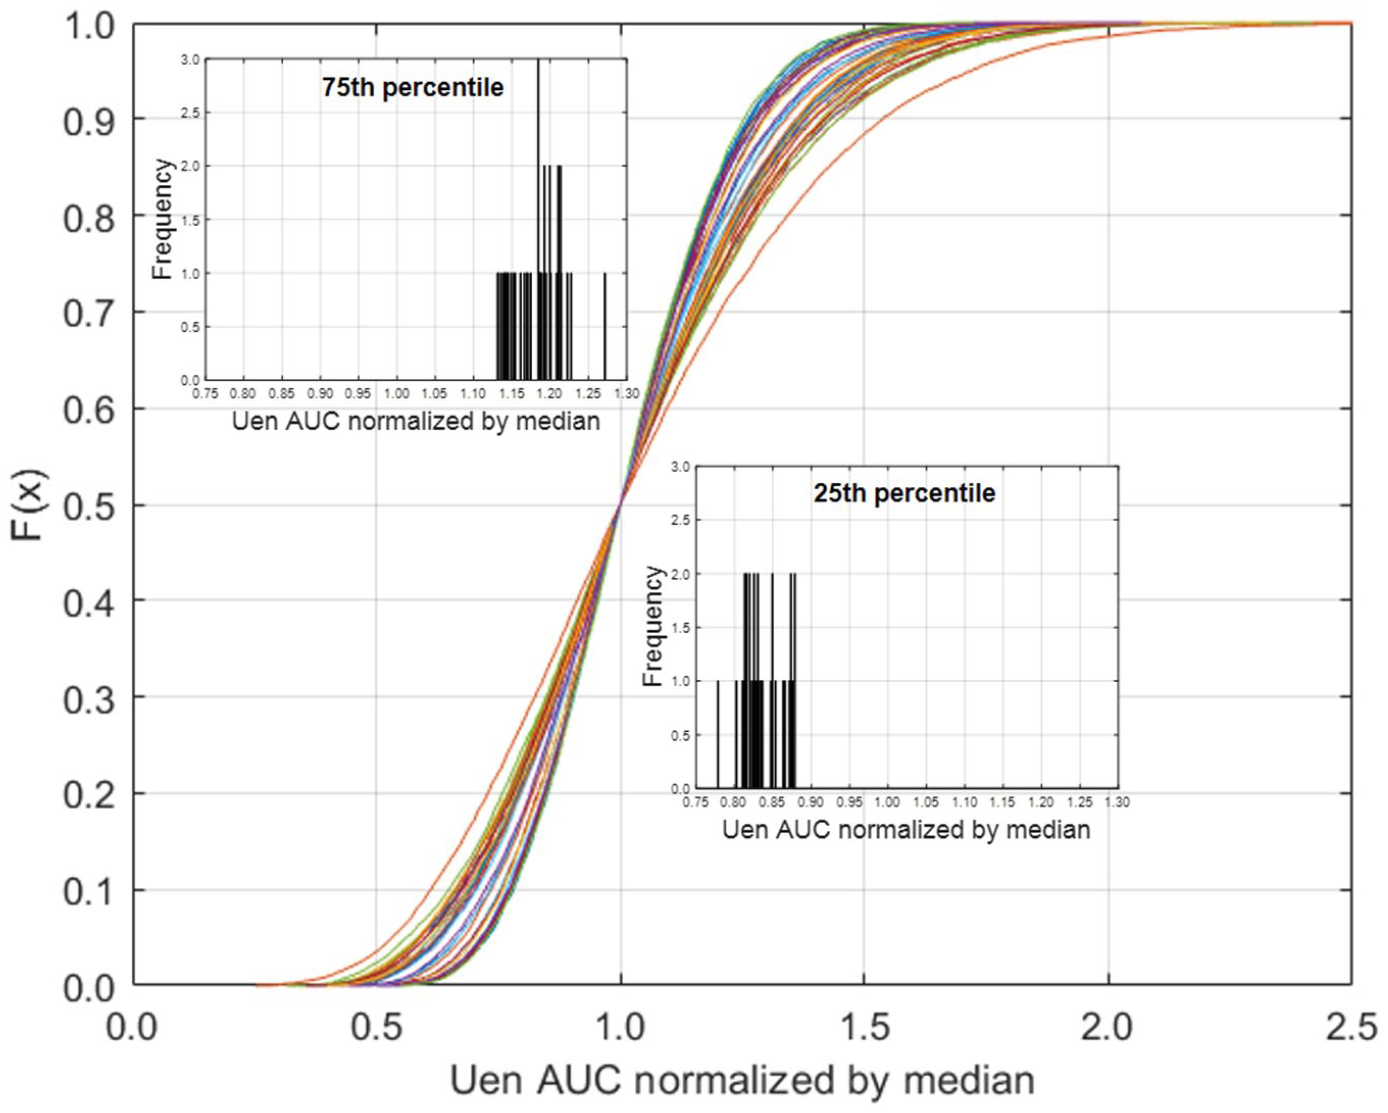
AUC Total for each subject is plotted as a CDF in Figure 5 for the N = 10 000 Monte Carlo iterations generating a CDF for each subject. Total AUC per subject ranged from 2,671 mU to 13,435 mU, with median 5,511 mU. Many of the subjects have a steep gradient in their CDF indicating little variation in overall secretion when the Van Cauter parameters are varied. Some subjects on the far right of the CDF curves show more variation (Figure 5).
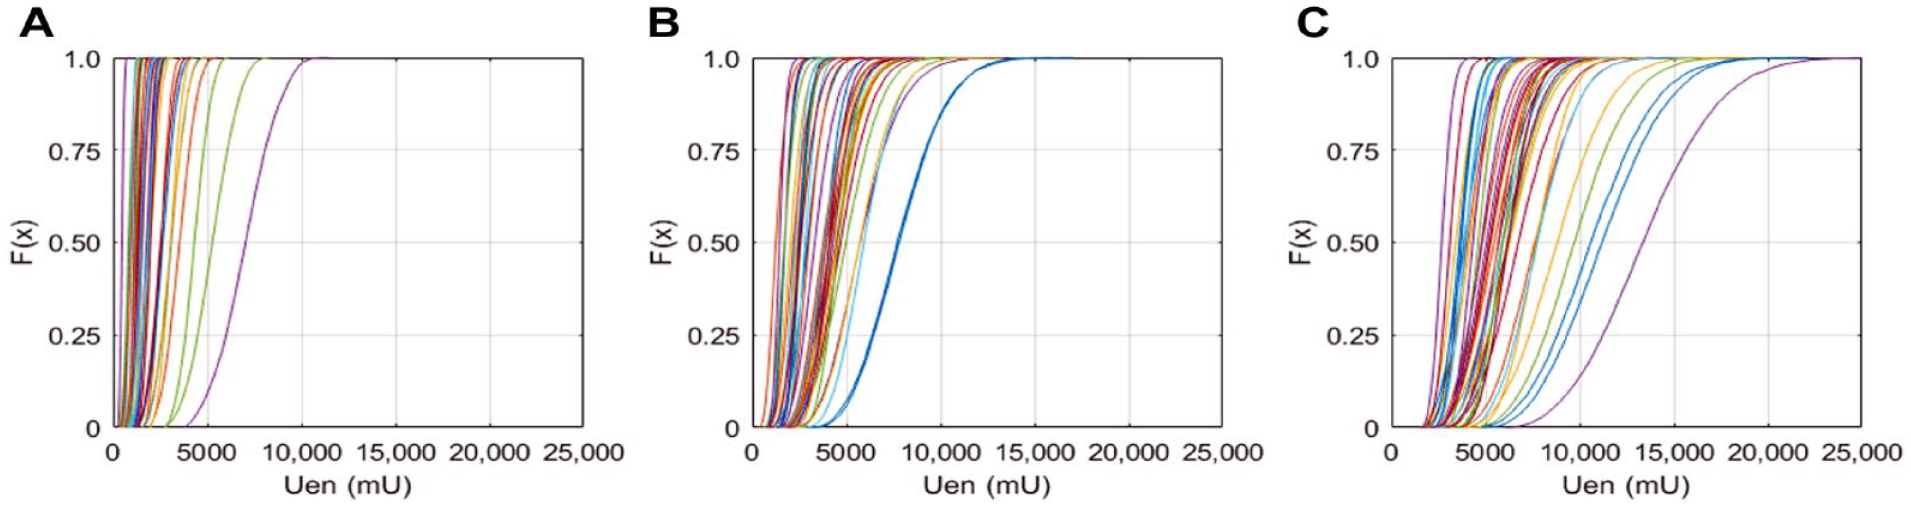
Cumulative distribution of area under the curve (AUC) for total endogenous insulin secretion (Uen) is shown for 39 patients (A) Phase 1 secretion; (B) Phase 2 secretion; and (C) Total Uen secretion.
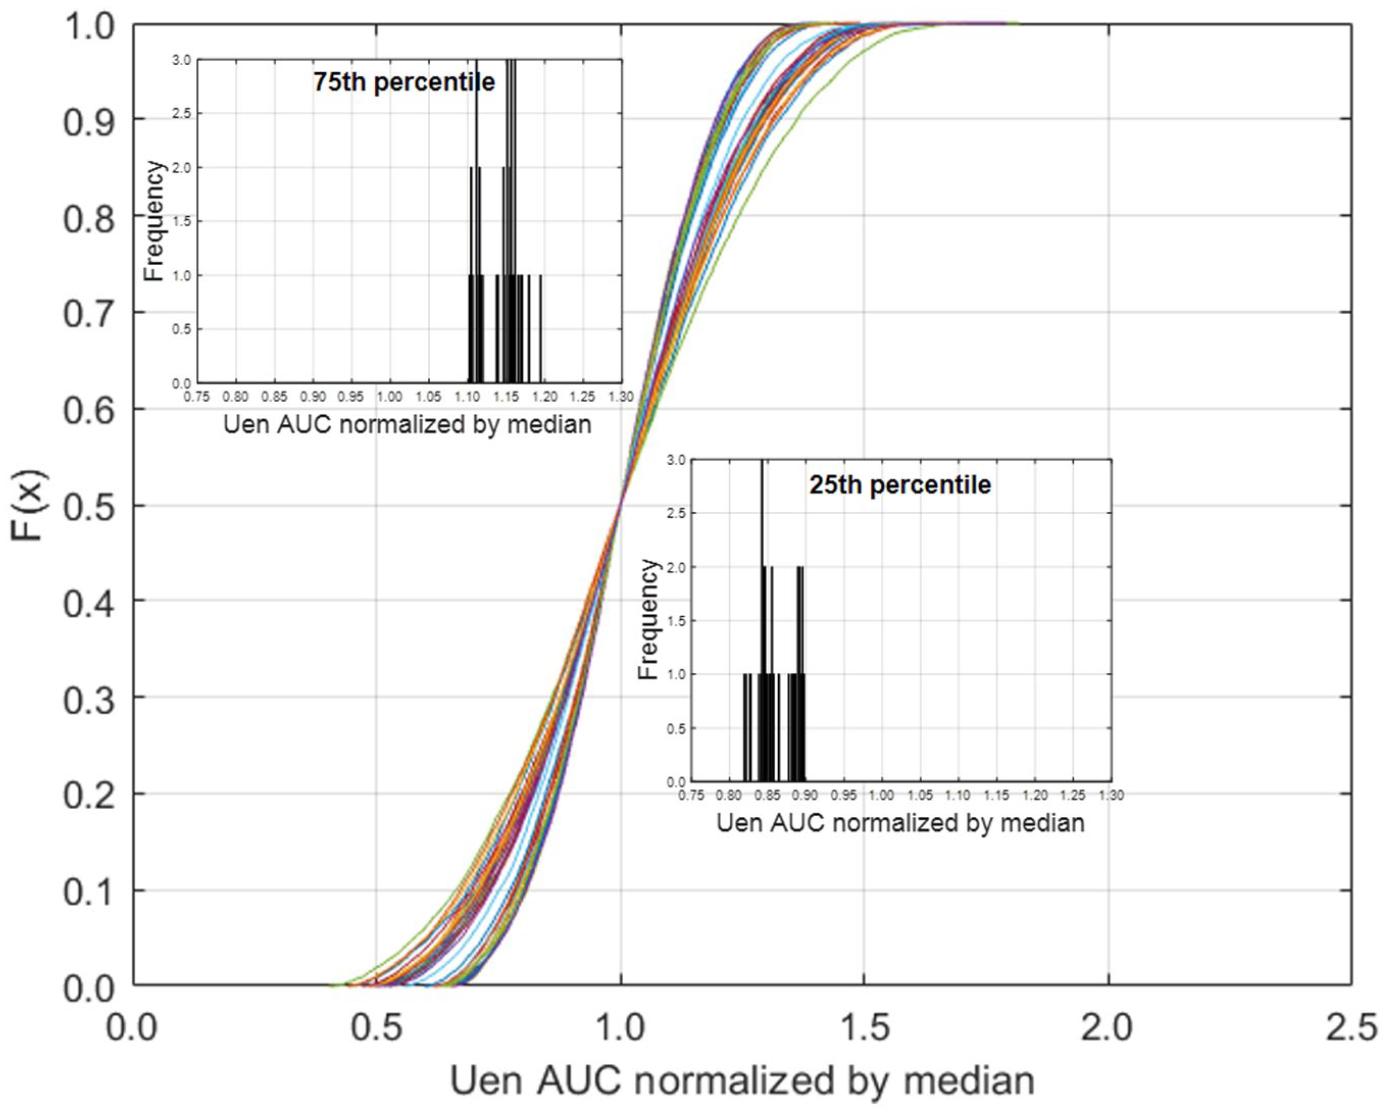
AUC was normalized by the median value for individual subjects, Phase 1 AUC is shown in Figure 6, Phase 2 AUC is shown in Figure 7, and Total AUC is shown in Figure 8. There are two distinct slopes in the data, determined by BMI. The short half-life parameter is determined by BMI and diabetes status, and changes in BMI are also reflected in BSA and this parameter is used to calculate Vp (Equation 8). The steeper gradient CDF’s are associated with subjects with BMI ≤ 30 kg/m2, and the more gradual gradient CDF’s are subjects with a BMI > 30. The normalized per subject interquartile range for total endogenous insulin secretion is shown as a function of BMI in Figure 9, where higher BMI subjects have a larger interquartile range and there is a demarcated separation at BMI 30 kg/m2.
Cumulative distribution of area under the curve (AUC) of Phase 1 endogenous insulin secretion (Uen) normalized by the median value.
Cumulative distribution of area under the curve (AUC) of Phase 2 endogenous insulin secretion (Uen) normalized by the median value.
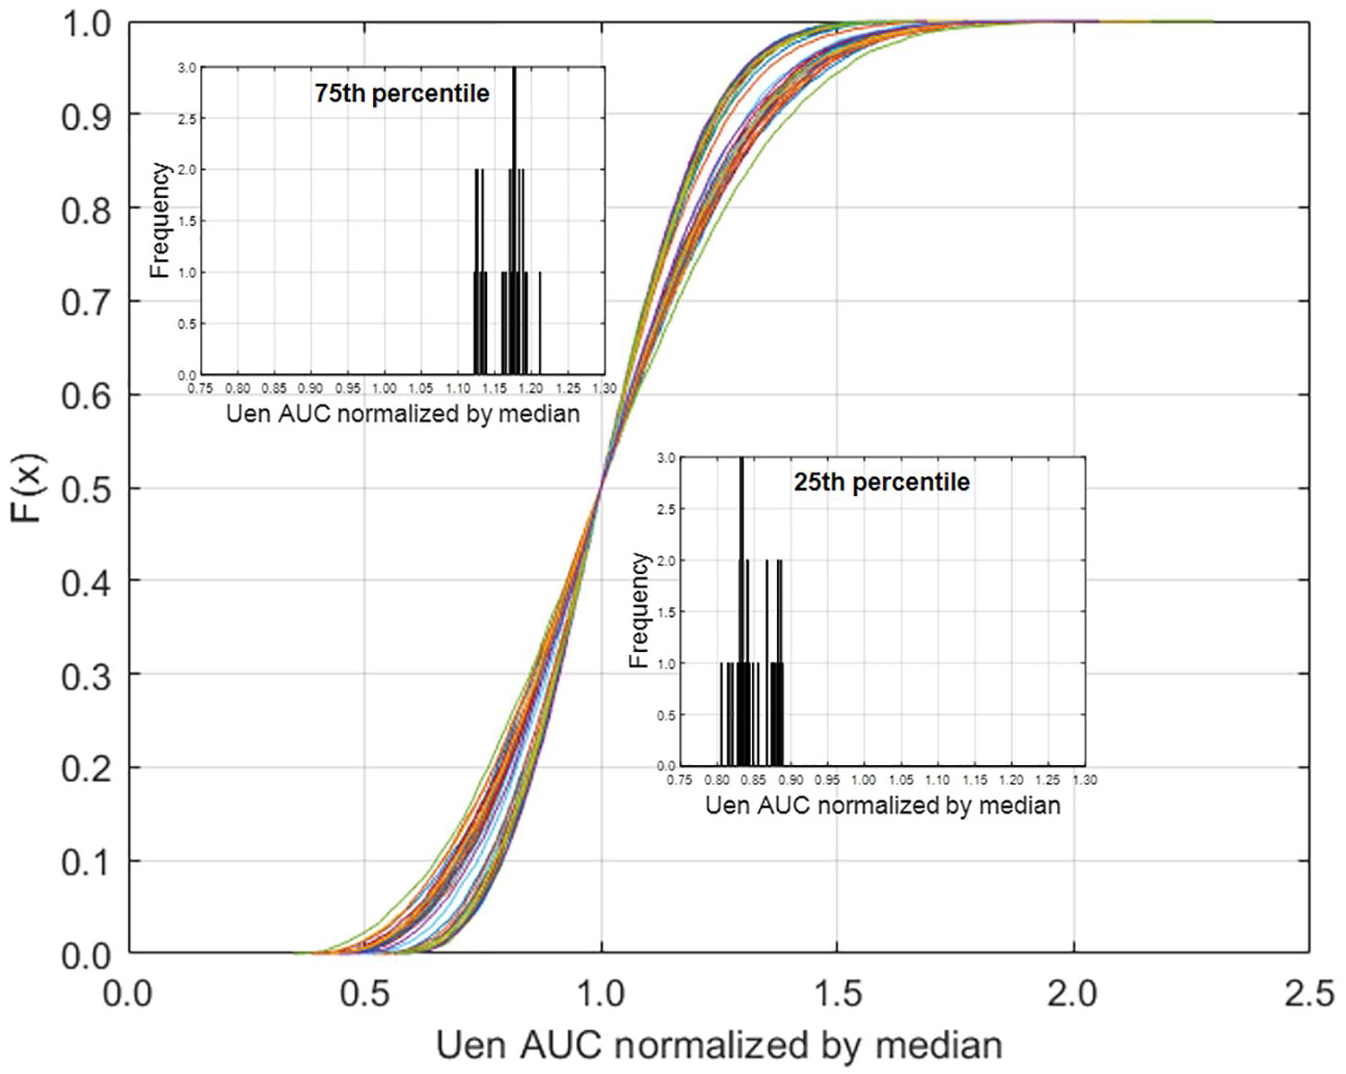
Cumulative distribution of area under the curve (AUC) of total endogenous insulin normalized by the median value.
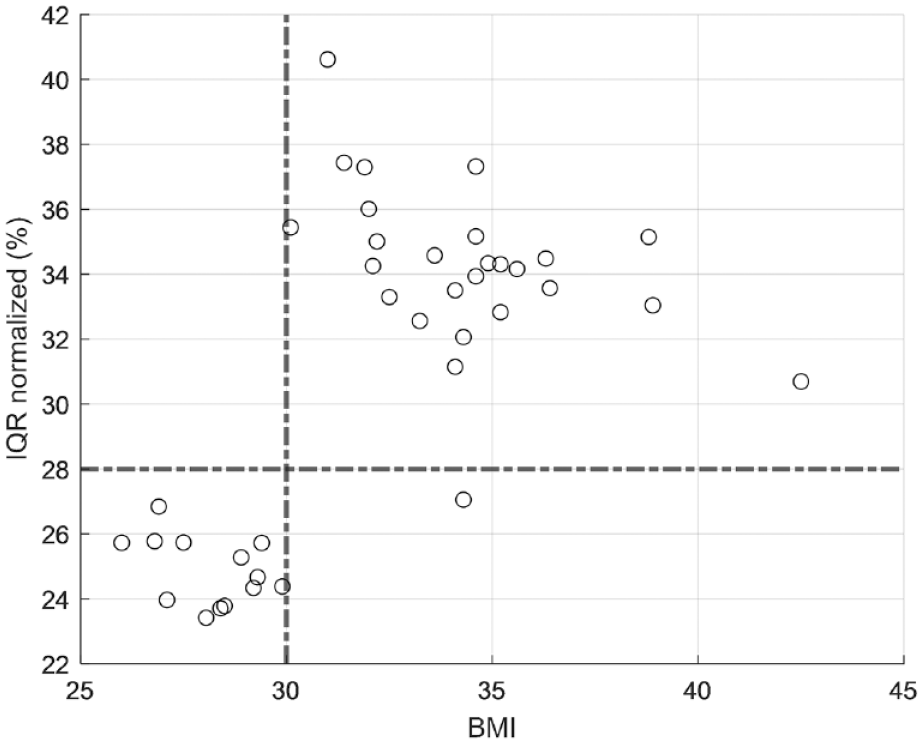
Normalized interquartile range (IQR) as a function of BMI.
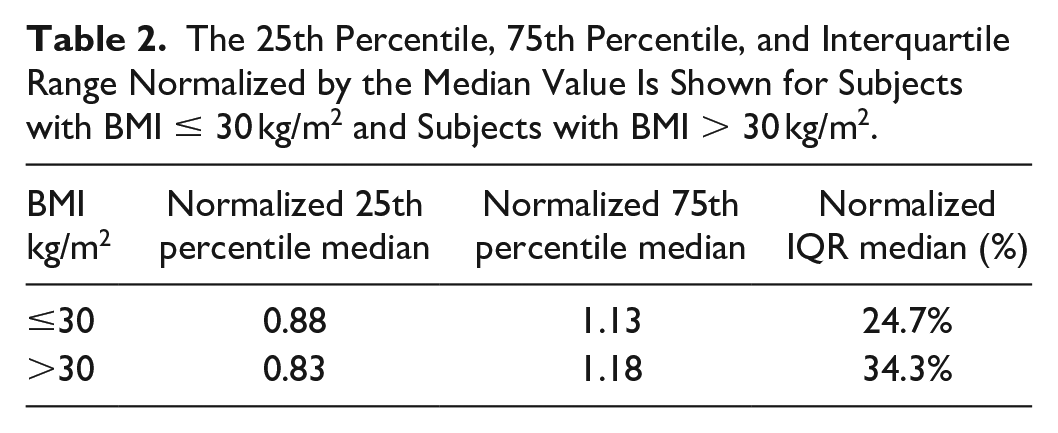
Table 2 shows the total estimated plasma insulin secretion normalized by the median value and grouped by BMI value. The interquartile range is ~10% larger for subjects with a BMI > 30 kg/m2. For subjects with a BMI ≤ 30 kg/m2, estimated Uen would be expected to vary −12% to +13% from the median, and for those with BMI > 30 kg/m2, Uen varies from −17% to +18% from the median value in the interquartile range.
The 25th Percentile, 75th Percentile, and Interquartile Range Normalized by the Median Value Is Shown for Subjects with BMI ≤ 30 kg/m2 and Subjects with BMI > 30 kg/m2.
Discussion
Summary
Parameterization from Van Cauter et al. 15 was used to calculate estimated insulin secretion using the two-compartment model from Eaton. 14 C-peptide measurements from 39 healthy male participants of an FS-IVGTT were used and a Monte Carlo analysis was done to determine the expected range of estimated insulin secretion. It was shown plasma volume (Vp) has the largest effect on modelled insulin secretion estimates and subjects with a BMI > 30 kg/m2 have larger variation than subjects with BMI ≤ 30 kg/m2 (Figure 9). Overall, the modelled insulin secretion estimates can vary by about ±15% (Figures 6-8; Table 2). In particular, subjects with a BMI > 30 kg/m2 have an interquartile range of 34.3% compared to 24.7% in subjects with a BMI ≤ 30 kg/m2, a significant change in variability.
Phase 1 insulin secretion is calculated from t = 15 minutes to t = 18 minutes, inclusive (4 minute duration), and Phase 2 insulin secretion is calculated from t = 19 minutes to t = 47 minutes (28 minute duration). The modelled insulin secretion response has two basic curve shapes, a typical healthy response, and a blunted response associated with endocrine dysfunction. The typical healthy response has high Phase 1 secretion and minimal Phase 2 secretion (Figure 3) as the insulin is secreted in response to the glucose bolus with a quick return to glucose homeostasis, indicating insulin is secreted in required amounts and insulin sensitivity is physiologically sufficient. A blunted Phase 1 insulin secretion response and high Phase 2 (Figure 4) are associated with insulin resistance or pancreatic exhaustion. High glucose levels are maintained because the pancreas cannot secrete enough insulin, or because the subject is resistant to insulin.
Comparison to Van Cauter
Van Cauter et al. showed there was a 10%-12% variation in insulin secretion using standard parameters instead of individual parameters across the cohort 15 with the two compartment model, which is similar to the variability found in this study. Same subject variability in Van Cauter et al. averaged 11% variation when parametrization was done twice (range 4.1%-23.2%) 15 showing humans are horribly variable. 20 The volume of distribution, Vp, was correlated with BSA and the correlation was stronger in men than in women. It has been shown plasma volume does not change with age. 21
Plasma volume is determined from BSA and an empirically derived correlation (Equation 8). Vp has the largest effect on the estimate of Uen because it is directly multiplicative to the Uen estimate. As can be seen in Table 1, Vp is greater for obese subjects rather than normal BMI subjects, and it should also be noted that the standard deviation is much greater for obese subjects, 1.27 L compared to 0.83 L for normal BMI subjects. The greater variation in plasma volume estimates for obese subjects causes the modelled insulin secretion estimates to also be more variable. Better estimates of plasma volume would be the most effective way to improve modelled insulin secretion estimates and should be considered in future studies.
The short half-life parameter, hf1, has three values in the Van Cauter parameterization (Equation 9), one for normal weight, one for obese, and one for people with non-insulin dependent diabetes. 15 The short half-life determines the kinetic parameters and the discretized nature of the value, based on BMI, affects the estimated insulin secretion output as shown in Figures 6 and 8, resulting in a bimodal CDF. As shown in Figure 9, there is a breakpoint at BMI 30 kg/m2 where the interquartile range increases for subjects with a large BMI. This increase in the interquartile range is also due, in part, to the increase in standard deviation of Vp for obese subjects. The long half-life is determined by age and, as shown in Figure 2, does not greatly affect the Uen estimate.
Limitations
This analysis was performed as a sub-analysis of a larger study examining genetic contributions to diabetes in a particularly affected New Zealand cohort. Insulin secretion magnitudes are similar to those published elsewhere,22,23 thus the analysis on model-variability is expected to translate to broader cohorts.
The range of Vp, hf1, and hf2 was limited to two standard deviations and a normal distribution was generated within this range for the N = 10 000 Monte Carlo iterations. Sometimes the two standard deviation range included values unlikely to be clinically relevant. For example, in Figure 4 the lower value for Vp is ~2 L, much lower than would be expected, 24 especially for an individual with higher BMI, implying non-normal underlying distributions in the original analysis by. 15 Using the two standard deviation range provides a more conservative and realistic estimated insulin secretion range, based on realistic parameterization of plasma and half-lives.
It should be noted that no covariance of the parameters was included and the insulin secretion variation includes all combinations within the determined ranges of the parameters, even those that would be unlikely to occur. No known trends or relationships in co-variance of parameters is reported or assumed in the original model 14 and so the results in this analysis represent the most conservative case. If covariance was included, and un-physiological parameter value combinations were excluded, if they exist, the insulin secretion variation would likely decrease.
The cohort in this study is male and of NZ Māori and Pacific peoples ancestry with higher than average BMI. Van Cauter parameterization uses a different Vp calculation for women, although it was noted the differences in plasma distribution between male and female subjects was due mostly to differences in body weight, and not solely biological sex. 15 The cohort in this study is of Polynesian ancestry and it has been shown that Polynesians have higher bone and muscle mass for a given BMI, 25 and may affect use of the standardized equation. It has been previously shown insulin secretion may vary between sexes in infants, 26 and in adults differences in insulin sensitivity are seen in intensive care patients, 27 implying a degree of sex-specific metabolic variability. Use of an alternative Vp calculation in this all male and larger BMI cohort may be of interest.
Insulin secretion model variability is most affected by plasma volume and improvement in estimation of this parameter would have the most effect at reducing variability in the model outputs. Plasma volume estimates are more variable for individuals with a BMI > 30 kg/m2, making insulin secretion estimates more variable for these individuals as well.
Modelling Implication
Model-based analyses which use C-peptide measurements to determine endogenous insulin secretion or to derive non-physiological insulin kinetics parameters should consider the inherent variability in the insulin secretion estimates in any outputs from the model. The modelled insulin secretion estimates may be used for other glucose-insulin dynamic metrics, such as insulin sensitivity (SI). When SI is measured in this way, variability in the calculated SI should be recognized when interpreting model output. Equally, when insulin assays are available, SI may be unaffected if the insulin data is fit well, but non-physiological or uncertain insulin kinetics parameters could significantly affect prediction of response in clinical uses with exogenous and endogenous insulin for glycemic control or management.28-30
Clinical Implication
This analysis investigates the expected range of estimated insulin secretion from C-peptide measurements using the standard and well-accepted Van Cauter et al. parameterization. The use of plasma C-peptide instead of plasma insulin is advantageous because C-peptide is not metabolized in the liver nor used in glucose uptake, both of which can vary significantly. When this method is used clinically, the variability in estimated insulin secretion quantified in this analysis should be considered when applying diagnostic thresholds to insulin secretion using this method. 31 The increased variability in insulin secretion estimates for individuals with BMI > 30 kg/m2 should also be considered.
Conclusion
Overall, the modelled insulin secretion estimates from C-peptide measurements can vary by about ±15%. Larger variation is found in subjects with a BMI > 30 kg/m2, where the interquartile range is 34.3% compared to subjects with a BMI ≤ 30 kg/m2 where the interquartile range is 24.7%. The variation should be considered when applying this insulin secretion estimation method to clinical diagnostic thresholds and interpretation of model-based analyses such as insulin sensitivity.
Footnotes
Abbreviations
AUC, area under curve; BG, blood glucose; CDF, cumulative distribution function; FS-IVGTT, frequently sampled, intravenous glucose tolerance test; SI, insulin sensitivity.
Declaration of Conflicting Interests
The author(s) declared no potential conflicts of interest with respect to the research, authorship, and/or publication of this article.
Funding
The author(s) disclosed receipt of the following financial support for the research, authorship, and/or publication of this article: The authors are supported by New Zealand National Science for Technology & Innovation Challenge [#CRS-53-2019] and MedTech Core [TEC, #370571]. The following lists the funders of Clinical Trial: The Auckland Medical Research Foundation (AMRF), the Health Research Council (HRC) and the Maurice Wilkins Center (MWC). TLM is supported by a Rutherford Discovery Fellowship.