
Abstract
Background:
Physiological models that are used with dynamic test data to assess insulin sensitivity (SI) assume that the metabolic target glucose concentration (GTARGET) is equal to fasting glucose concentration (G0). However, recent research has implied that irregularities in G0 in diabetes may cause erroneous SI values. This study quantifies the magnitude of these errors.
Methods:
A clinically validated insulin/glucose model was used to calculate SI with the standard fasting assumption (SFA) G0 = GTARGET. Then GTARGET was treated as a variable in a second analysis (VGT). The outcomes were contrasted across twelve participants with established type 2 diabetes mellitus that were recruited to take part in a 24-week dietary intervention. Participants underwent three insulin-modified intravenous glucose tolerance tests (IM-IVGTT) at 0, 12, and 24 weeks.
Results:
SIVGT had a median value of 3.36×10⁻⁴ L·mU−1·min−1 (IQR: 2.30 – 4.95×10⁻⁴) and were significantly lower (P < .05) than the median SISFA (6.38×10⁻⁴ L·mU−1·min−1, IQR: 4.87 – 9.39×10⁻⁴). The VGT approach generally yielded lower SI values in line with expected participant physiology and more effectively tracked changes in participant state over the 24-week trial. Calculated GTARGET values were significantly lower than G0 values (median GTARGET = 5.48 vs G0 = 7.16 mmol·L−1 P < .001) and were notably higher in individuals with longer term diabetes.
Conclusions:
Typical modeling approaches can overestimate SI when GTARGET does not equal G0. Hence, calculating GTARGET may enable more precise SI measurements in individuals with type 2 diabetes, and could imply a dysfunction in diabetic metabolism.
Keywords
Type 2 diabetes is a chronic disease characterized by dysfunction in glycemic regulation, including insulin resistance (IR),1,2 hyperinsulin secretion, 3 hypoinsulin secretion, 3 altered hepatic glucose balance,4,5 hyperglycemia, hyperinsulinemia, and hypoinsulinemia.6,7 IR is a condition in which the circulating insulin is less effective in lower plasma glucose levels. If IR is very high, postprandial glucose levels become elevated for prolonged periods before returning to healthy levels. Some studies have noted that glucose levels continue to decline for up to 24 hours in individuals with type 2 diabetes.8,9 Hence, in contrast to healthy individuals, the glucose levels measured after an overnight fast may not be indicative of the metabolic target glucose levels of individuals with type 2 diabetes.
Several test protocols and mathematical modeling strategies have been developed to quantify key elements of dysfunction in type 2 diabetes.10-12 The dynamic insulin sensitivity and secretion test (DISST) is a low intensity alternative to the insulin-modified intravenous glucose tolerance test (IM-IVGTT). 13 The DISST insulin sensitivity metric (SI) is well correlated to the euglycemic hyperinsulinemic clamp ISI (R = 0.82) and produced repeatable endogenous insulin secretion metrics in a nondiabetic cohort.12-15 However, the DISST model was developed to distinguish between healthy and prediabetes states and was not tested thoroughly in individuals with established diabetes.
Like most model-based assessments of SI,16-19 the typical DISST model approach uses the participant’s first glucose measurement (G0) as the glucose concentration that the model will theoretically reach at equilibrium (GTARGET, GTARGET = G(
Methodology
Participants
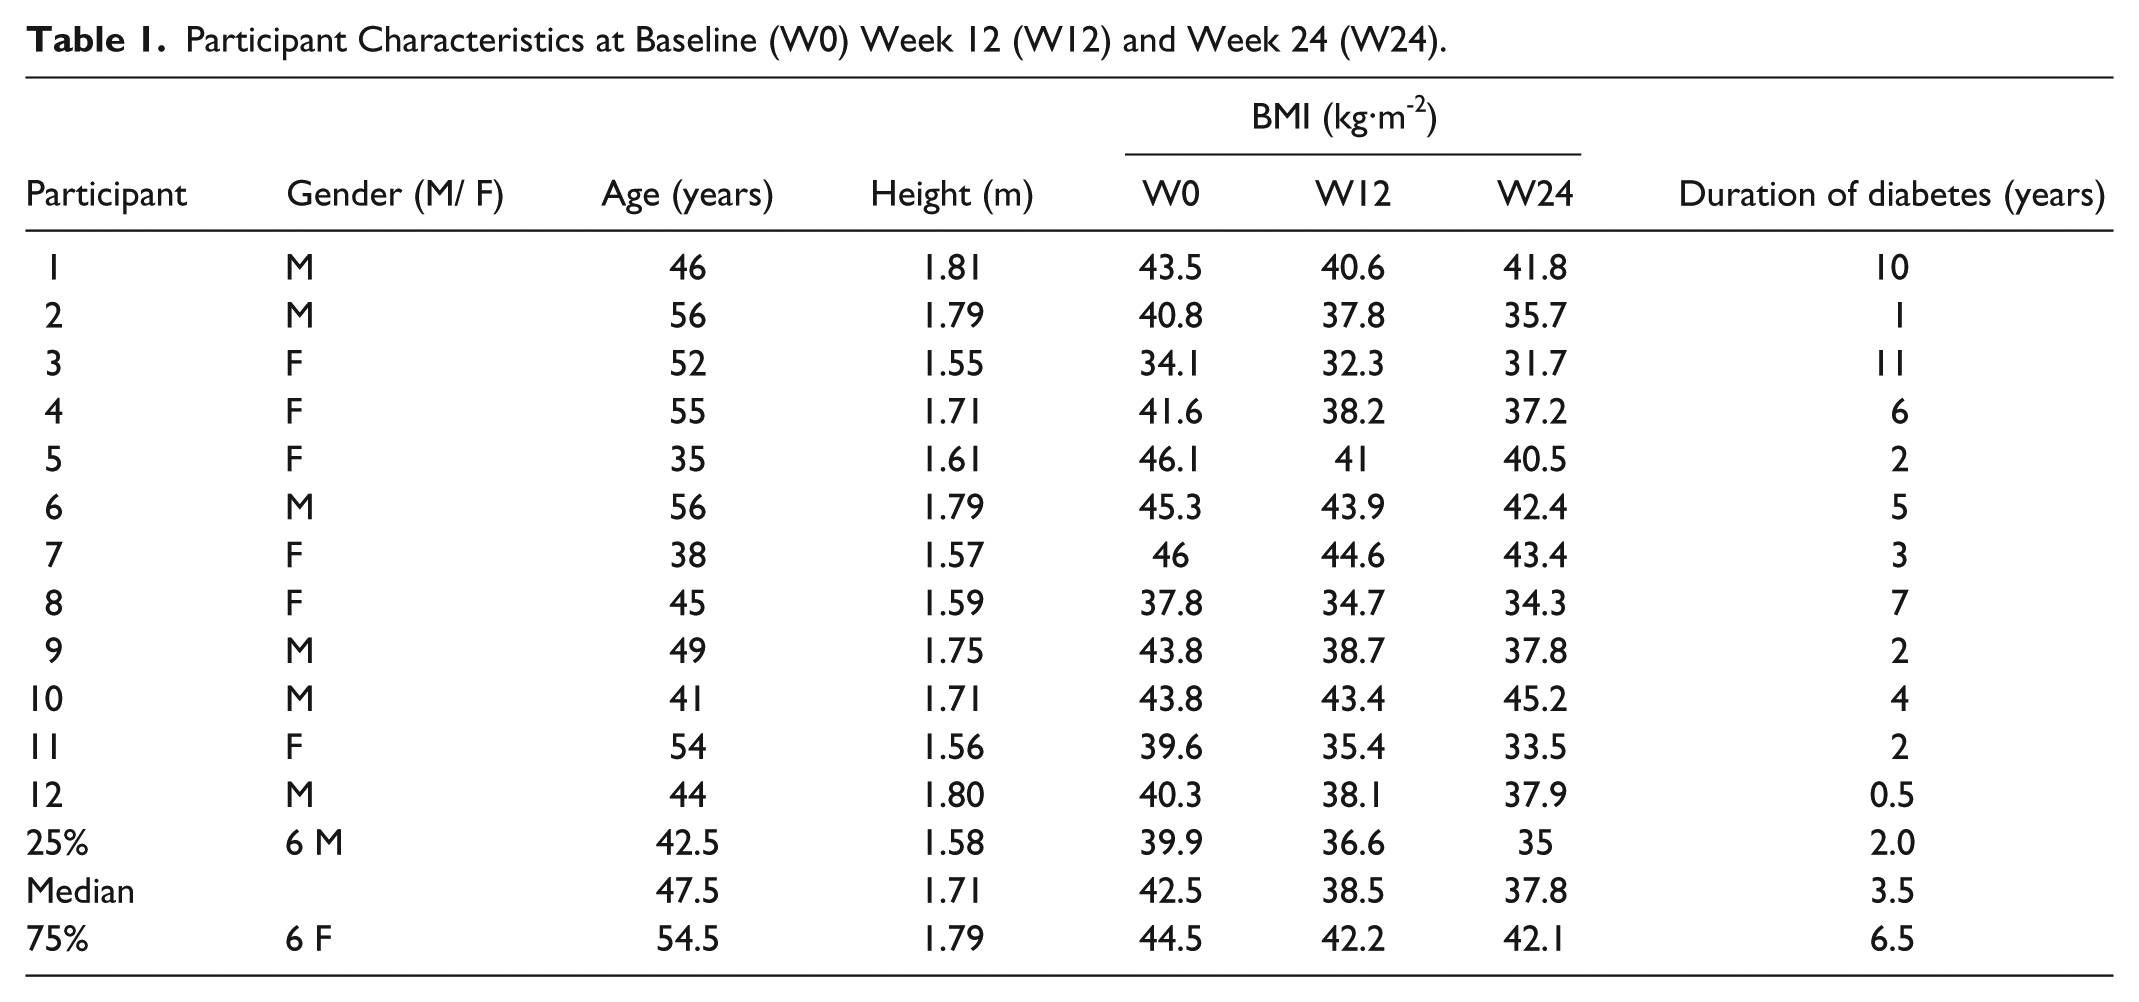
Fourteen individuals with established type 2 diabetes mellitus were recruited from the Wellington region of New Zealand to take part in an Atkins-based low carbohydrate dietary intervention study. Participants were aged between 30 and 65 with a body mass index (BMI) range of 34 to 46 kg·m−2. Participants were excluded if they had major physiological or psychological illness at the time of testing. Pregnant or lactating females were also excluded. Two participants discontinued the intervention, the first citing personal reasons, and the second left the study due to exacerbation of a renal stone. Twelve participants completed the study. Table 1 shows the height, age, and BMI of these 12 individuals. Full demographic details and results of the intervention study have been previously described by Krebs et al. 21 Ethical approval for this study was provided by the New Zealand Ministry of Health, Central Regional Ethics Committee.
Participant Characteristics at Baseline (W0) Week 12 (W12) and Week 24 (W24).
Clinical Procedure
The clinical protocol in this study was similar to the protocol defined by Ward et al. 22 All procedures were started at the morning after an overnight fast. A 0.2 g/kg glucose bolus was administered at t = 1 minute and then an infusion of insulin that was intended to replicate the insulinemic response of a normoglycemic individual was administered. An insulin infusion was started at t = 2 minutes at a rate of 3.5 mU/kg/min and was reduced to 0.5 mU/kg/min at t = 7 minutes. Further reductions to 0.25 mU/kg/min, occurred at t = 17 minutes, and to 0.1 mU/kg/min at t = 50 minutes, respectively. The infusion of 0.1mU/kg/min was maintained for the remainder of the procedure. Venous blood samples were taken into fluoride oxalate tubes at times: t = −10, −5, −1, 0, 1, 2, 3, 4, 5, 6, 8, 10, 12.5, 15, 20, 25, 30, 35, 40, 50, 60, 70, 80, 90, 100, 120, 140, 160, 180, 210, 240, 270, and 300 minutes. Blood samples were assayed for glucose and insulin concentration using standard commercial assays (Roche Diagnostics, New Zealand) at an accredited laboratory (Diabetes and Lipid Laboratory, University of Otago, Dunedin, New Zealand).
Dynamic Insulin Sensitivity and Secretion Test (DISST) Model
This analysis used the DISST model of interstitial insulin kinetics and glucose dynamics:12-15,23


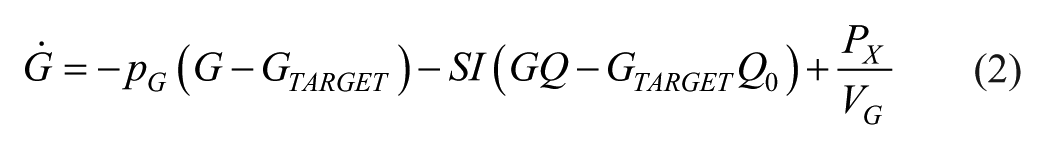
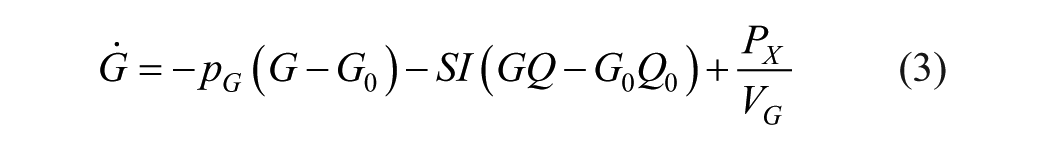

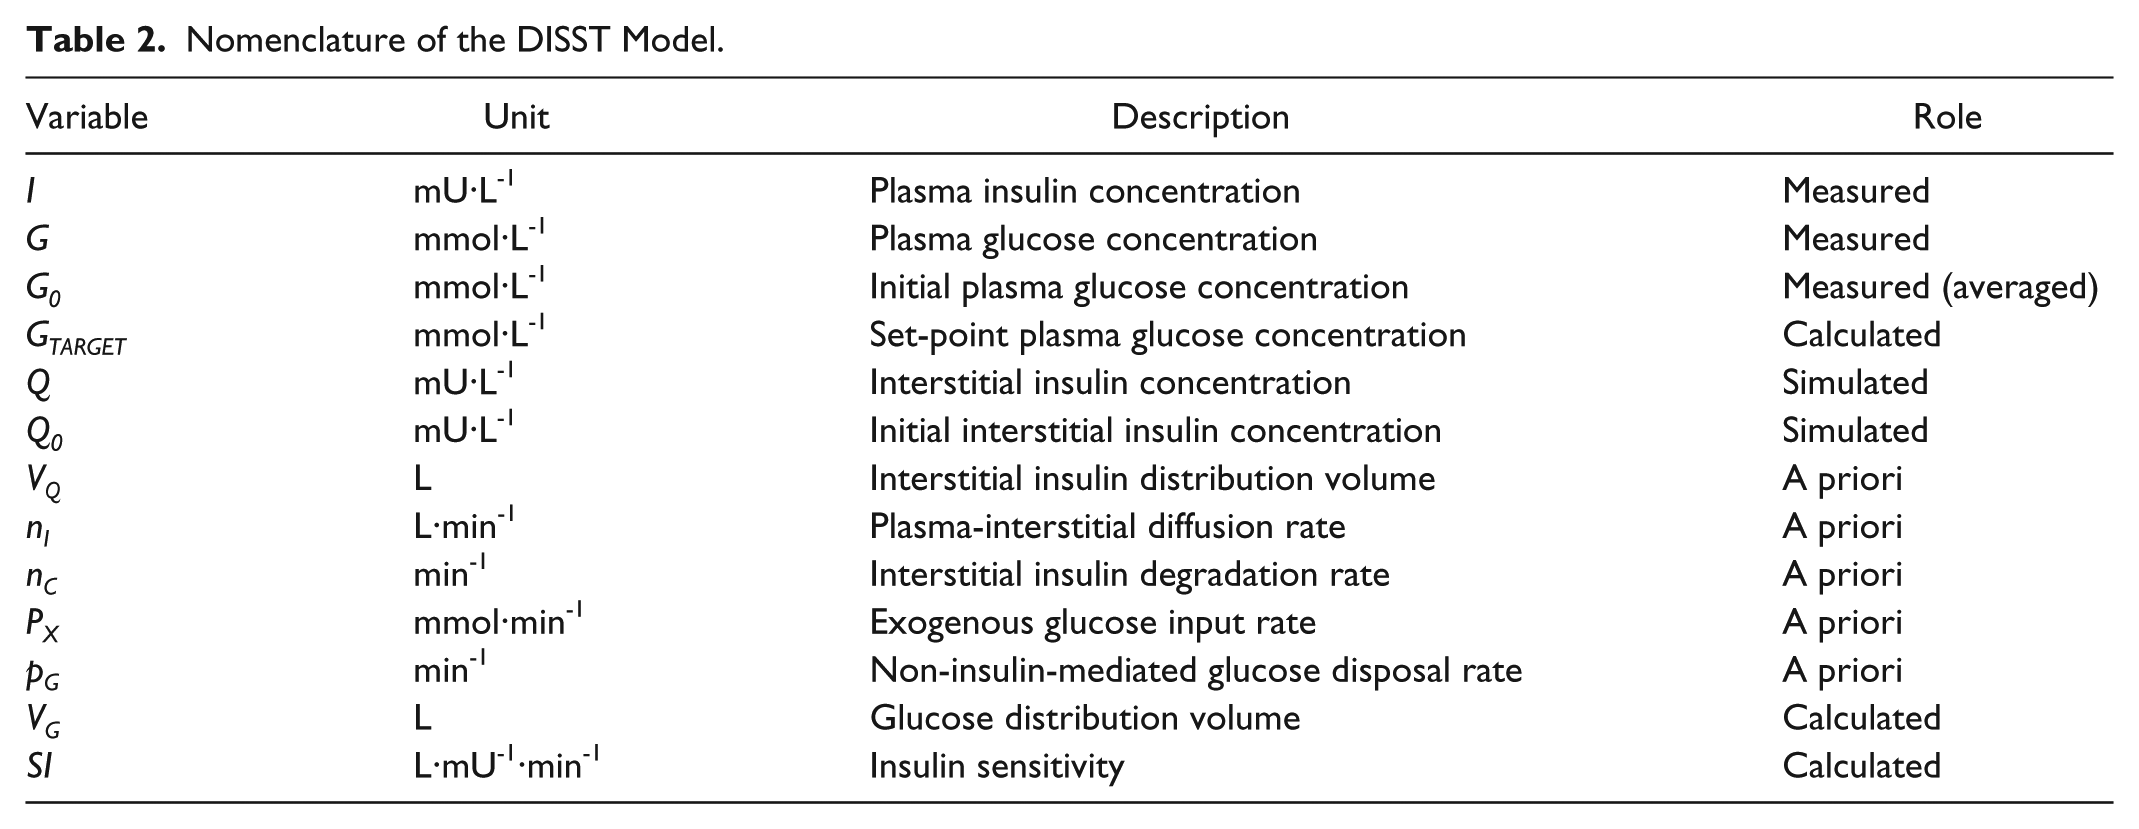
where equation nomenclature is shown in Table 2.
Nomenclature of the DISST Model.
Modeling Approaches
Two models were fit to the measured glucose and insulin data. Both models used the DISST model from equations 1-3. However, the models differ in their interpretation of the target glucose level. The models are named:
SFA: Standard fasting assumption
VGT: Variable glucose target
The SFA model conforms to the typical assumption that GTARGET = G0 and defines SI and VG as model variables.13,14 The VGT model captures the potential variability in GTARGET by calculating SI, VG and GTARGET in concert. Hence, the SFA has two model variables and the VGT has three model variables. The DISST model defines nC, nI and pG as a priori functions of anatomical data.12-14,23 The SFA and GFT model were both tested for identifiability using the methods of Baker et al,
24
showing the model remains structurally identifiable, which is further confirmed by the fact that the additional dynamic is observable and well captured by this identified parameter. Calculation of the model variables was undertaken using the Gauss Newton model optimization method.
25
Initial values were
Analysis
The distributions of SI, G0, and GTARGET values were compared across the SFA and VGT models using the signed rank sum (Prs) and Kolmogorov-Smirnov (Pks) tests. The signed rank sum test compares the specific participant matched SI results from the SFA and VGT models. The Kolmogorov-Smirnov test is sensitive to differences in both location and shape of the empirical cumulative distribution functions of SI distributions from the two approaches. A P value < .05 was considered significant. All analysis was undertaken using MATLAB (R2013b, Mathworks, Inc, Natick, MA, USA).
Results
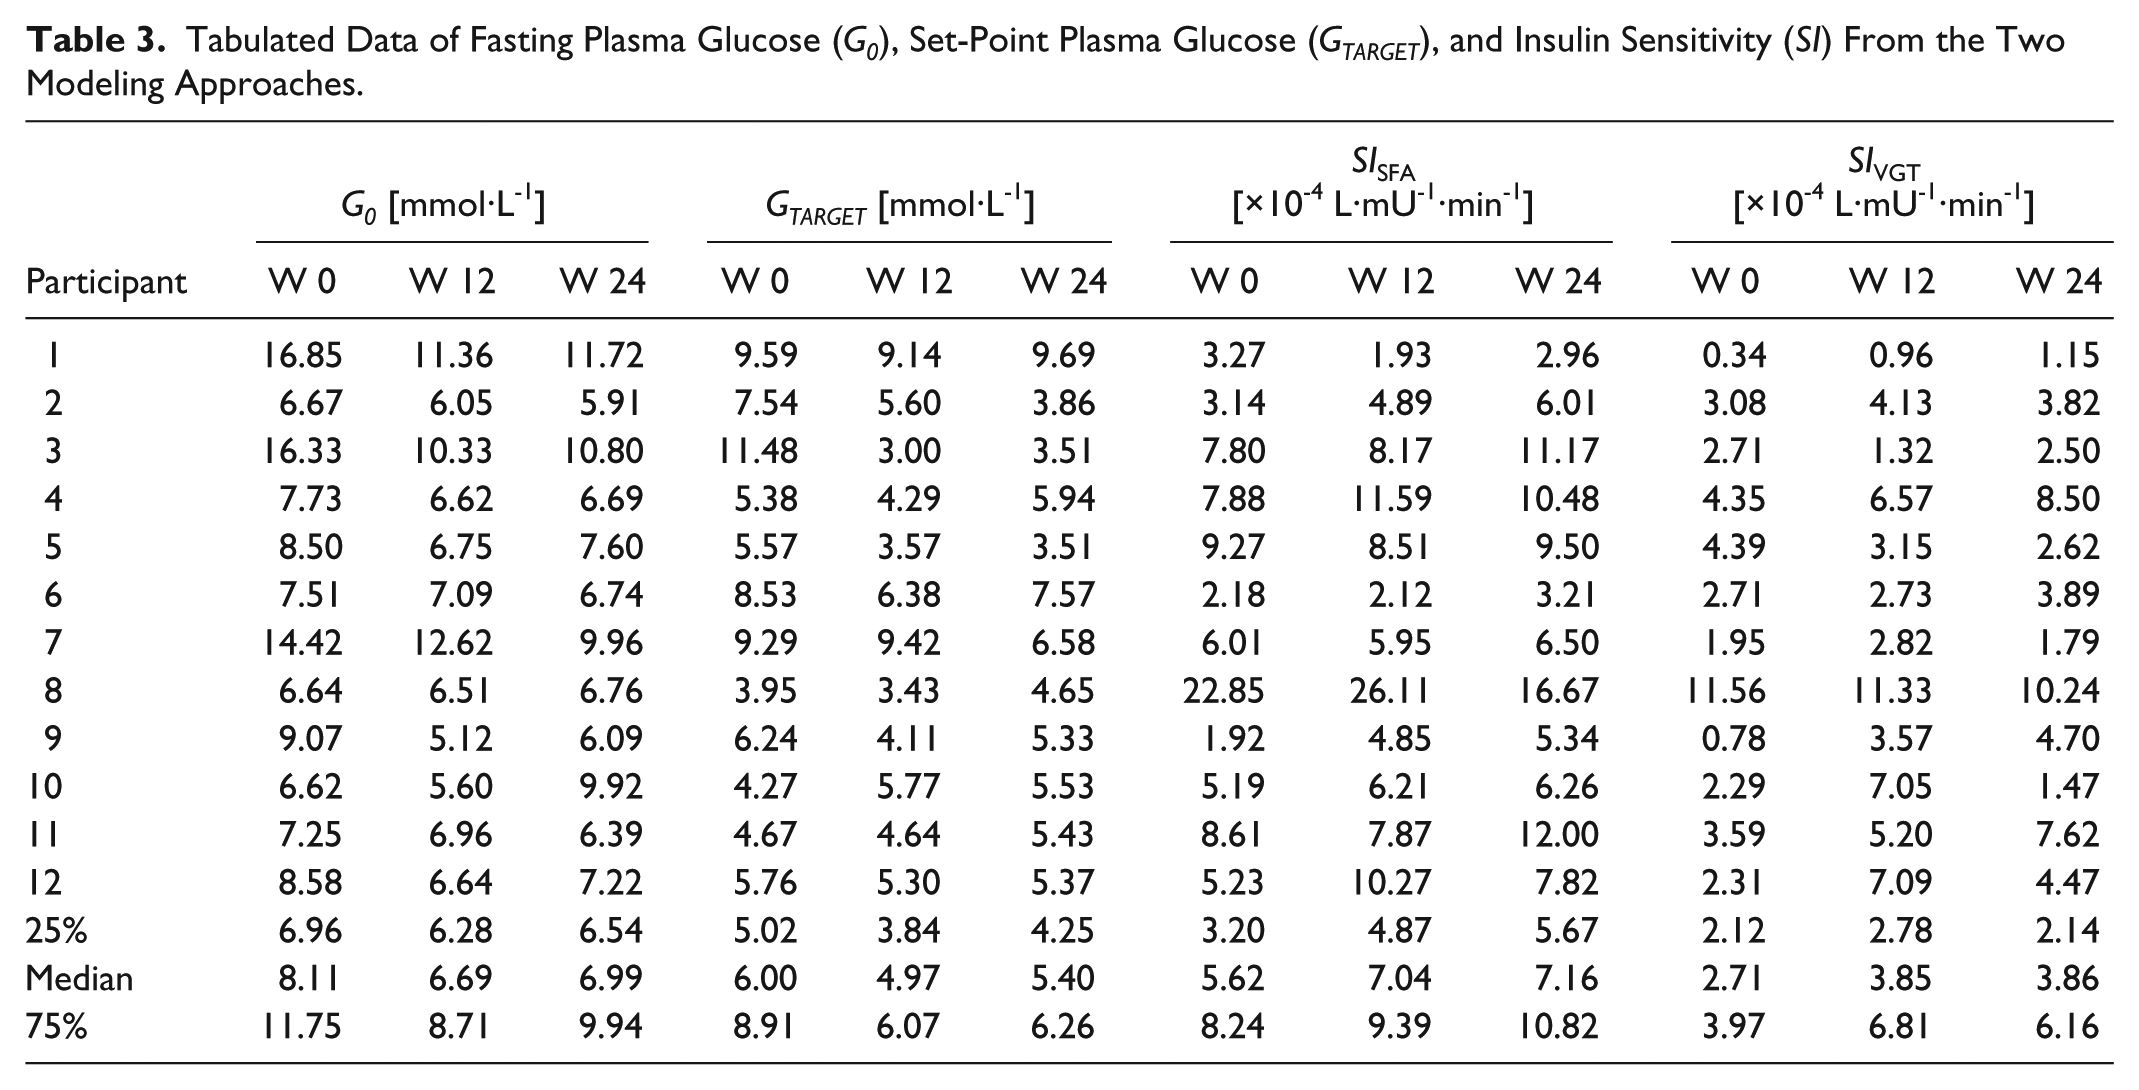
Figure 1 shows the median and quartiles of the responses to the clinical protocol. Table 3 compares measured G0 and calculated GTARGET across participants and weeks of testing, as well as the SI values from the SFA and VGT models (SISFA and SIVGT, respectively). There were significant differences between the pooled patient specific and week specific G0 and calculated GTARGET values in this cohort (Signed rank sum: Prs < .0001, Kolmogorov-Smirnov: Pks < .0001). In particular, there were significant differences across the two modeling approaches in calculated SI values (Prs < .0001, Pks < .0001). Figure 2 shows the individual relationships between G0 used in the SFA model and calculated GTARGET from the VGT model for all participants and weeks. Note the bias about the 1:1 line indicating that, in almost all cases, the calculated GTARGET < G0 for this cohort. There were only 4 exceptions over 36 results (11.1%).
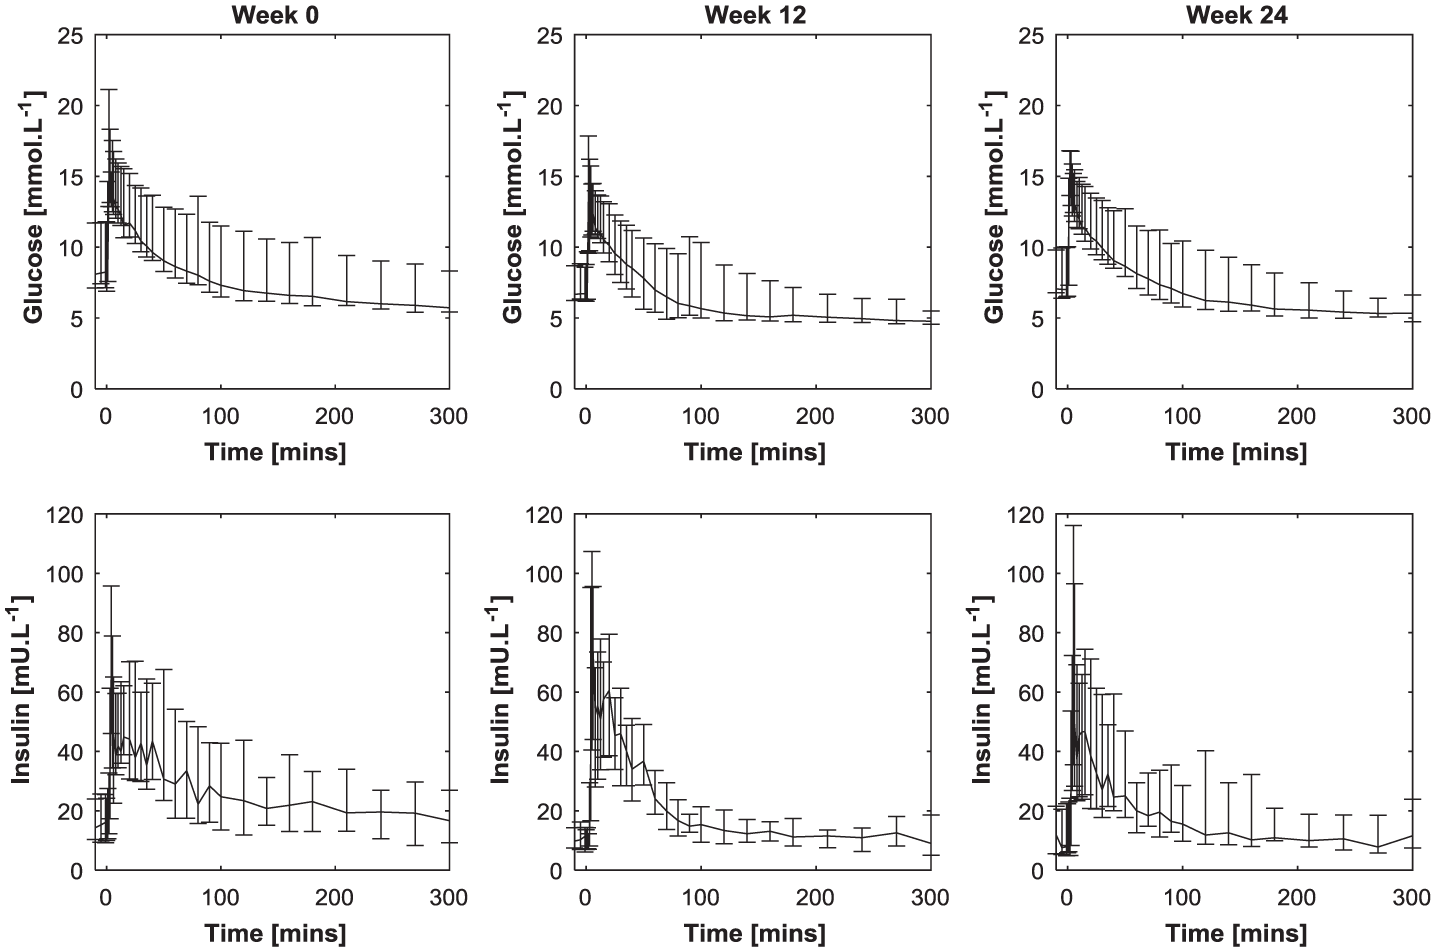
Median and quartile range for responses to the clinical protocol over weeks 0, 12, and 24.
Tabulated Data of Fasting Plasma Glucose (G0), Set-Point Plasma Glucose (GTARGET), and Insulin Sensitivity (SI) From the Two Modeling Approaches.
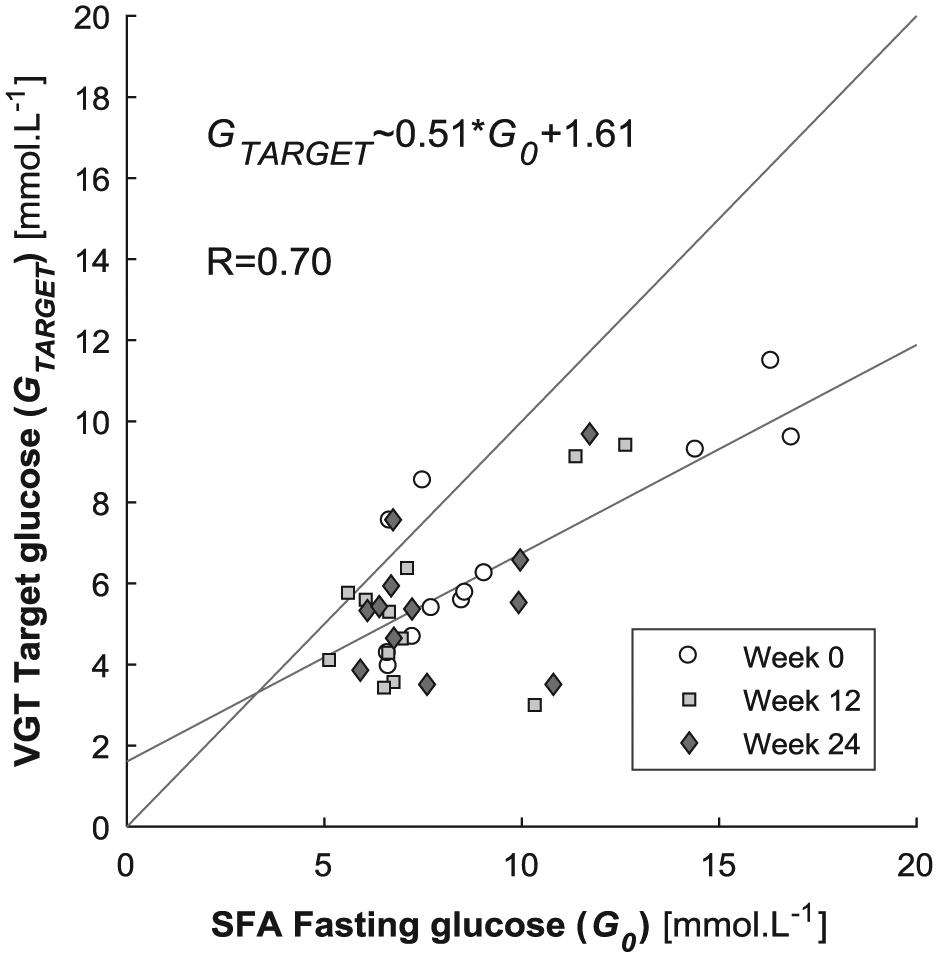
Relationship between measured G0 and calculated GTARGET across all participants and weeks. The gray lines are the least squares regression and the 1:1 line.
Figure 3 exhibits a general reduction in SIVGT values compared to SISFA. Table 3 shows the highest SIVGT value was 11.6×10⁻⁴ L·mU−1·min−1, compared to 26.1×10⁻⁴ L·mU−1·min−1 for the SISFA. Figure 4 shows the distribution of measured G0 and calculated GTARGET across SI values from the two models.
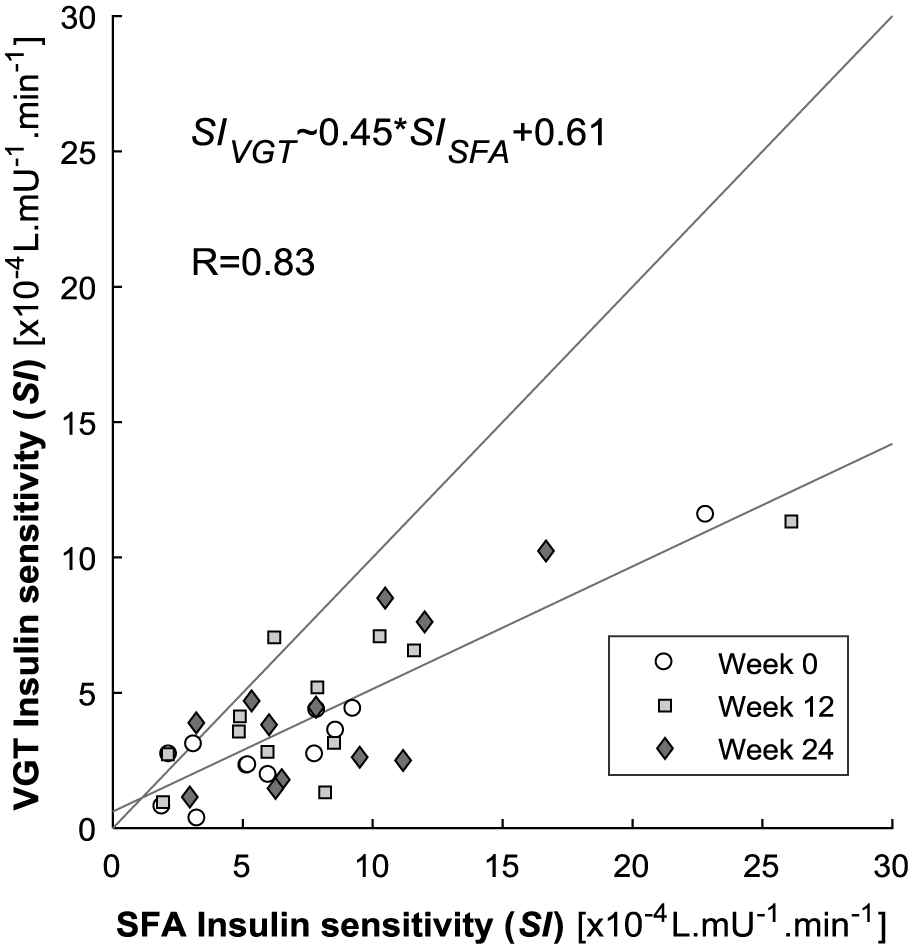
Relationships between SI values calculated by the SFA and VGT models. The gray lines are the least squares regression and the 1:1 line.
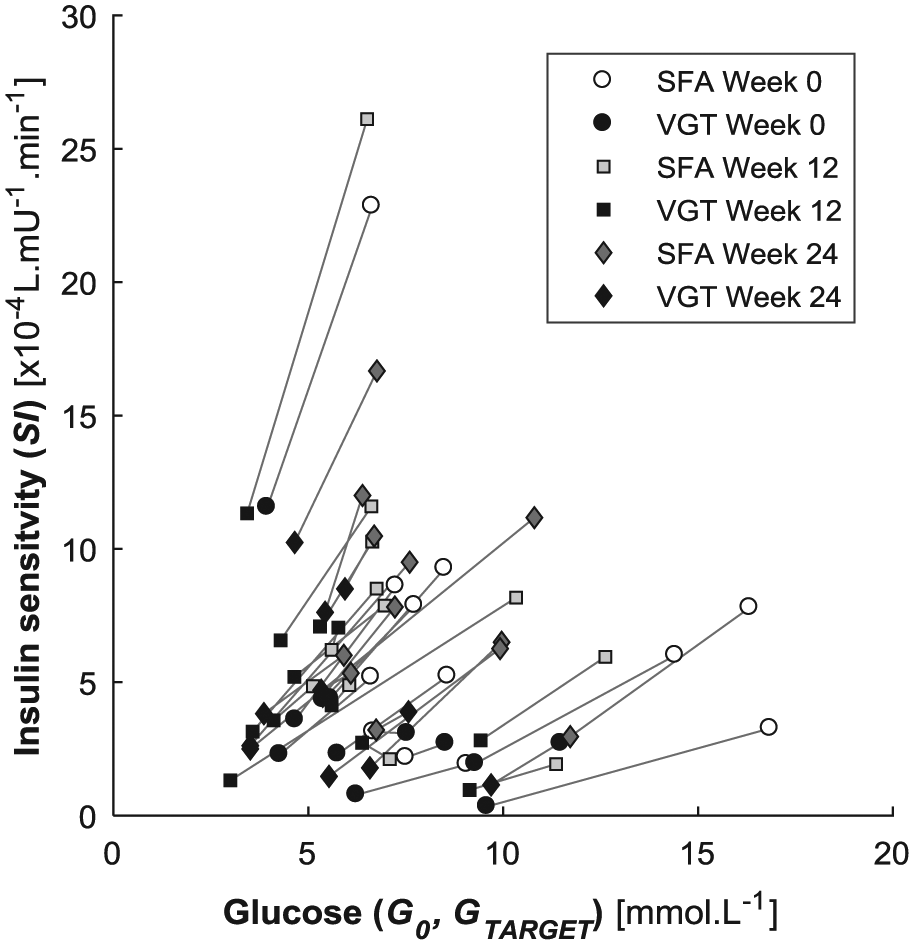
Distribution of assumed and calculated target glucose and calculated insulin sensitivity across SFA and VGT models. The gray lines link model solutions across the same data set.
Figure 5 shows the plasma glucose models with the measured glucose data for Participants 2 and 10. It shows the impact of adopting G0 = GTARGET in the SFA model and calculating GTARGET in the VGT model. The calculated GTARGET for Participant 2 in week 12 value was similar to the G0 value and thus, there was minimal difference in the simulations or SI values (left panel vs right panel). In contrast, Participant 10 exhibited a much larger discrepancy between GTARGET and G0. Hence, this participant’s simulations and SI values across models were quite different (Table 3). Over all participants and trials, the fit-to-data is better for the VGT model (median absolute residual error (RE) = 0.080 mmol·L−1 vs RE = 0.523 mmol·L−1 for the SFA model Prs < .0001, Pks < .0001).
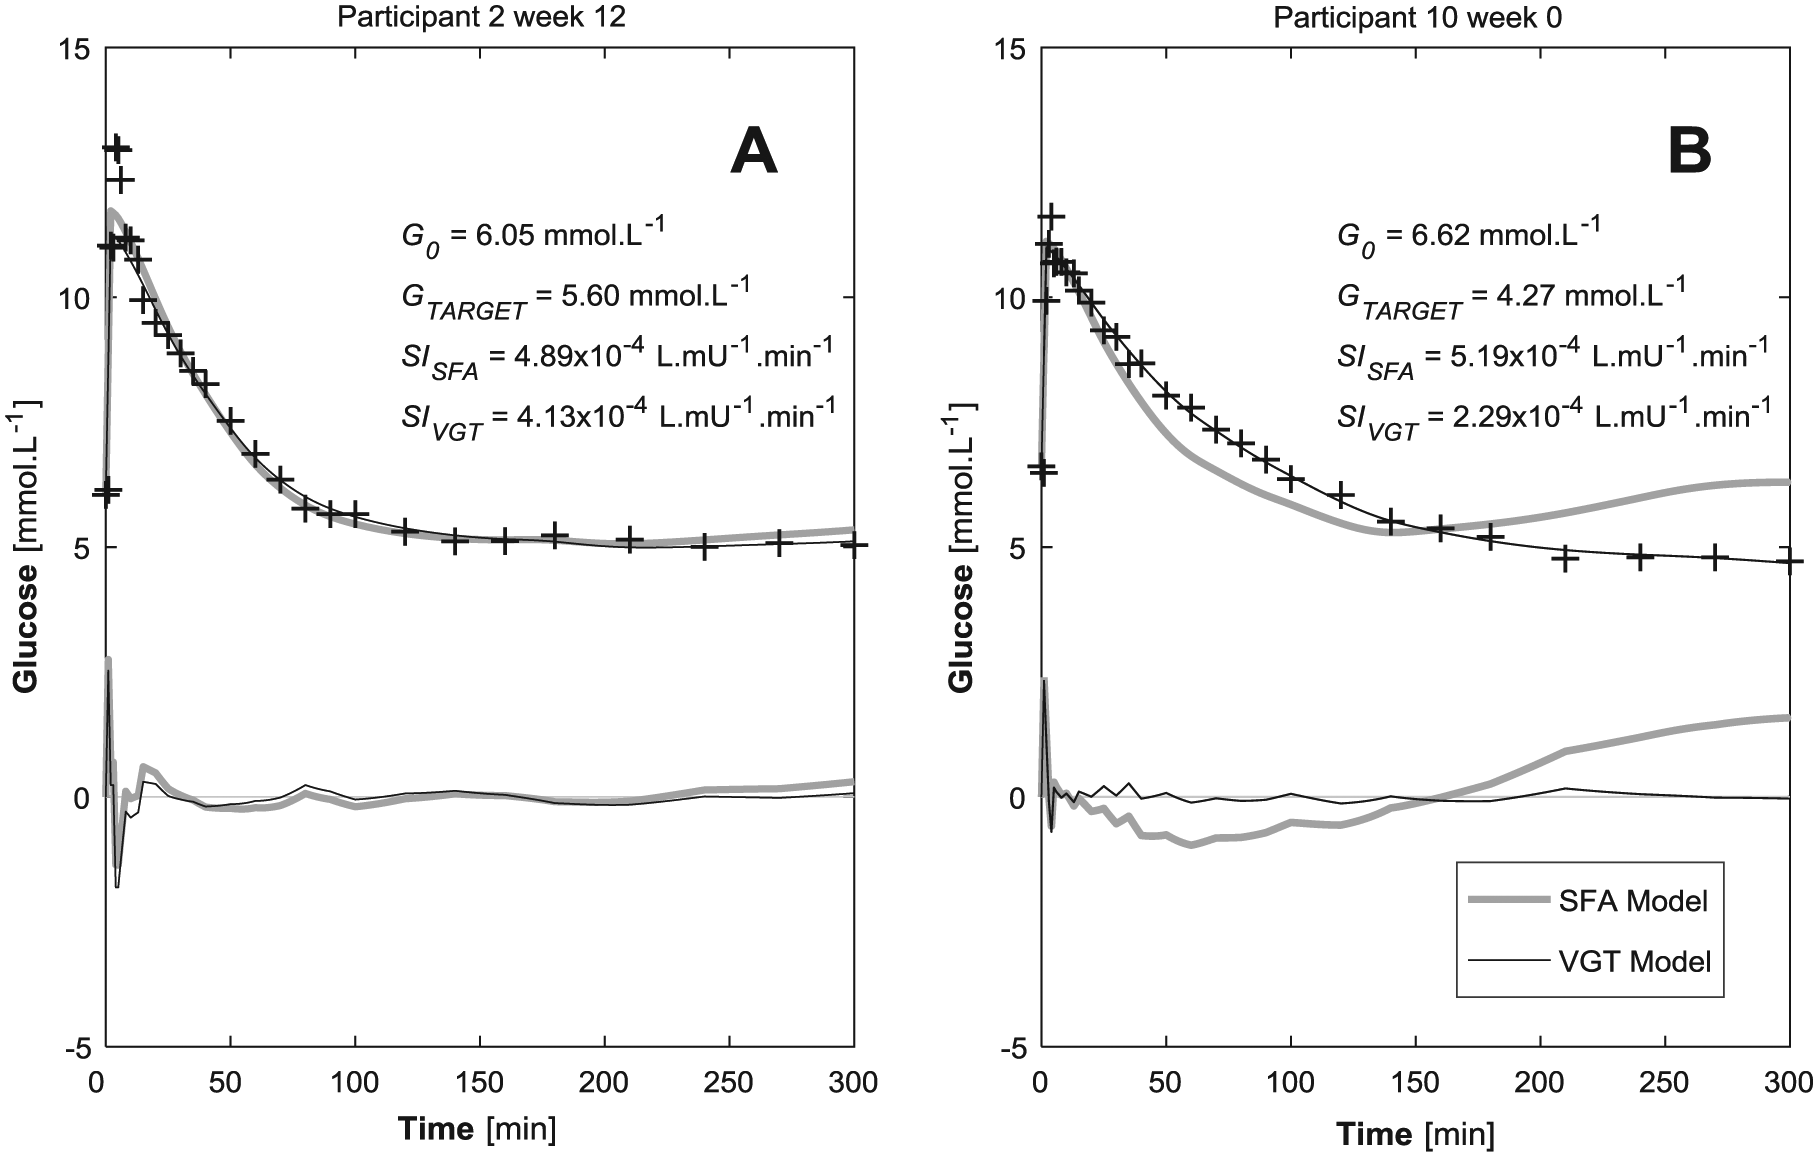
Blood glucose measurements with simulations from the typical SFA model and the proposed VGT model. Residual plots are also shown.
Discussion
Typical model-based SI measurement strategies set GTARGET equal to G0.12-19,23 However, for some individuals with type 2 diabetes, this strategy ultimately leads to poor model-to-data fits, SI values that are unlikely to represent the participant’s underlying metabolic status (Figure 5). 20 While there is no evidence to support the necessity of calculating GTARGET in healthy cohorts (Figure 5A),28,29 Figure 5B shows how the inclusion of GTARGET as a model variable was necessary to achieve a good model fit to data. The inclusion of GTARGET as a model variable also shifted the SI to a more expected value for this patient. While the improved residual was expected due to additional variable in the VGT model, the six-fold improvement in residual error (0.080 mmol·L−1 vs RE = 0.523 mmol·L−1) implies calculating GTARGET was necessary for this cohort with type 2 diabetes.
However, when G0 ≈ GTARGET, the fitted glucose profiles from both models matched measured plasma glucose data well (Figure 5). The residual errors in Figure 5A were 0.166 mmol·L−1 compared to 0.135 mmol·L−1 for the SFA and VGT models, respectively. This result implies that, when the G0 ≈ GTARGET the adapted model provides minimal benefit and no impediment and thus, the SI values across the approaches were effectively equivalent. However it is important to note that it is not possible to know when this equality assumption is correct a priori.
Figure 3 shows calculated SIVGT values were significantly lower than SISFA, with only 4 exceptions over 36 results (11.1%). Previous studies have shown individuals with impaired glucose tolerance (IGT) tend to have a DISST SI values in the range of 2×10⁻⁴ to 6×10⁻⁴ L·mU−1·min−1.10,12-14 In particular, a previous study that validated the DISST model’s SI metric found a median SI for IGT individuals (N = 5) of 4.14×10⁻⁴ L·mU−1·min−1.12,23 Hence, the median SIVGT value for this cohort (3.4×10⁻⁴ L·mU−1·min−1) is more in line with expected behavior than the median SISFA value (6.4×10⁻⁴ L·mU−1·min−1). This agreement with prior research implies that the inclusion of GTARGET enables a more accurate measure of insulin sensitivity.
Table 3 shows while most participants had elevated fasting (G0) glucose levels, GTARGET was calculated closer to a normal reference range of 4.0 to 5.6 mmol·L−1. 30 In particular, 14 of the 36 calculated GTARGET values (38.9%) were in the normal, healthy range, while only 2 of 36 G0 values (5.6%) were in that range. Figure 2 shows that G0 was typically higher than calculated GTARGET, with only 4 exceptions over 36 results (11.1%). These results imply that most individuals with type 2 diabetes have a lower set point GTARGET level than assumed by G0 and would thus perhaps attain lower glucose levels if exogenous insulin and/or longer-term fasting was introduced. 31
Participant 8 was diagnosed with diabetes 7 years prior to the study. While their SI remained in the healthy range for the duration of the intervention (Table 3), they also had elevated G0 for the duration of the intervention. However, when increased levels of insulin were introduced by the IM-IVGTT, the participant’s glycemic response tended toward a value much lower than the fasting value of G0 and toward the approximately 4.0 mmol·L−1 (Table 3). Furthermore, the SISFA would be more expected from a very fit, healthy individual. 12 In contrast, the SIVGT was more in-line with expected behavior for individuals with long-term type 2 diabetes.1,12
Participant 10 experienced a modest weight loss between week 0 and week 12 (0.8%) and a concurrent improved in SI value (Table 3). However, during the second study period, the participant failed to comply with the diet and gained 4.2% body weight. Hence, the SI of Participant 10 fell between week 12 and week 24. This result aligns with the general trend of improved SI due to weight loss.3,32 Participant 10 had consistent GTARGET values within the healthy range across each trial despite changes in diet that manifested in weight gain and SI loss. In contrast, their G0 values at week 0 and 12 were slightly elevated, and the week 24 G0 was a highly elevated 9.92 mmol·L−1. This result shows while the change in diet had a quick effect on G0, GTARGET remained consistently at a healthy level throughout the intervention. Hence, the adapted VGT modeling approach captured a stable, underlying and important aspect of this participant’s metabolic state, despite noticeable apparent changes in their physiology.
Participant 11 achieved numerous physiological improvements as a result of the intervention. In particular, their BMI dropped, and G0 improved. However, the SISFA values do not exhibit the expected improvement in insulin sensitivity for this participant. In contrast, when GTARGET was calculated, the SIVGT values of this participant were consistently and noticeably improved in concert with weight loss. Thus, calculating GTARGET as was critical to capturing the expected changes in SI for Participant 11. In contrast, the GTARGET = G0 assumption effectively obscured this result.
Participant numbers are a possible limitation with only 12 subjects and 36 tests. In particular, greater participant variability is typically used to justify model proposals like that presented here. However, in this case, the proposed variance to the model is primarily intended for individuals with established diabetes. Thus, the optimal cohort should span of dysfunction within expected within type 2 diabetes, which is well captured in this cohort. This cohort has individuals with 1 to 11 years since diagnosed, and thus was suitable for establishing model fit and individual behaviors.
Nine of the 12 participants had glycemic responses tending toward a healthy GTARGET value (4 to 5.6 mmol·L−1). However, all participants had impaired fasting glucose at week 0. Two of the three individuals (Participants 1, 3, 7) with elevated GTARGET values had confirmed long-term diabetes (Table 1). These latter results may imply that irregular glycemic targets could be a late onset dysfunction of the disease. However, greater participant numbers are required to confirm this outcome. This potential mechanism of dysfunction in established type 2 diabetes is not currently recognized by diabetologists or physiological modelers. However, this research has shown GTARGET was variable, identifiable, and had a large effect on a model-based analysis of dynamic glycemic data. The results justify prospective studies to determine whether GTARGET is significantly higher in individuals with longer term established type 2 diabetes, and whether the variable can augment and improve the stability of other glycemic models.
Conclusions
GTARGET should be considered as a variable when modeling the glycemic metabolism of individuals with type 2 diabetes. In particular, incorporating GTARGET as a calculated variable in dynamic SI tests in type 2 diabetes may modulate SI toward more physiologically representative values that could strengthen the findings of many retrospective clinical trials.
Footnotes
Abbreviations
BMI, body mass index; DISST, dynamic insulin sensitivity and secretion test; EIC, euglycemic hyperinsulinemic clamp; G0, fasting glucose concentration; GTARGET, set-point glucose concentration; IM-IVGTT, insulin-modified intravenous glucose tolerance test; IR, insulin resistance; SFA, standard fasting assumption; SI, insulin sensitivity; VGT, variable glucose target.
Declaration of Conflicting Interests
The author(s) declared no potential conflicts of interest with respect to the research, authorship, and/or publication of this article.
Funding
The author(s) disclosed receipt of the following financial support for the research, authorship, and/or publication of this article: This study was supported through grants from the New Zealand Society for the Study of Diabetes (NZSSD) Novo-Nordisk grant scheme and from the Wellington Medical Research Foundation. The Ministry of Education, Malaysia and the University of Technology MARA, Penang, Malaysia provided research funding to NAO.