
Abstract
Background:
The pathogenesis of type 2 diabetes is characterized by insulin resistance and insulin secretory dysfunction. Few existing metabolic tests measure both characteristics, and no such tests are inexpensive enough to enable widespread use.
Methods:
A hierarchical approach uses 2 down-sampled tests in the dynamic insulin sensitivity and secretion test (DISST) family to first determine insulin sensitivity (SI) using 4 glucose measurements. Second the insulin secretion is determined for only participants with reduced SI using 3 C-peptide measurements from the original test. The hierarchical approach is assessed via its ability to classify 214 individual test responses of 71 females with an elevated risk of type 2 diabetes into 5 bins with equivalence to the fully sampled DISST.
Results:
Using an arbitrary SI cut-off, 102 test responses were reassayed for C-peptide and unique insulin secretion characteristics estimated. The hierarchical approach correctly classified 84.5% of the test responses and 94.4% of the responses of individuals with increased fasting glucose.
Conclusions:
The hierarchical approach is a low-cost methodology for measuring key characteristics of type 2 diabetes. Thus the approach could provide an economical approach to studying the pathogenesis of type 2 diabetes, or in early risk screening. As the higher cost test uses the same clinical protocol as the low-cost test, the cost of the additional information is limited to the assay cost of C-peptide, and no additional procedures or callbacks are required.
Keywords
Type 2 diabetes is very costly in personal and economic terms and is increasing in prevalence globally.1,2 Obesity, increasingly sedentary lifestyles, environmental factors, and genetic predisposition have been implicated as the causes of type 2 diabetes.3-5 Intervention measures such as intensive exercise or dieting can mitigate or offset the onset of the disease.5-7 However, such methods have not been utilized widely, as it is not economically feasible to provide such interventions across wide population groups. However, if health care systems could recognize individuals with significant risk very early, there is potential for economic and personal benefit. The tools used to recognize individuals sufficiently early on the pathogenesis of type 2 diabetes must be of low cost to be economically sustainable and of low intensity.
The typical pathogenesis of type 2 diabetes progresses through 3 distinct stages. 8 In comparison to NGT, IGT is characterized by low insulin sensitivity (SI), high insulin secretion rates (UN), and equivalent basal glucose (G0).8-10 This state of high UN and low SI often occurs before the formal diagnosis of diabetes. While early-onset diabetes is often associated with hypersecretion, late-onset diabetes is typically characterized by a decline UN, coupled with insulin resistance, this causes an increase in G0 .8,11-15 Insulin sensitivity typically reduces during the progression of type 2 diabetes,16-19 but most measures of SI lose resolution at lower values. 20 The changes in SI, UN, and G0 during the pathogenesis of type 2 diabetes are summarized in Figure 1 and Table 1.
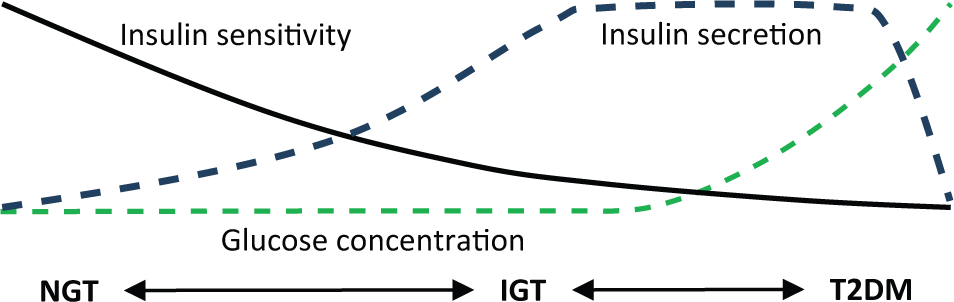
Typical pathogenesis of type 2 diabetes.
Characteristics of Typical Type 2 Diabetes Development With Respect to NGT Individuals.
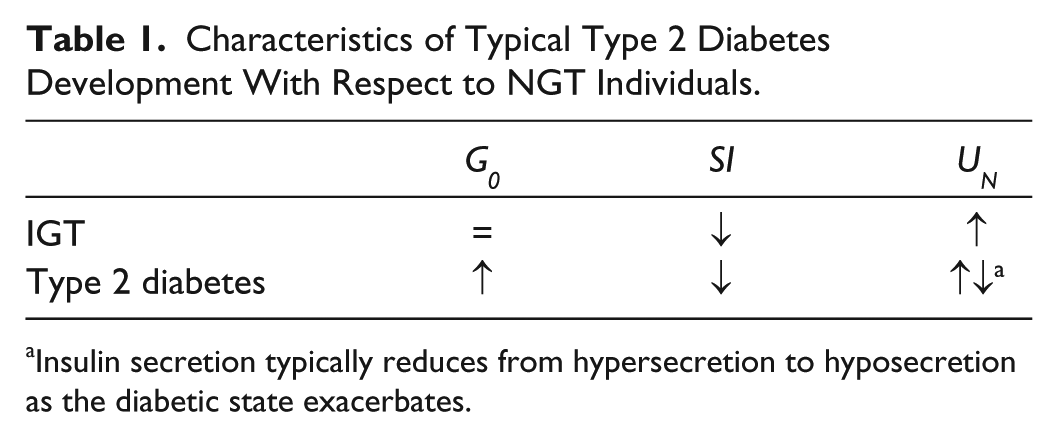
Insulin secretion typically reduces from hypersecretion to hyposecretion as the diabetic state exacerbates.
The dynamic insulin sensitivity and secretion test (DISST) was designed to capture high resolution estimates of SI and UN which are the key metabolic indicators of the pathogenesis of type 2 diabetes and thus assess the risk or severity of the disease.21 -23 Later analysis revealed that accurate SI values could be obtained using only the low-cost glucose assays.24,25 A spectrum of DISST tests showed that a range of accuracy and cost trade-off existed when different species from the blood samples from a single test are measured. 26 This outcome implies that a single clinical protocol could yield results of differing cost and accuracy depending on the nature of the assays taken.
These outcomes enable a hierarchical approach wherein the lower cost tests can be used to screen a population, and the higher cost tests can be used to provide specificity or added information where the value is most needed. Since stored samples can be assayed for further species, only a single test needs to be performed. This article presents a novel hierarchical approach that provides SI and UN information for participants that were recognized as insulin resistant via a low-cost test.
Methods
Cohort
Seventy-one female participants from the Otago region of New Zealand were recruited to take part in a longitudinal study of dietary protein. 27 Participants were randomized to either a high protein 30/40/30% protein/carbohydrate/fats, or high fiber 20/50 to 60/20 to 30% diets. Study participants were selected based on increased risk of diabetes and metabolic disease based on BMI (>25 kg/m2) or a genetic disposition to type 2 diabetes via ethnicity or family history. Subjects underwent a DISST test and had physical measurements taken at weeks 0, 12, and 24 of a randomized control trial measuring the effect of high protein dietary intervention. Full details of the trial can be seen in Te Morenga et al. 27
DISST Protocols
Subjects fasted from 10
DISST Model and Parameter Identification
The DISST model was used to model participant-specific behavior based on their measured glucose insulin and C-peptide responses to the clinical protocol.21,28 The model is defined as
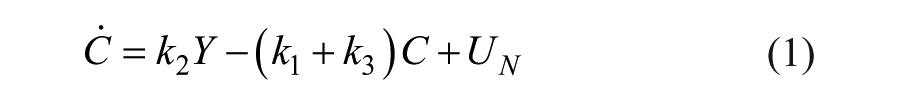
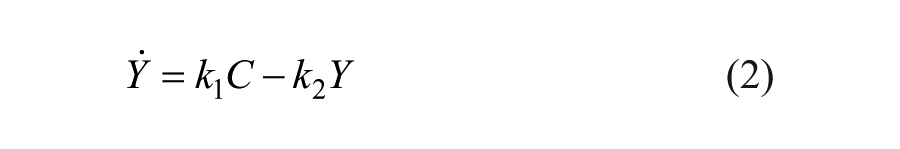
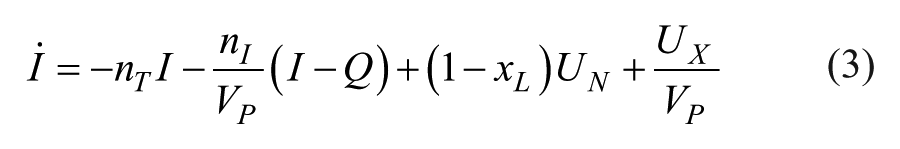
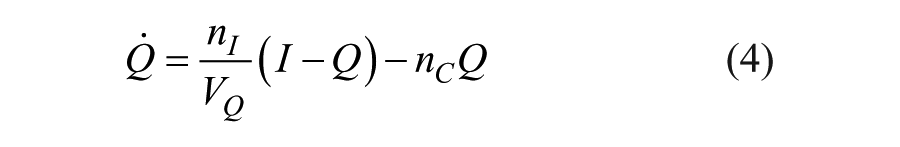
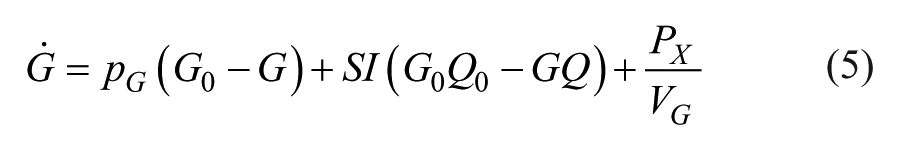
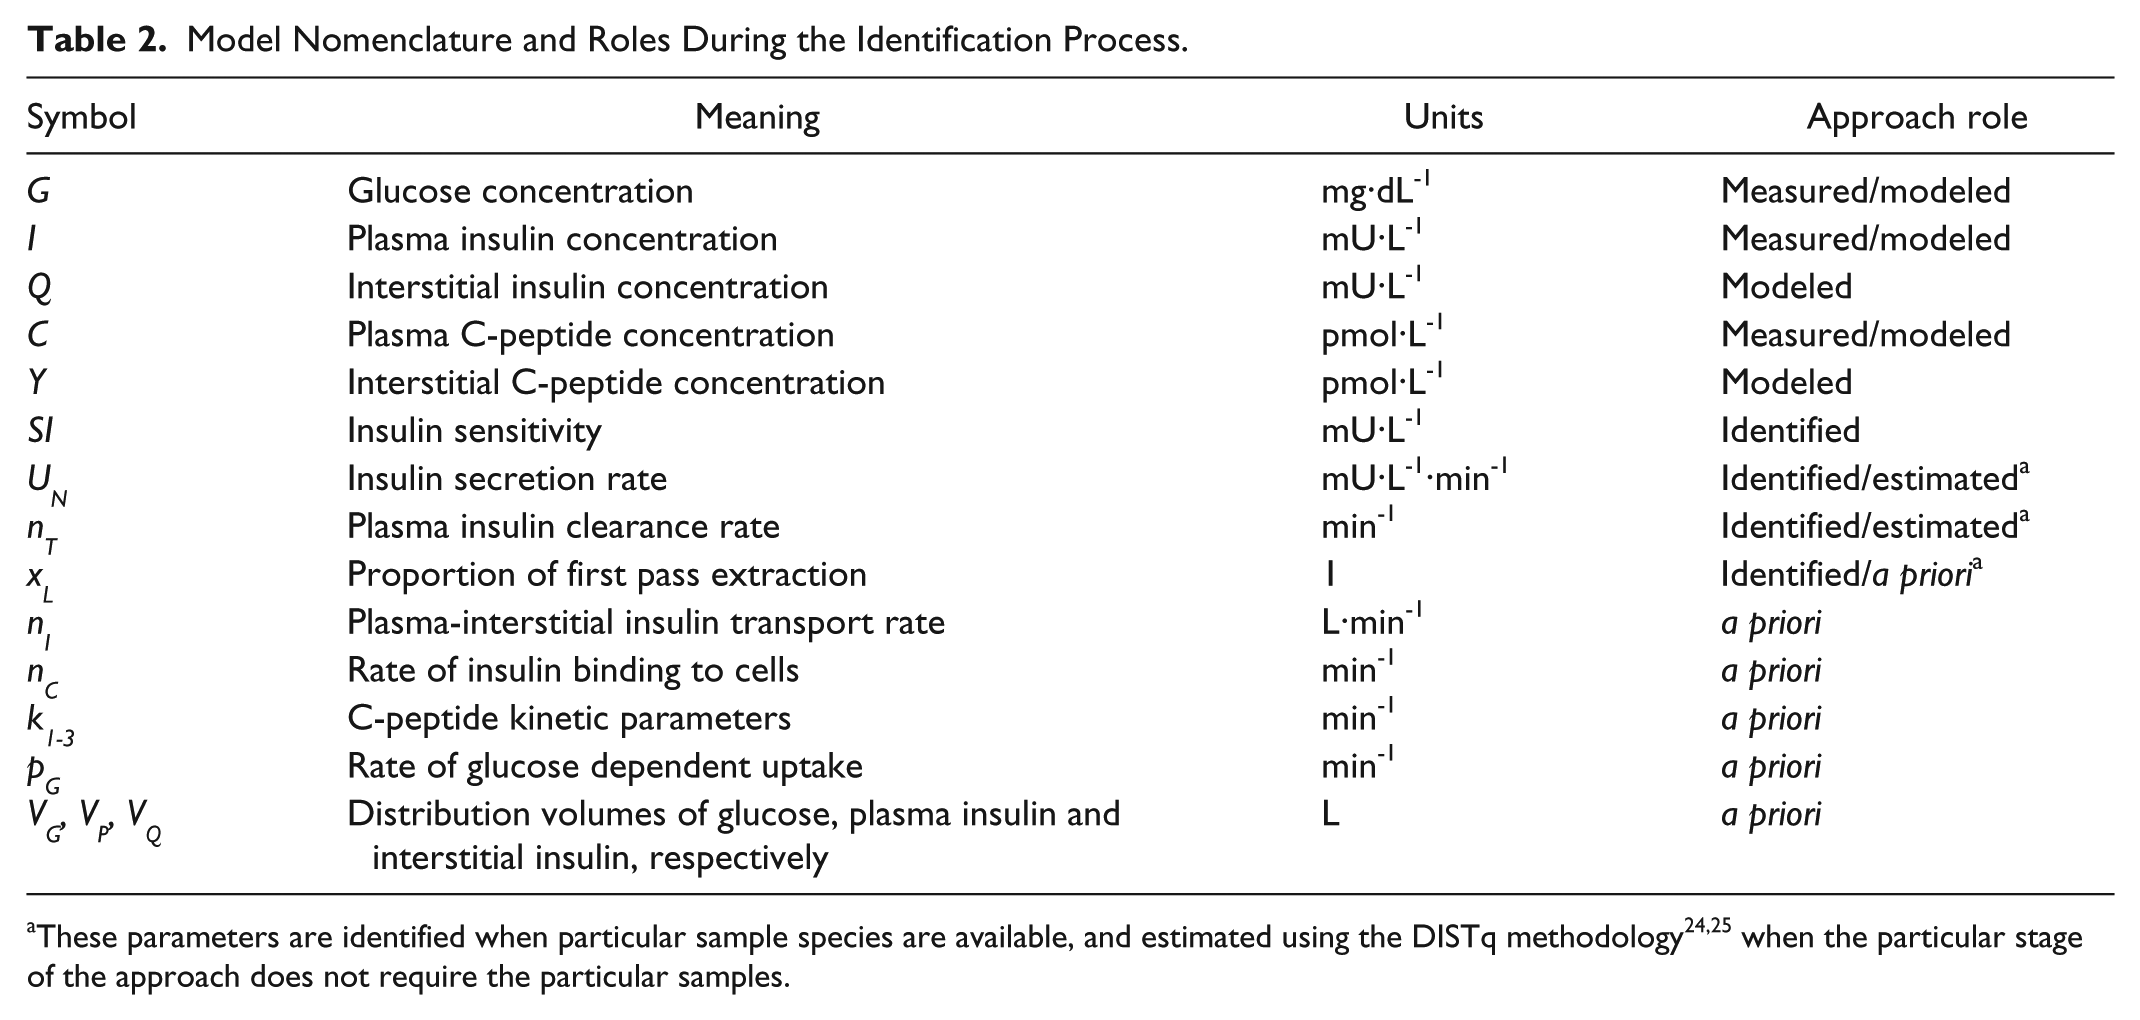
where nomenclature is defined in Table 2.
Model Nomenclature and Roles During the Identification Process.
The full DISST uses all available samples, and will be used as a comparator in this study. Information on the parameter identification methodology can be seen in Lotz et al. 21 The DISST hierarchy requires identification of 2 distinct sets of data from the same clinical protocol. The DISTq requires 4 of the 5 available glucose samples (t = 0, 10, 20, 30).24,25 The DISTqUN requires 4 of the available 5 glucose samples (t = 0, 10, 20, 30), and 3 of the available C-peptide samples (t = 0, 10, 30).
The DISTq parameter identification method uses an initial estimate of the test participant’s insulin response to the clinical protocol as input to the identification of SI and VG using the iterative integral method 29 with equation 5. An improved estimate of the participant’s insulin response can be made by determining the typical nT and UN values for the specific identified SI value. This approach allows an update of the SI via the improved input to the inverse problem. This process is iterated until convergence. Full details can be seen in Docherty et al.24,25
The DISTqUN uses a similar process to the DISTq. 26 However, instead of using the SI values to predict UN, this vector is determined via the deconvolution approach typical of the full DISST.21,30 The nT parameter is still iteratively updated by the SI values. The value of xL is set at 0.7 for both DISTq and DISTqUN.31,32
The full DISST uses all of the samples to identify UN via deconvolution of equations 1 and 2. The UN profile is divided into 3 distinct periods. The basal insulin secretion rate (UB); the first phase insulin secretion (U1) and the second phase secretion (U2). UB is the first value of the UN profile (mU⋅L-1⋅min-1). U1 is the area under the UN profile from t = 5 to 10 minutes (mU⋅L-1) and U2 is the area under the UN profile from t = 10 to 30 minutes (mU⋅L-1). The nT and xL parameters were identified via the iterative integral method and equations 3 and 4. SI and VG are identified via the iterative integral method and equation 5. The remaining a priori values are determined via the equations defined by Van Cauter et al. 33
The objective of the hierarchy of DISST tests is to determine the progression of type 2 diabetes for as little cost as possible. To reduce cost, a 2-stage test is proposed. The participant reports to undergo a DISST test and 5 blood samples are taken. Four of the samples are assayed for glucose straight away, and SI is estimated using the DISTq methodology. If this SI value falls below a certain threshold, the t = 0, 10, and 30 minute samples are then assayed for C-peptide. C-peptide assays are not typically available immediately. This analysis measures the C-peptide levels in blood samples of those participants that obtained an SI value of less than 8 × 10⁻⁴ L⋅mU-1⋅min-1 according to the DISTq and the 4 glucose samples.
Analysis
Spearman correlation and receiver operator characteristic curves (ROC) were used to compare SI values obtained by the fully sampled DISST to those obtained by DISTq. The ROC will use a diagnostic threshold of 7 × 10⁻⁴ L⋅mU-1⋅min-1 for insulin resistance in the absence of an established SI value for these purposes. The 8 × 10⁻⁴ L⋅mU-1⋅min-1 reassay threshold was determined to allow the hierarchy approach the ideal chances of correctly diagnosing participants about this threshold. This analysis will be repeated for the insulin sensitivity values obtained when samples from the qualifying tests are reassayed for C-peptide.
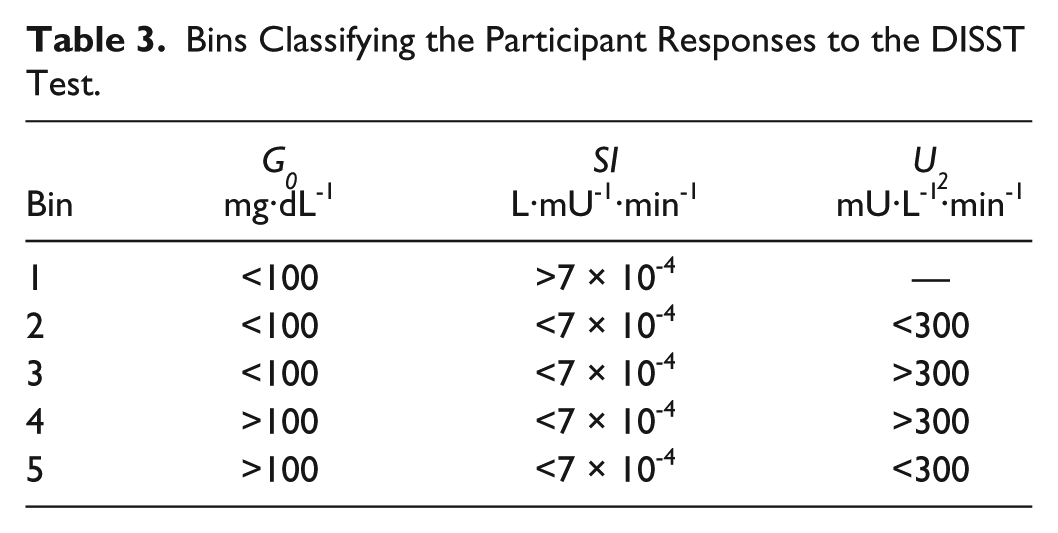
The hierarchy will be assessed via its ability to classify the patient states by defining a number of bins as shown in Table 3. The G0 threshold was 5.5 mmol⋅L-1 according to the ADA classification. 34 The SI and U2 classifier thresholds were arbitrarily chosen at 7 × 10⁻⁴ L⋅mU-1⋅min-1 and 300 mU⋅L-1, respectively. Although there have been a number of studies that link SI and U2 to the pathogenesis of type 2 diabetes, there have been no declared and accepted values of elevated risk. Hence, it was necessary to determine arbitrary values. The median SI value for the cohort was approximately 7 × 10⁻⁴ L⋅mU-1⋅min-1 and the 75th percentile U2 value was approximately 300 mU⋅min-1. The bins can be broadly considered as 1, NGT; 2, IGT; 3, IGT—hypersecretory; 4, IFG—hypersecretory; 5, IFG—hyposecretory. These groups allow a discrimination of key patient states for optimal application of intervention or therapy. Note that it is possible for individuals to escape classification if they have high insulin sensitivity and high fasting glucose.
Bins Classifying the Participant Responses to the DISST Test.
Results
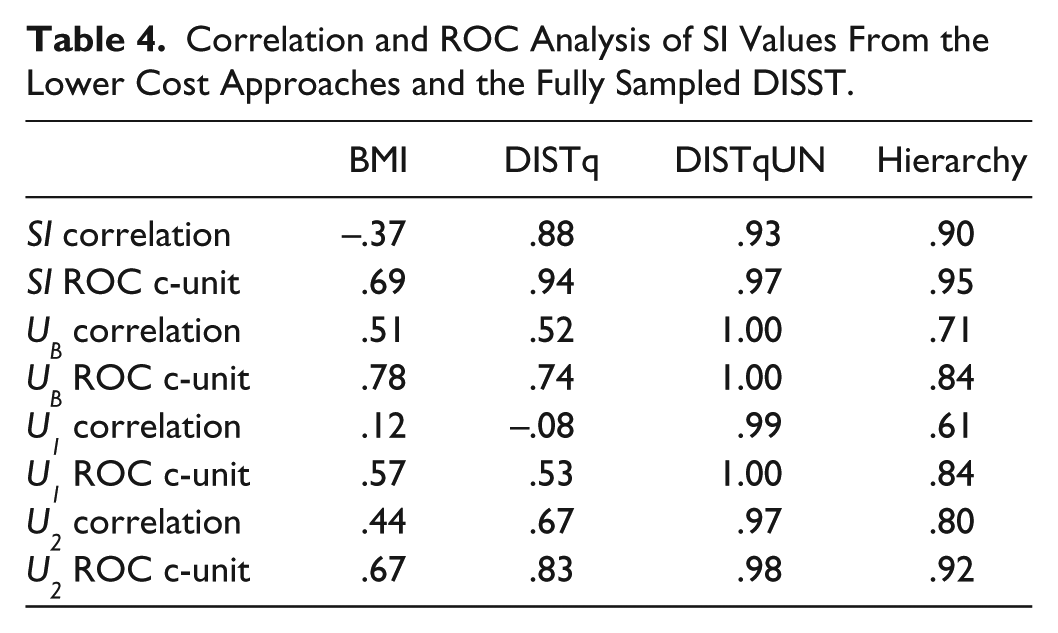
Using a retest threshold of SI < 8 × 10⁻⁴ mU.L-1.min-1 as measured by the DISTq meant that samples from 102/214 tests in this “at-risk” cohort were reassayed for C-peptide. Hence, the mean assay cost per person of the cohort was ~NZ$10 (~US$8.5) for DISTq, ~NZ$115 (~US$99) for DISTqUN and ~NZ$55 (~US$47) for the hierarchical approach. Table 4 shows correlations and diagnostic equivalence between the various down-sampled tests and the fully sampled DISST. As expected, the hierarchy approach represented a compromise between the lower cost DISTq and the higher cost DISTqUN. Figure 2 shows how the SI values were distributed about the retest point, and how the up-sampled analysis altered the diagnostic potential of SI. Figure 3 shows the distribution of second phase insulin secretion values and the improvement in diagnostic ability of the metric after the qualifying test samples were reassayed.
Correlation and ROC Analysis of SI Values From the Lower Cost Approaches and the Fully Sampled DISST.
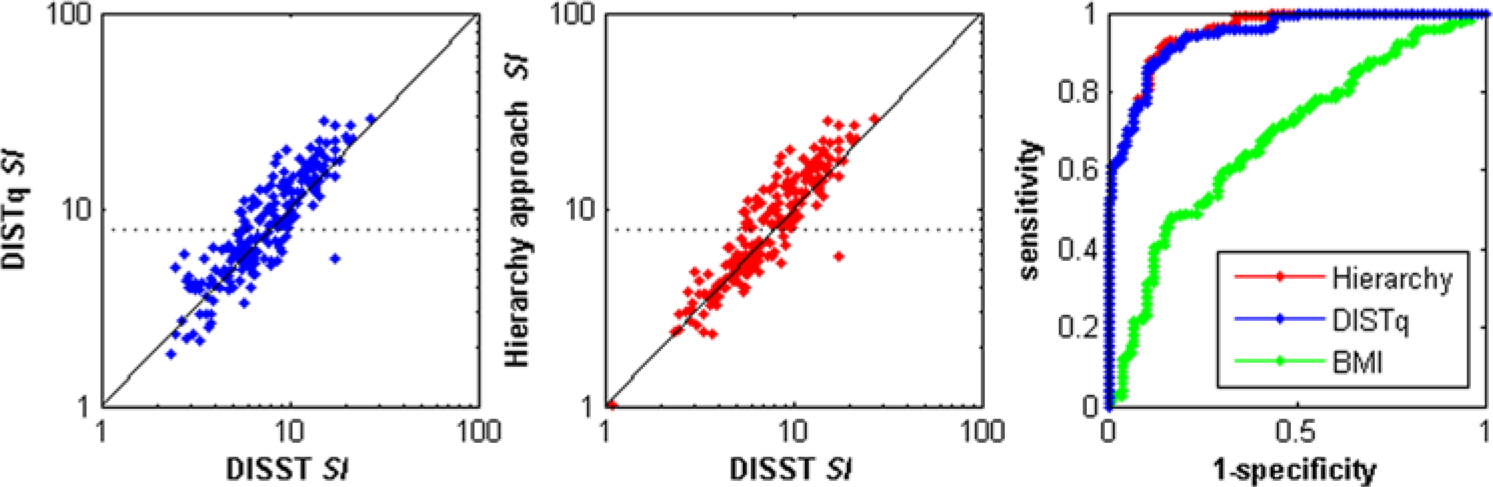
Comparison of insulin sensitivity values across the fully sampled DISST, DISTq, and the 2-stage hierarchal approach. The receiver operator curve was evaluated using a cutoff IS value of 7 × 10⁻⁴ L·mU-1·min-1. The dotted line shows the retest threshold.
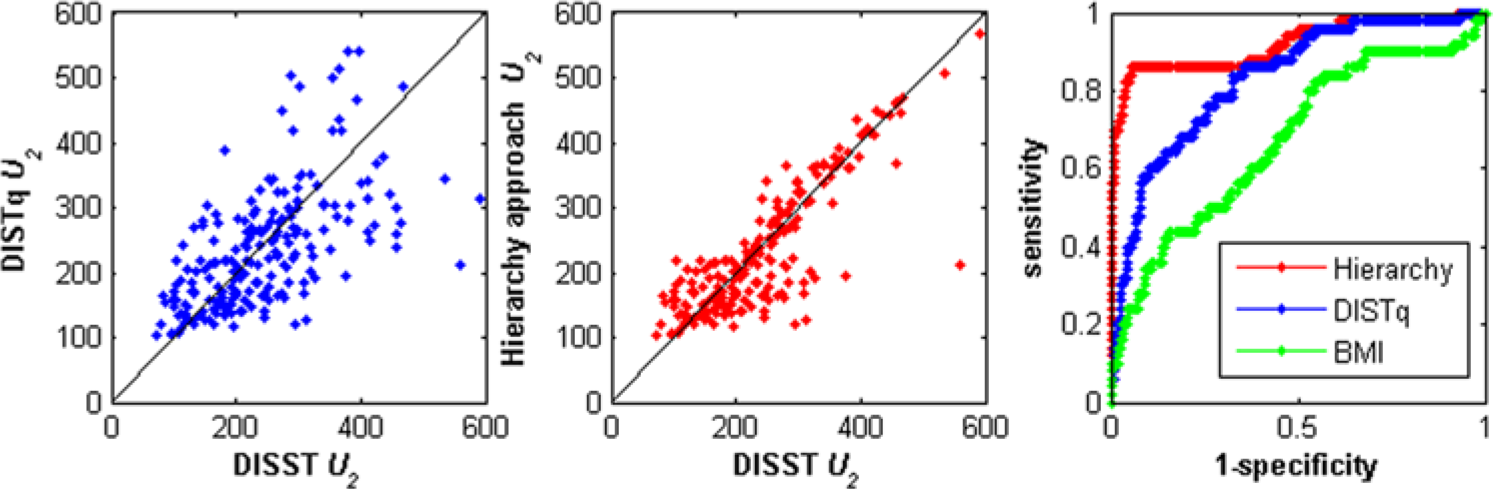
Distribution of the second phase insulin secretion content as determined by the fully sampled DISST and the reduced sample tests. The receiver operator curve was determined using a U2 value of 300 mU.min-1.
While DISTqUN and the hierarchy captured both SI and UN relatively well, DISTq effectively captured SI alone. This was an intended outcome of the hierarchy design as the low-cost SI value can be identified in real time and used to determine the insulin resistance subjects for whom UN information would be beneficial. The appendix shows the differences between the UN profiles estimated via the DISST and the down-sampled approaches.
Table 4 and Figures 2 and 3 show the ability of BMI to classify insulin resistance and hypersecretion, respectively. Obesity (BMI > 30) constituted 57/112 (50.9%) of group 1 as defined by the DISST, 35/46 (76%) of group 2, 30/36 (83.3%) of group 3, 6/7 (85.7%) of group 4, and 11/11 of group 5. Hence, in this cohort, the rate of obesity rose as the grouping criteria defined increasingly exacerbated states on the pathogenesis of type 2 diabetes. However, the ROC c-units for BMI to SI and UN show that BMI has very limited potential to capture or contrast the key metabolic signals of prediabetes.
Table 5 shows the correct reclassification rates of the various tests. Note that scores along the main diagonal represent correct reclassification and that groups 4 and 5 represent elevated fasting glucose (>100 mg⋅dL-1). Since all approaches measure fasting glucose, all were able to determine this threshold with full precision. The discrimination of groups 2 and 3 as well as groups 4 and 5 was done in terms of U2. Those that evaded classification (n = 3) had a high insulin sensitivity value (>7 × 10⁻⁴ mU.L-1.min-1) and a high basal glucose value (>5.6 mg⋅dL-1), and thus represented an unexpected state. The hierarchical approach correctly reclassified 181/214 trials (84.6%) whereas the DISTq test correctly reclassified 161/214 trials (75.2%).
Reclassification Rates for the Hierarchical Approach and the DISTq Approach.
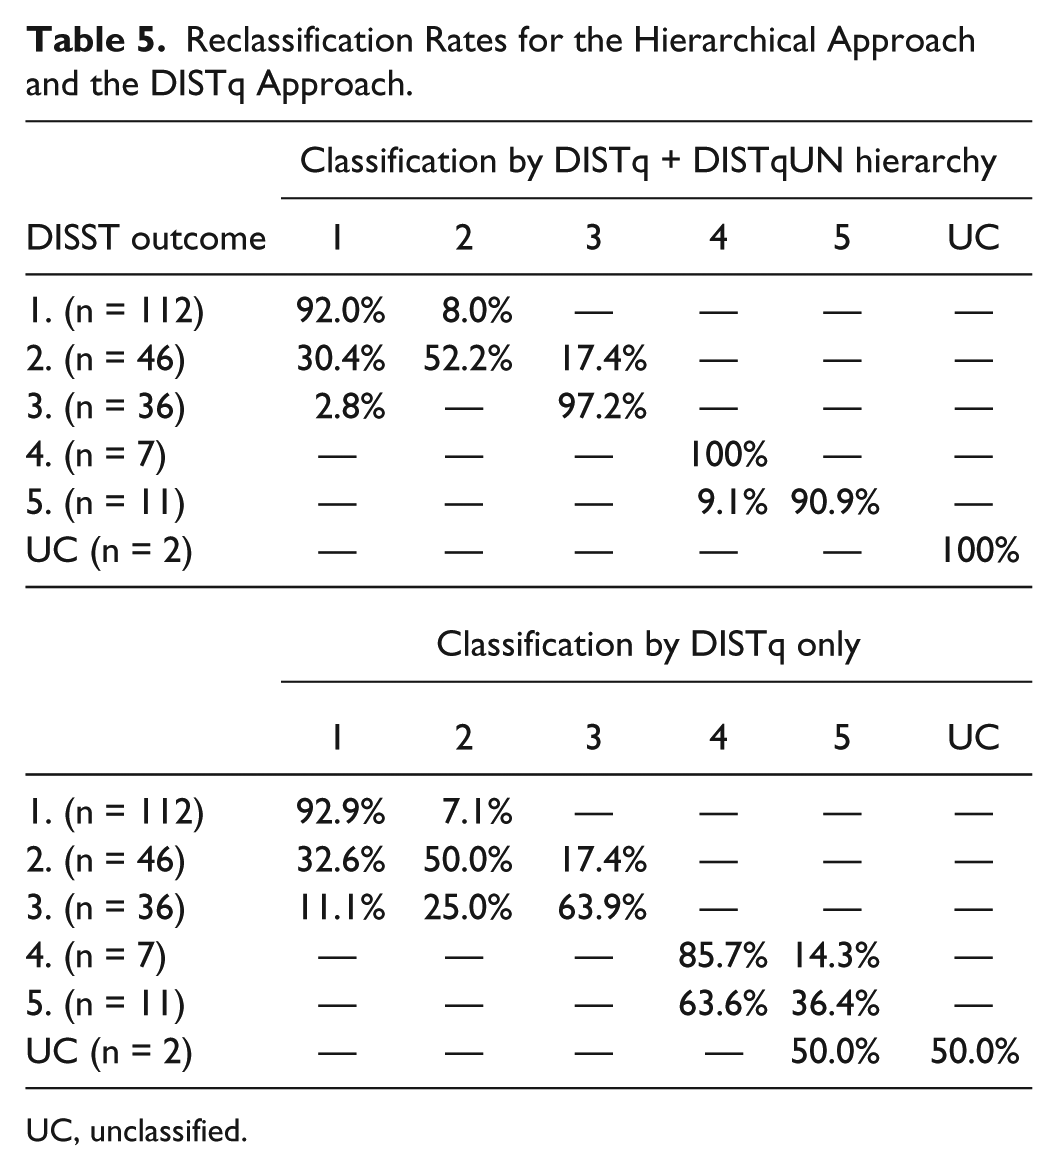
UC, unclassified.
Discussion
The SI value obtained by DISTq was equivalent (R = .88, c-unit = .94) to the hierarchical SI values (R = .90, c-unit = .95) in terms of its ability to replicate the values obtained by the fully sampled DISST (Figure 2, Table 4). Hence, if SI values are the only metric of importance to a particular application, there is no justification for the increased expenditure to obtain the necessary measurements for DISTqUN. However, the ability of a subject to secrete insulin is of paramount importance to early recognition of diabetes risk, pretreatment, screening applications, or studies that seek to determine the etiology of type 2 diabetes.35 -37
The hierarchical approach allows a low-cost method of obtaining insulin secretion information from only the individuals of interest, without the need for an additional test. The low-cost DISTq test uses the glucose data to determine the test participants level of insulin resistance in real time and provides an indication of where more expensive C-peptide assays will be most useful in describing the participants UN profile. While this study concentrated on the methods ability to reclassify participants in terms of SI and U2, the methodology will yield a full UN profile for all individuals classed as insulin resistant by the DISTq. Hence, clinicians will have information on the insulin resistant participants’ basal insulin secretion rate, first phase and second phase secretion rates and the ratio of first to second phase insulin secretion. 38
The DISTq estimates insulin secretion based on the participant’s insulin sensitivity.24,25,39 Hence, UN values from the DISTq are not patient specific and cannot be used for discrimination. The DISTq U2 values were evenly distributed about the 1:1 line with respect to the fully sampled DISST (Figure 3), indicating an limited bias across the cohort and confirming the overall DISTq approach. However, the individual U2 values obtained by DISTq were not sufficiently correlated to the values obtained with the fully sampled test to make accurate conclusions regarding the patients’ secretory capability (Figure 3). In contrast, DISTqUN captured U2 values that were very similar to the fully sampled DISST (R = .96, c-unit = .99, Table 3). Hence, the lower cost DISTqUN is capable of capturing patient specific insulin secretion characteristics that are critical to determining the individual’s location on the progression of diabetes (Figure 2, Table 3).8,14,40
Taking C-peptide samples at t = 0, 10, and 30 minutes allows direct and unique identification of UB, U1, and U2 for a minimal cost. These secretion metrics provide value for distinct clinical research and screening applications. UB quantifies the rate of insulin secretion required to maintain the fasting glucose rate and elevated rates have been linked to diabetes risk.3,41 U1 is sometimes referred to as the acute insulin response and becomes blunted during the establishment of diabetes. 42 Hence, it is an important aspect for the characterization of the metabolic responses of IGT and IFG participants. However, U1 values were not incorporated into the classification bins of this analysis to avoid excessive complexity of interpretation. U2 can determine how much insulin a healthy individual needs to release in response to glucose and how much an individual with diabetes is able to release in response to glucose. Hence, in healthy individuals, a lower secretion is often coupled with a higher SI and is preferable. In contrast, a lower U2 among individuals with diabetes is considered to imply an inability to produce sufficient insulin and is linked to the degree of hyperglycemia.8,14 In the full DISST, U2 showed the best discrimination of all secretion metrics. 22
Table 5 shows the ability of the hierarchical approach to reclassify the various states on the progression of type 2 diabetes and compares the classification determined by the DISTq alone. In comparison to the DISTq, the hierarchical approach showed particular improvement in the identification of hypersecretion in insulin resistant patients. However, both protocols exhibited similar ability to reclassify those in group 2. In both cases, a similar number of trial responses were incorrectly reclassified to IGT hypersecretory and NGT. Hence, the errors were due to reduced resolution in SI and UN. The DISTq parameter identification method estimates higher insulin secretion for patients with lower SI. Thus DISTq estimated higher insulin secretion rate than was measured for the insulin resistant individuals in the IFG hyposecretory group, and classified them in the IFG hypersecretory group.
BMI is an import risk factor for insulin resistance, the development of type 2 diabetes, and the metabolic syndrome.43,44 In this present study BMI showed some limited ability to determine the insulin resistance or hypersecretion. However, its diagnostic ability for insulin resistance fell well short of the DISTq and hierarchy approach and its diagnostic ability for hypersecretion was less than that of the hierarchy method. Interestingly, the rate of obesity increased as the grouping criteria described exacerbated states of type 2 diabetes. However, this cannot be used as a diagnostic as over 50% of the comparatively healthy group 1 test responses were from individuals that were classed as obese.
In this analysis, the retest threshold was set at an arbitrary value of SI < 7 × 10⁻⁴ mU.L-1.min-1. This value was close to the median DISTq SI value obtained. As, the recruitment criteria was weighted toward individuals who were at risk of developing type 2 diabetes, using an SI value close to the median is a reasonable estimate. Hence, the cohorts were moderately insulin resistant, and in a wider population, the retest rate would be considerably less. In particular, if the hierarchical approach were used in a diabetes risk screening program, approximately >30% of a Western population could be excluded prior to testing due to age, existing diabetes, or levels of physical exercise. Only ~30% of the population would require the up-sampled test and the cost per participant could be as low as NZ$36 of assay cost per person on average. Importantly, the DISTq only requires glucose measurements, and as these are typically available in real time, the test result would be known immediately and thus whether reassay of test samples for C-peptide is necessary would also be known immediately.
It should be noted that the fasting glucose measurement could not be used in a hierarchy to instigate a higher accuracy test. In particular, only 18 of 214 tests yielded elevated basal glucose measurements whereas 102 of 214 exhibited signs of metabolic risk as defined by the SI threshold. If only those that had elevated basal glucose levels underwent a DISST test, all participants that were in groups 2 and 3 would not be recognized as at risk of metabolic dysfunction given their reduced insulin sensitivity or secretory capability.16 -19 Individuals in groups 2 and 3 are perhaps of the greatest importance to screening and clinical research into the pathogenesis of type 2 diabetes.
Furthermore, this analysis yields insulin secretory information that provides a more complete observation of a patient’s glycemic metabolism than would be possible with HbA1c measurements. In particular, HbA1c is a measure of average daily glucose 45 and is thus not able to directly observe or delineate changes in insulin secretion capability, insulin sensitivity or nutritional intake. In particular, individuals in groups 3 and 4 can potentially maintain moderately healthy glucose levels despite insulin resistance by maintaining insulin hypersecretion. 13 It has been shown that hypersecretion is an important risk-factor for the development of type 2 diabetes.11,12 This critical condition on the pathogenesis of type 2 diabetes would be undetectable with HbA1c.
This proof of concept study was conducted using data from 71 nondiabetic women who met the recruitment criteria of an increased risk of developing diabetes. Increased risk was defined as a BMI greater than 25 kg.m-2 or a BMI greater than 23 kg.m-2 coupled with a family history or ethnic disposition toward diabetes. Hence, the cohort yielded glycemic abnormalities such as IGT, IFG, prediabetes, and hypersecretion with a greater rate of incidence would be expected from the general nondiabetic public. As the proposed hierarchy of tests was intended to exist in a wider hierarchy wherein those that are not considered at risk are not tested, this cohort was appropriate to measure the efficacy of the approach.
However, testing the efficacy of the overall approach for population screening should be undertaken with quite different experimental design. In particular, screening is only of value if it can prompt intervention that has long lasting patient benefits and lessens the economic burden on health care systems. Testing the efficacy of the overall approach must incorporate some intervention to mitigate or offset the onset of diabetes and precisely quantity the potential for successful intervention and resulting economic costs and benefits.
Measuring insulin sensitivity is often limited to epidemiological studies of type 2 diabetes or the metabolic syndrome. One of the barriers to more widespread uptake of such tests is the cost involved with established tests that are known to have sufficient accuracy. The hierarchical approach presented here was intended to yield the maximum possible information for a minimal cost. Hence, those that were deemed healthy at a cost of NZ$5 did not have their test samples reassayed. Those that were indicated to have lower insulin sensitivity with the lower cost test had blood samples that previously obtained in the DISTq protocol reassayed for C-peptide. The reassay allowed both a more accurate SI value, and patient specific insulin secretion characteristics to be obtained.
Conclusions
We have presented a novel hierarchical approach for low-cost and informative glycemic testing. The hierarchy allows many participants to be classified as healthy with a relatively inexpensive test, and can reclassify the remaining individuals for a moderate increase in cost, and no further clinical protocol. Hence, clinical research and screening applications that were previously impossible due to the high cost of the available insulin sensitivity and secretion tests may now be feasible. However, an economic analysis of the cost and potential benefits of such programs must be fully considered in further study.
Footnotes
Appendix
The DISTq UN profiles were estimated via an a posteriori function of insulin sensitivity, and were thus quite different to the profiles determined by the fully sampled DISST. The median absolute difference between the DISTq and DISST UN profiles was 3.56 mU⋅L-1⋅min-1 (IQR: 1.42 to 8.48 mU⋅L-1⋅min-1). In contrast, the profiles determined via DISTqUN were more similar to the fully sampled DISST. The median absolute difference in UN values was 0.69 mU⋅L-1⋅min-1 (IQR: 0.11 to 1.86 mU⋅L-1⋅min-1). Figure A1 shows the differences between the UN profiles determined by the approaches.
Abbreviations
BMI, body mass index; DISST, dynamic insulin sensitivity and secretion test; DISTq quick dynamic insulin sensitivity test; IGT, impaired glucose tolerance; NGT, normo-glucose tolerant; SI, insulin sensitivity.
Declaration of Conflicting Interests
The author(s) declared no potential conflicts of interest with respect to the research, authorship, and/or publication of this article.
Funding
The author(s) received no financial support for the research, authorship, and/or publication of this article.