
Abstract
Background:
A biosimilar product is expected to exhibit similar safety, efficacy, and quality as that of the approved reference product. Only a few reports of thorough evaluation of the quality of insulin glargine biosimilars are available in literature. Here, we examine the structural and functional similarity of biosimilars of insulin glargine, the first basal long-acting insulin analogue with respect to its innovator product (Lantus® from Sanofi Aventis).
Methods:
Structural similarity was established using mass spectrometry, chromatographic, and spectroscopic techniques. Stability was compared by performing accelerated thermal stress studies. Functional similarity was established via in vitro assay.
Results:
Biosimilar 4 exhibited greater content of high molecular weight species (HMWs) (0.80%) and related substances (RS) (0.45±0.06%) vs others (HMWs of 0.04% and RS of 0.17%). Biosimilars 1 and 3 exhibited higher rate of impurity generation (0.78% and 0.73% per week, respectively), as compared with other drug products (0.02% to 0.43% per week). Furthermore, %aggregation at 14 days was found to statistically correlate (R2= 0.99, root mean square error (RMSE) = 0.095) with %aggregation at 0 day (linearly) and the number of months from expiry (nonlinearly), highlighting the overpowering impact of the latter.
Conclusions:
While an overall structural and functional similarity was observed across insulin glargine biosimilars with respect to the innovator product, low amounts of product-related variants were seen in some biosimilars and these impact product stability. The %aggregation at 14 days exhibits statistical correlation with %aggregation at 0 day and the number of months from expiry. The order of biosimilarity was denoted as Lantus®>Biosimilar 2>Biosimilar 4>Biosimilar 1>Biosimilar 3.
Introduction
A biosimilar product is expected to exhibit similar safety, efficacy, and quality as that of the approved reference product. 1 To reduce the burden of clinical and nonclinical studies, the critical quality attributes (CQAs) need to be compared with their reference product in a systematic manner.2,3 Most regulatory guidelines emphasize on extensive physiochemical and biological characterization, followed by clinical studies to ensure similarity between the reference biotherapeutic and the respective biosimilars. 1 Greater, the amount of data supporting the structural and functional comparability, lesser will be the reliance on clinical studies for demonstrating biosimilarity. 4 Human insulin (Humulin® R), being the first biotherapeutic to be approved, is a well-studied molecule. 5 However, only a few reports exist in public domain on thorough evaluation of the quality of biosimilars of insulin and its analogues.6 -9
Insulin glargine is the first basal long-acting insulin analogue produced in Escherichia coli by recombinant DNA technology. Its onset of action starts within 90 minutes, and it remains active for 24 hours long in diabetes mellitus patients. Its lower aqueous solubility at physiological pH results in delayed absorption and slower release.10,11 Insulin glargine differs from human insulin, where asparagine (Asp) is replaced by glycine (Gly) at position A21 along with two additional arginine (Arg) at C-terminus of B chain. Chemically, it is 21AGly-30Ba-L-Arg-30Bb-L-Arg-human insulin with a molecular weight of 6063 Da. Overall, the additional positive charge shifts its isoelectric point (pI) towards physiological pH which makes it less soluble at the site of injection and further causes delayed absorption.10,12,13 The innovator product (Lantus®, Sanofi Aventis) was approved by the United States Food and Drug Administration (USFDA) in April 2000, followed by the European Medicines Agency (EMA) in June 2000.14,15 The patent on Lantus expired in 2014 in both USFDA and EMA and thereafter several insulin glargine biosimilars have been approved or are in development. 15
In the present study, 2 batches of 4 insulin glargine biosimilars available in Indian market, namely Glaritus (Wockhardt Ltd), Basaglar (Eli Lilly), Basugine (Lupin), and Basalog (Biocon) were assessed against Lantus® by means of an extensive range of advanced analytical methods to evaluate structural and functional similarity. Primary structure (molecular mass, amino acid sequence, structural modifications, and disulfide linkages) was confirmed using reverse phase–high-performance liquid chromatography (RP-HPLC) coupled with electrospray ionization-time-of-flight-mass spectrometer (ESI-TOF-MS). Higher order structure was evaluated by circular dichroism (CD), Fourier transform infrared (FTIR), and fluorescence (FLR) spectroscopy. Protein quantification, purity, and product-related variants were examined by RP-HPLC and size exclusion–HPLC (SE-HPLC). Excipient estimation was carried out by RP-HPLC and atomic absorption spectroscopy (AAS). Stability was assessed by performing accelerated thermal stress studies followed by SE-HPLC. Functional characterization was performed using glucose-uptake (in vitro) assay. Materials and methods have been described in detail in Electronic Supplementary Material(ESM) 1. The batch and expiry details of all the drug products (DPs) are given in Table S1 in ESM 2.
Results
Side-by-side comparison was performed to examine analytical similarity of insulin glargine biosimilars with respect to Lantus® as per the regulatory requirements.16,17 The study has been carried out in triplicates wherever required, and the data presented are the average of the data obtained. Results have been tabulated in detail in ESM 2. Table 1 summarizes the structural and functional similarity results for 2 batches of 4 insulin glargine biosimilars approved in Indian market with respect to Lantus®.
Summary of Analytical Tools Adopted for the Structural and Functional Similarity Assessment of Insulin Glargine Innovator and Biosimilar Products.
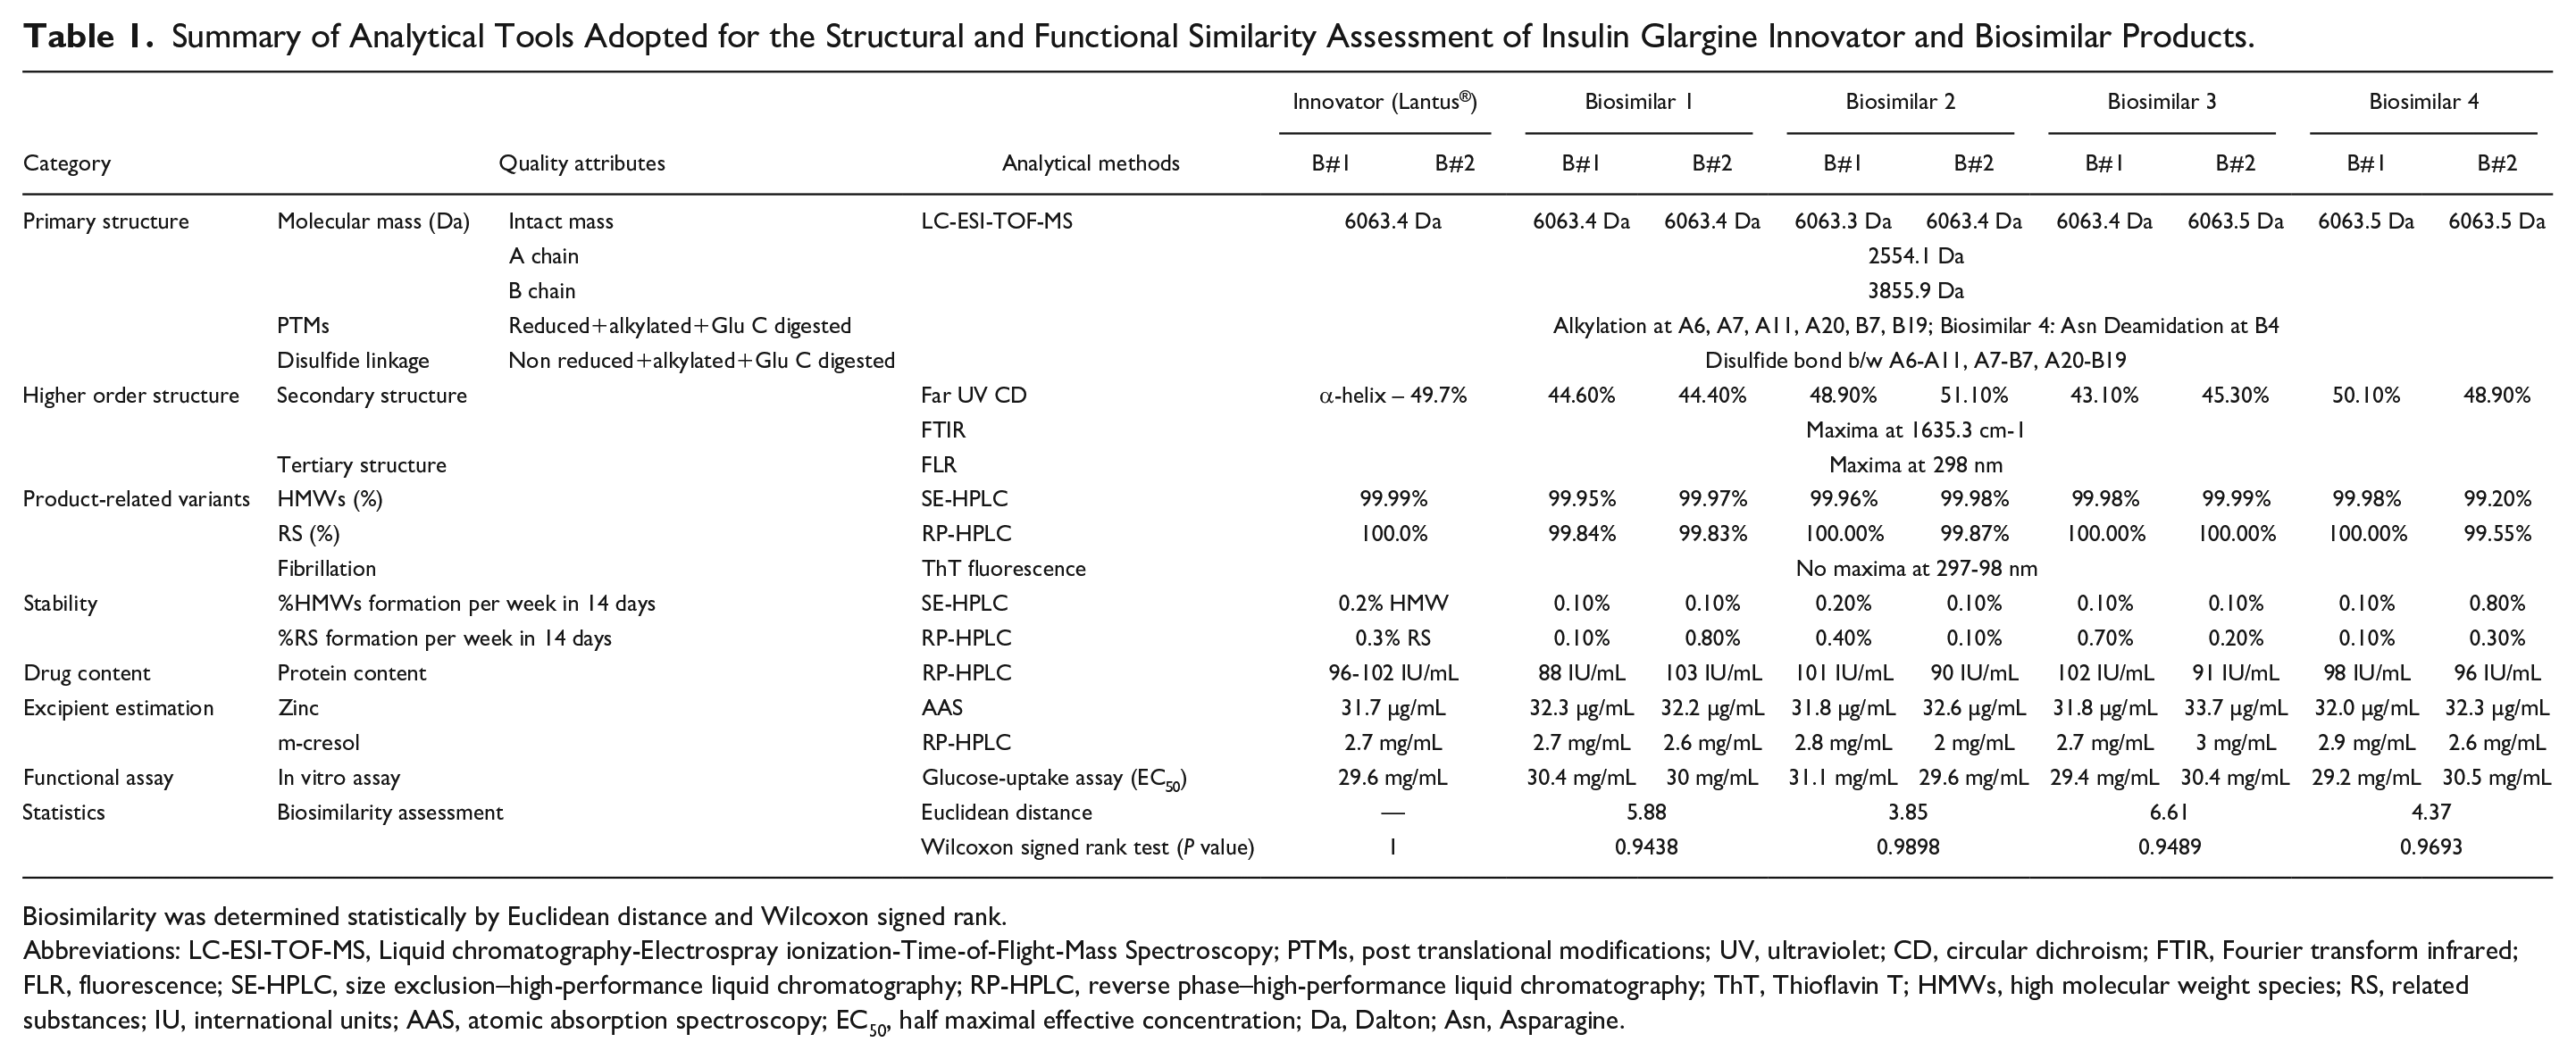
Biosimilarity was determined statistically by Euclidean distance and Wilcoxon signed rank.
Abbreviations: LC-ESI-TOF-MS, Liquid chromatography-Electrospray ionization-Time-of-Flight-Mass Spectroscopy; PTMs, post translational modifications; UV, ultraviolet; CD, circular dichroism; FTIR, Fourier transform infrared; FLR, fluorescence; SE-HPLC, size exclusion–high-performance liquid chromatography; RP-HPLC, reverse phase–high-performance liquid chromatography; ThT, Thioflavin T; HMWs, high molecular weight species; RS, related substances; IU, international units; AAS, atomic absorption spectroscopy; EC50, half maximal effective concentration; Da, Dalton; Asn, Asparagine.
Primary Structure
Molecular Mass
ESI-TOF-MS spectra were extracted from the total ion chromatogram (TIC), corresponding to intact protein eluting at 23.7 minutes for all DPs. Four main ionization states of 867 m/z (+7), 1011 m/z (+6), 1213 m/z (+5) and 1516 m/z (+4) were obtained with the most abundant ion assigned to [M+6H]6+. Upon deconvolution, it revealed monoisotopic masses of 6063.39 Da and 6063.42 Da (mass error = 10 ppm) for Lantus® batches 1 and 2, respectively (Figure 1a). Additional post peaks including 6085.1 Da, 6106.7 Da, and 6128.8 Da were sodium adducts. The maximum mass deviation of biosimilars from Lantus® across batches was observed to be that of 0.13 Da (Table S2 in ESM 2).
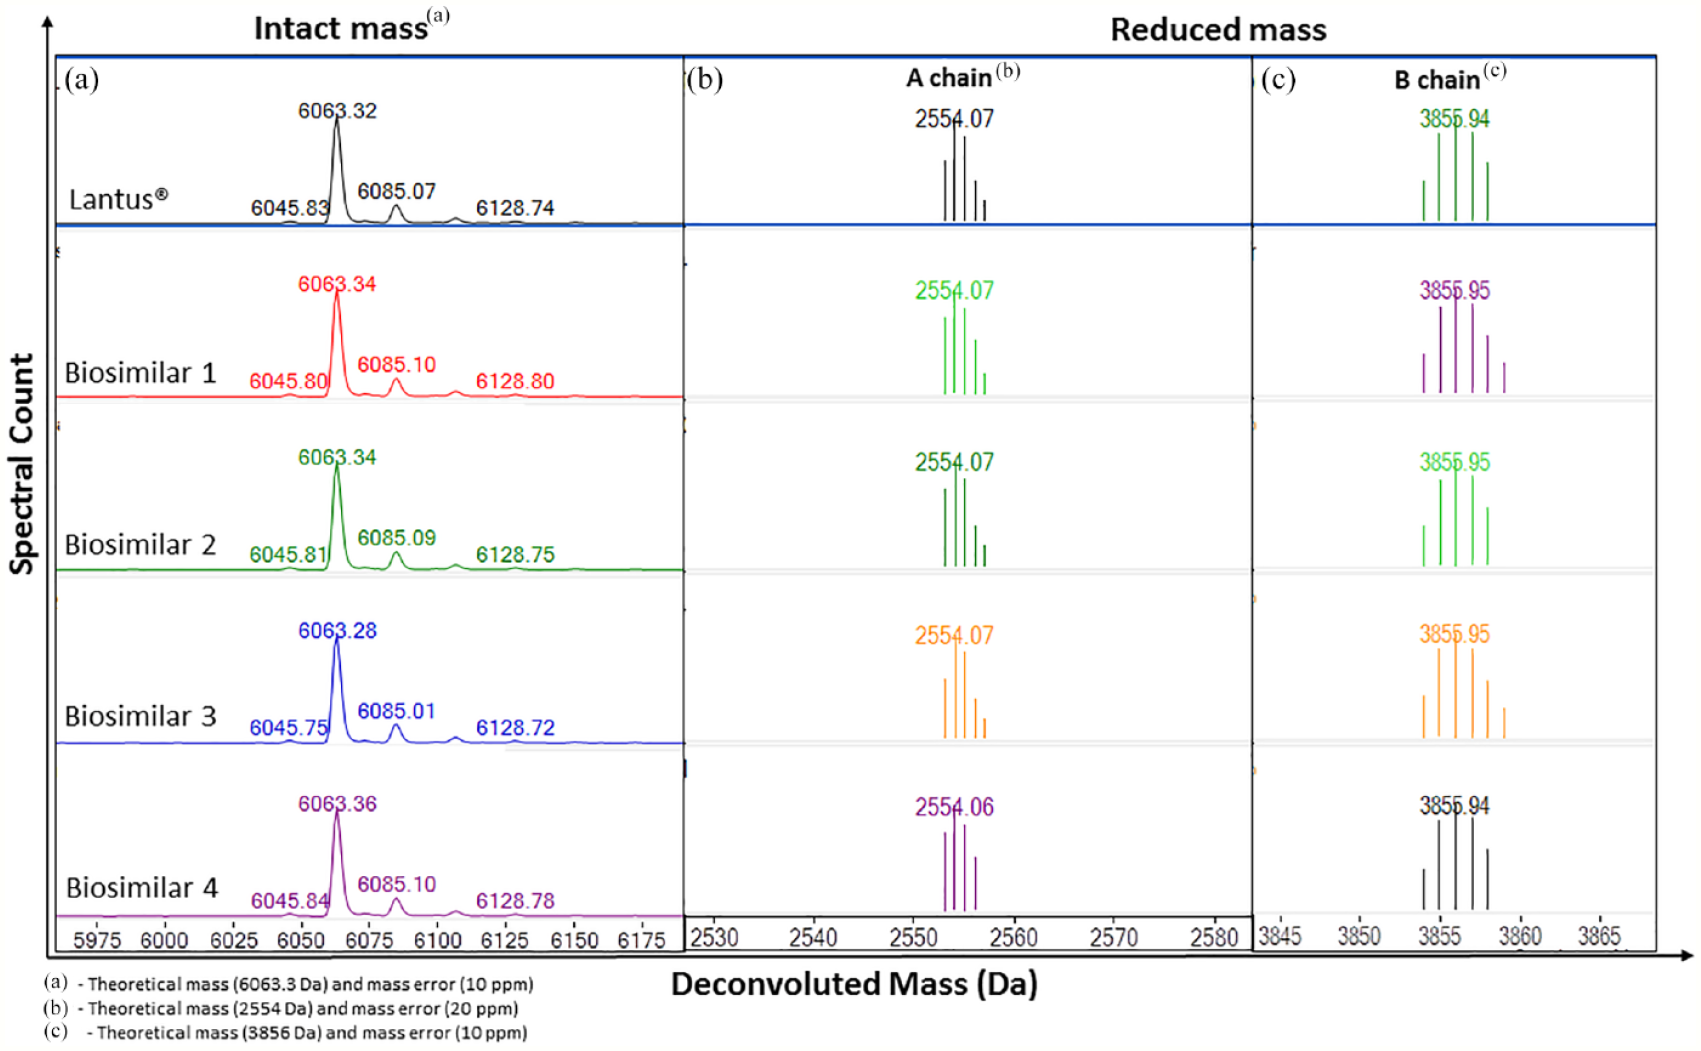
Intact and reduced molecular masses of insulin glargine biosimilars. Deconvoluted electrospray ionization-time-of-flight (ESI-TOF) mass spectra for (a) intact mass, (b) A chain, and (c) B chain comparing insulin glargine innovator and biosimilars for batch 1. Abbreviation: Da, dalton.
Insulin glargine was further reduced to A chain and B chain and analyzed to yield two peaks eluting at 25.4 and 22.6 minutes, respectively, with monoisotopic masses of 2554.07
Peptide Mapping
Lantus® and insulin glargine biosimilars were digested using Glu C under reducing condition and generated seven peptides eluting from 24.2 to 31.6 minutes for all DPs. The peak pattern (TIC, number, and abundance of peaks) resulted in slight difference in peptide masses, retention times, and peak intensities (Figure 2a and Table S3 in ESM 2). Upon mass matching, protein sequence coverage of 100% was obtained, and the occurrence of alkylation of Cys residue at positions A6, A7, A11, A20, B7, and B19 was confirmed for all DPs. Deamidation of asparagine (Asn) and glutamine (Gln) in insulin occurred at Asn A18, Asn A21, Asn B3 and Gln A5, Gln A15, Gln B4; also, Asn A21, Asn B3, and Gln B4 were suggested to contribute towards amyloid fibril formation and thus need to be thoroughly evaluated.18,19 In insulin glargine, Asn A21 is replaced by Gly, thereby increasing the stability and solubility of the insulin analog in acidic condition.20,21 Absence of deamidation at Asn B3 and Gln B4 indicated higher level of stability for all DPs except for Biosimilar 4 with occurrence of deamidation at Gln B4, and needs further assessment (Table S3 in ESM 2). 18
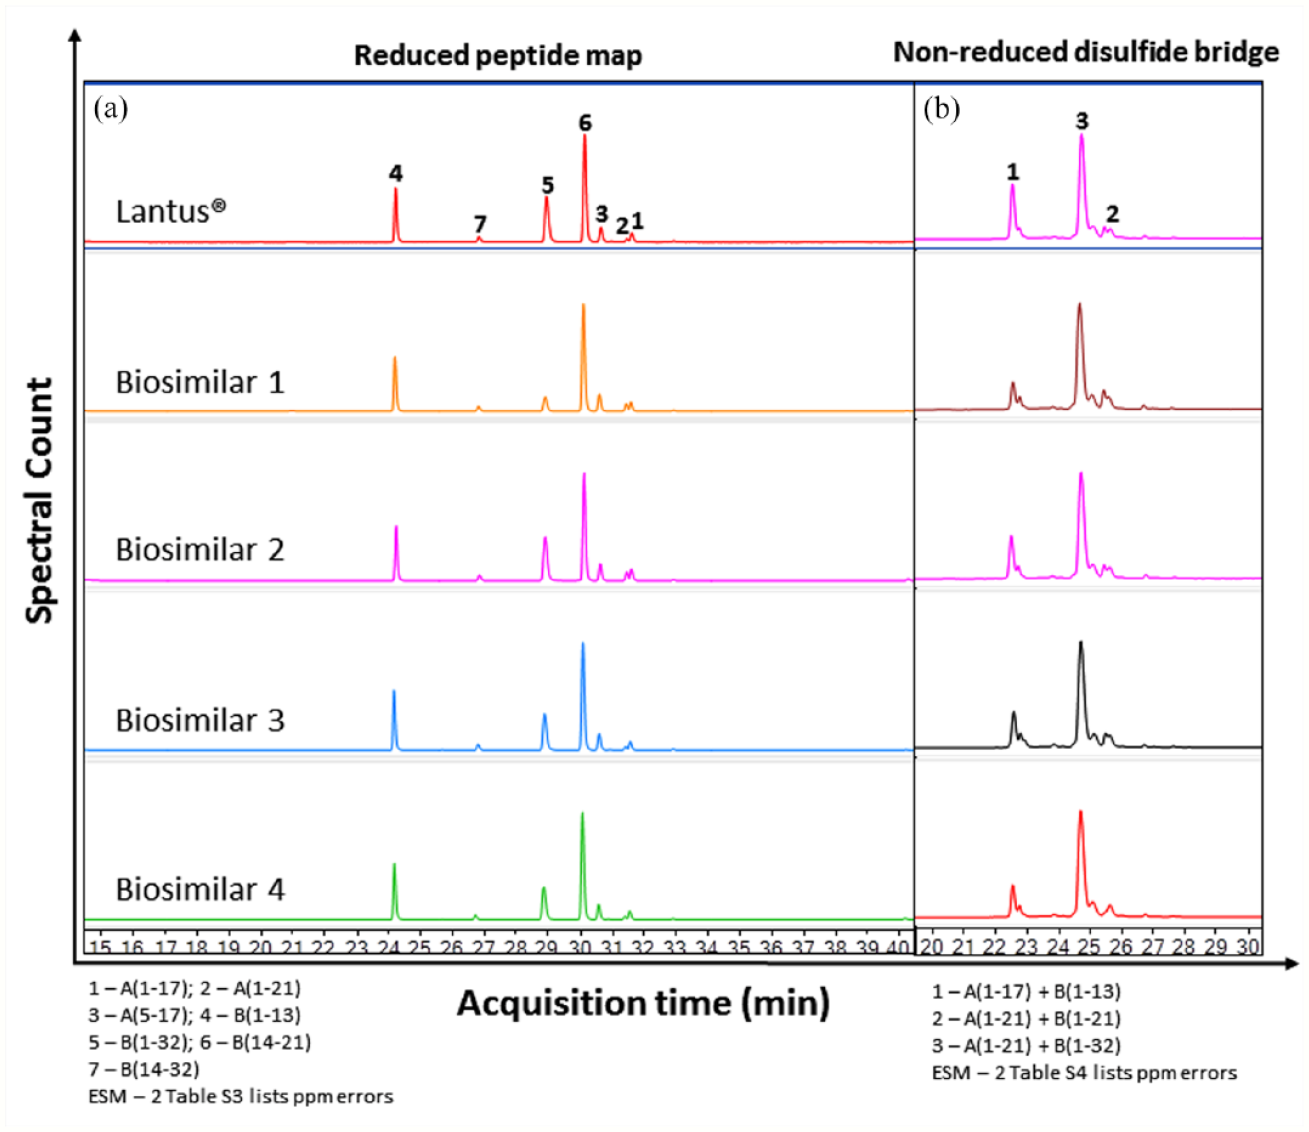
Peptide mapping and disulfide bridging of insulin glargine. Base peak chromatogram (BPC) for (a) reduced, and (b) non reduced drug products (DPs) obtained from electrospray ionization-time-of-flight (ESI-TOF) mass spectra upon Glu C digestion comparing insulin glargine innovator and biosimilars for batch 1. Abbreviations: ESM, Electronic Supplementary Material; ppm, parts per million.
Disulfide Bridging
Cys-linked disulfide bonds and presence of native disulfide links need to be evaluated through disulfide bridging. To retain the presence of disulfide links in insulin glargine, all the DPs were alkylated and Glu C digested without reduction and generated of three disulfide-linked peptides eluting from 22.7 to 26.7 minutes for all DPs. The results obtained were comparable with the theoretical values reported in a similar study involving characterization of MYL-1501 (a proposed insulin glargine biosimilar). 9 The peak pattern resulted in comparable chromatograms with slight difference in peptide masses and retention times (RT) (Figure 2b). Cys-linked peptides at positions A6-A11, A7-B7, and A20-B19 were confirmed for all DPs (Table S4 in ESM 2).
Higher Order Structure
The secondary structure was assessed via far-ultraviolet (UV) CD and FTIR spectroscopy. CD spectra showed two characteristic negative peak maxima at 208 and 222 nm, indicating the presence of alpha (α)-helix rich protein (Figure 3a). FTIR spectra and its second derivative (Figure 3b and c) also showed agreement with the published crystal structure of insulin glargine, with α-helix as the major secondary structure contributor. A recent report on characterization of insulin glargine also stated it to be α-helix dominant. 9 The tertiary structure was assessed using tyrosine (Tyr) FLR spectroscopy. Upon excitation at 276 nm, Try FLR exhibited λmax at 298 nm ±2 nm), with peak intensity of 52.49 and 59.82 AU for Lantus® batches 1 and 2, respectively (Figure 3d and Table S5 in ESM 2). Environment of chromatophores (intrinsic) in insulin glargine formulation was found in agreement with the theoretical values as well as a recent report on characterization of proposed biosimilar of insulin glargine. 9 Therefore, all insulin glargine biosimilars were found to compare well with Lantus® (Table S5 in ESM 2).
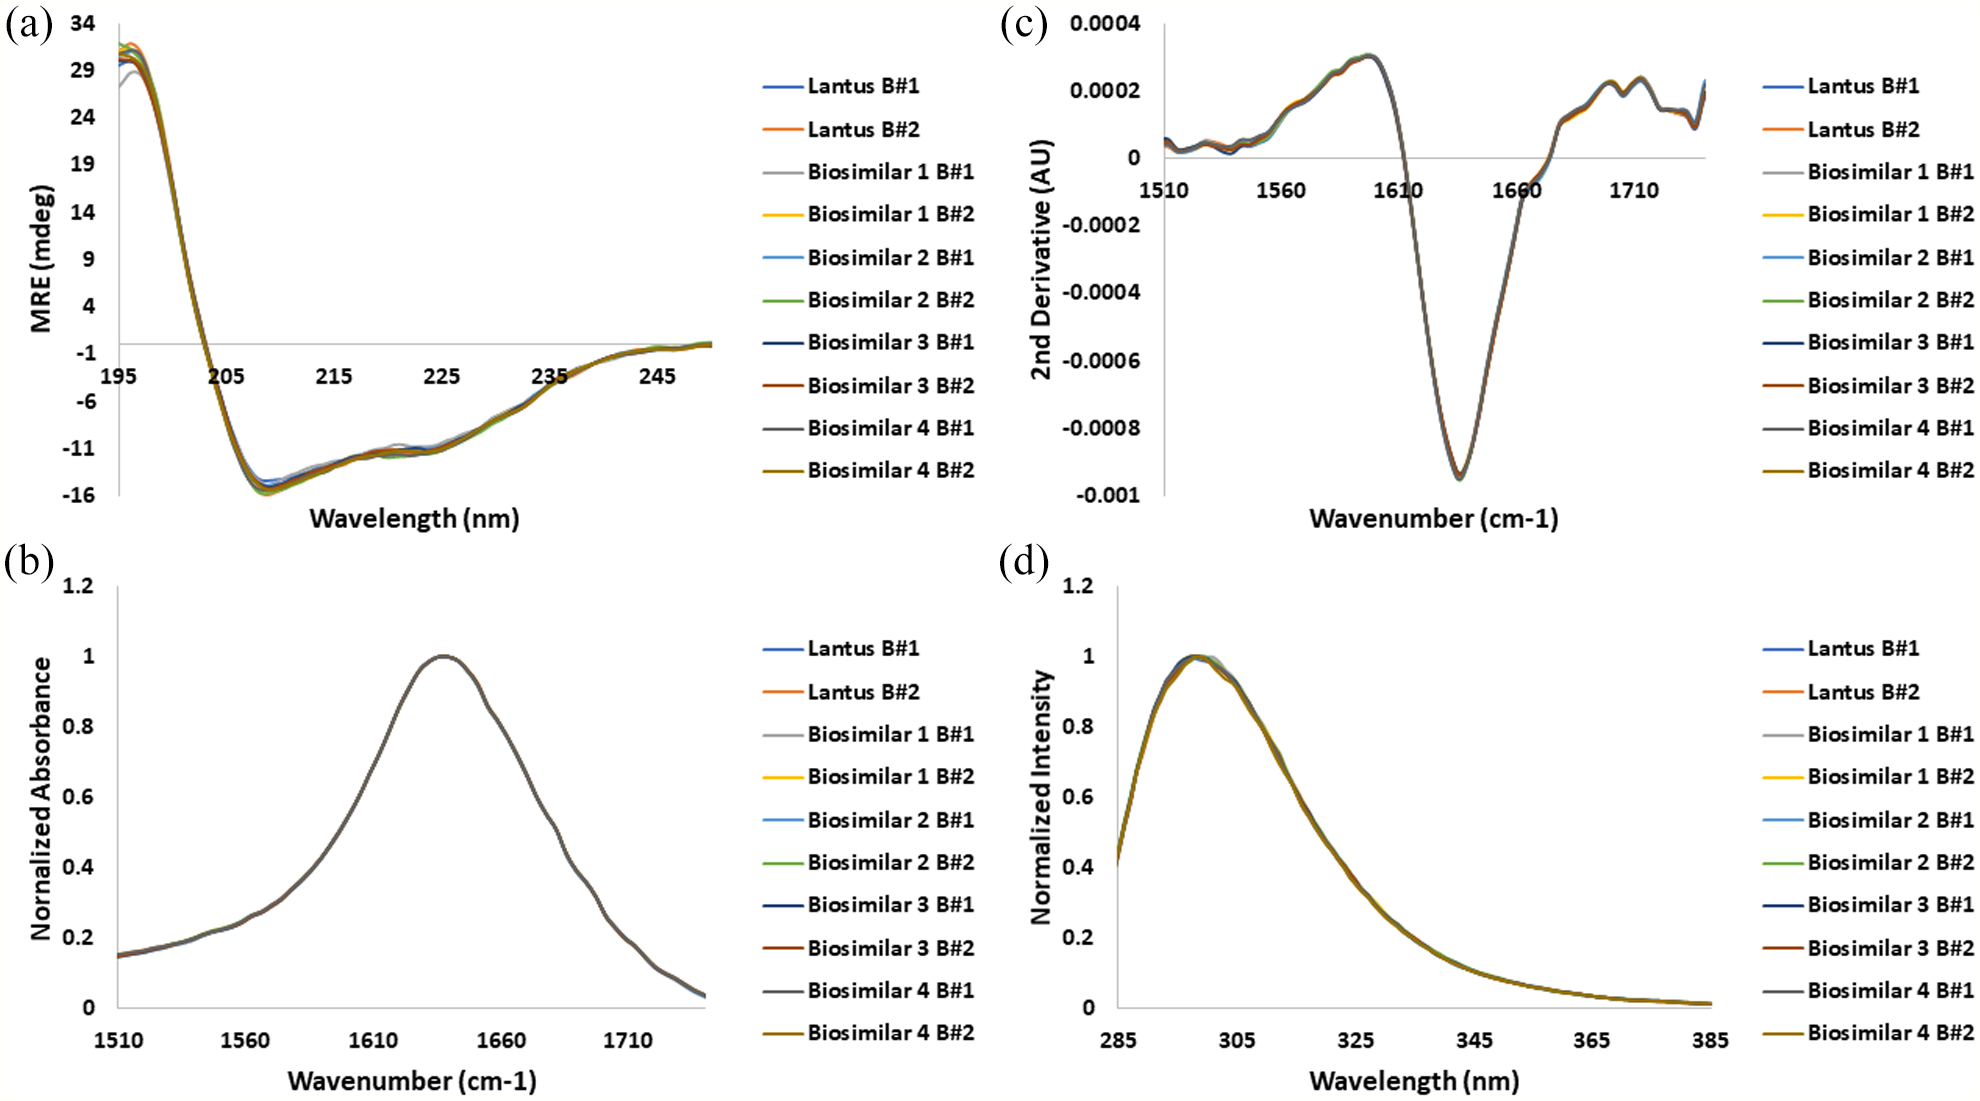
Higher order structure of insulin glargine. (a) Far UV CD spectra, (b) FTIR spectra, (c) secondary derivative of FTIR spectra, (d). Tyrosine fluorescence spectra at 295 nm comparing insulin glargine innovator and biosimilars for batches 1 and 2. Abbreviations: UV, ultraviolet; CD, circular dichroism; FTIR, Fourier transform infrared spectroscopy; MRE, mean residue ellipticity; AU, absorbance units.
Product-Related Variants
RP-HPLC and SE-HPLC were used to examine purity of all the DPs. Protein was quantified by a quick isocratic RP-HPLC method and indicated presence of a protein peak at 4.54 minutes for all the DPs (Figure 4a). The protein content was found to be in the range from 87 to 103 IU/mL (Table S1 in ESM 2). Maximum deviation of biosimilars from Lantus® across batches was observed for Biosimilar 2 batch 1 (14 IU/mL) and Biosimilar 3 batch 2 (12 IU/mL).
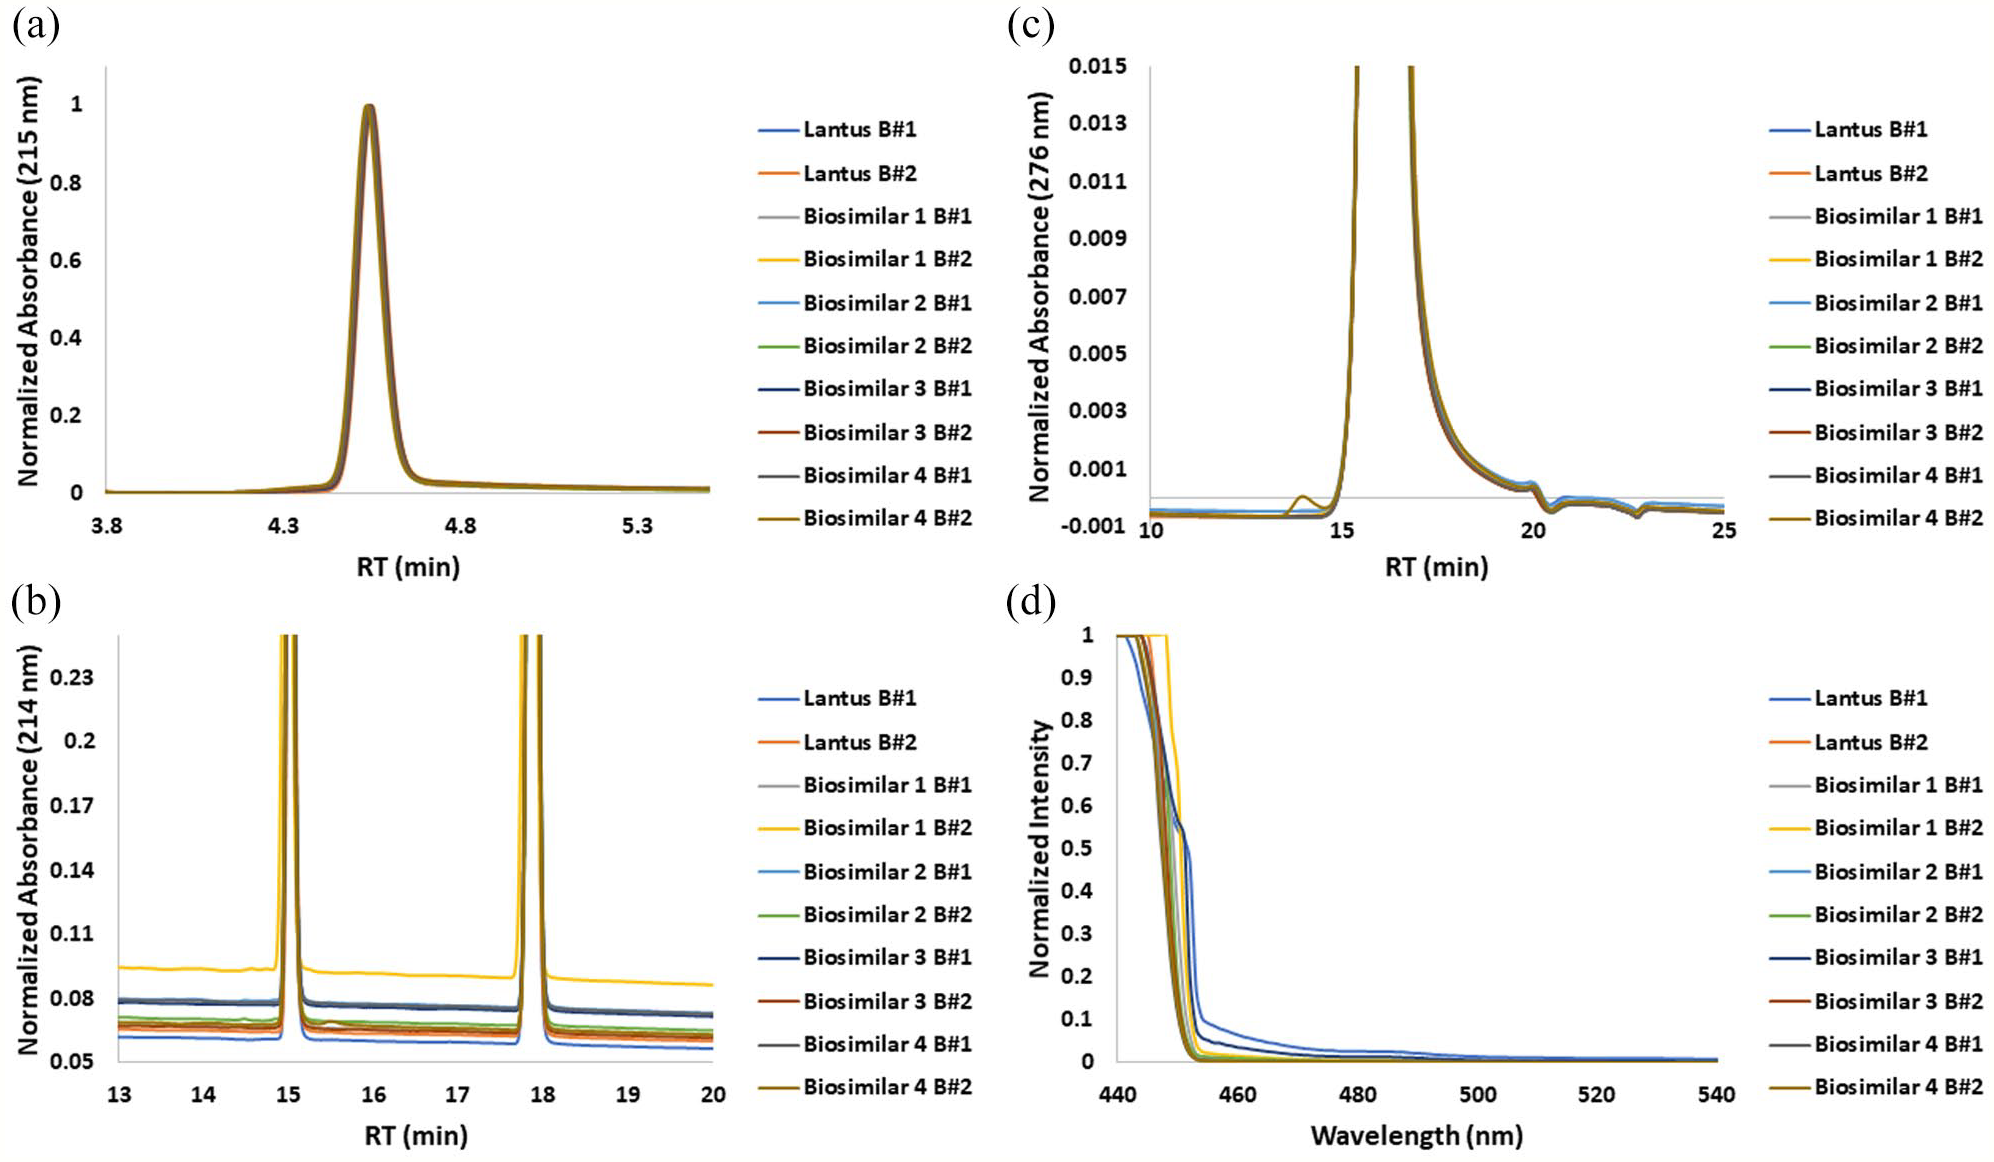
Size and charge heterogeneity of Insulin Glargine. (a) Reverse phase chromatogram for protein quantification, (b) Reverse phase chromatogram for deamidated forms, (c) Size exclusion chromatogram for size heterogeneity, (d) Extrinsic Thioflavin T fluorescence spectra at 490 nm for aggregated forms comparing insulin glargine innovator and biosimilars for batches 1 and 2. Abbreviation: RT, retention time.
Reduced and oxidized variants were evaluated by RP-HPLC and indicated presence of main peak at 15.02 minutes and m-cresol peak at 17.85 minutes (Figure 4b). Upon integration, main peak was found to be >99% for all the DPs. It was further observed that one biosimilar (Biosimilar 2 (0.13±0.05%)) exhibited a peak eluting prior to the main peak at 14.85 minutes and three biosimilars (Biosimilar 1 (0.16±0.07%), Biosimilar 2 (0.17±0.03%), and, Biosimilar 4 (0.45±0.06%)) exhibited a peak eluting later to the main peak at 15.5 minutes. The results indicated presence of low amount of oxidized and reduced variants, with a maximum deviation of 0.18% and 0.51% across batches between Lantus® and the insulin glargine biosimilars (Table S6 in ESM 2).
Monomeric content was quantified by SE-HPLC and indicated presence of a main peak from 16.25 to 16.28 minutes (Figure 4c). Upon integration, main peak was found to be 100% for all DPs except Biosimilar 4 batch 2, which exhibited a peak eluting prior to the main peak at 14 minutes and indicated presence of low amount of higher molecular weight species (HMWs) (0.22±0.01%; Table S6 in ESM 2). ThT FLR assay showed an absence of increase in fluorescence at 490 nm and indicated aggregation below the detection limit (Figure 4d).
Accelerated Stability Studies
Accelerated stability studies were carried out by investigating the effect of elevated temperature (40°C) on the stability of DPs over a period of 14 days by characterizing product-related variants, ie, HMWs and related substances (RS) formed per week. There are few product-related variants reported in literature because of truncation at N-terminal of all insulin derivatives and these truncations generated derivatives of desPheB1, pyroGluB4, and desPheB1-N-formyl-ValB2. 20 Also, a few other modifications due to oxidation of Arg, Cys, histidine (His), lysine (Lys), and proline (Pro) residues in glycated and nonglycosylated insulin derivatives have also been reported. 22 Asn deamidation at A21, B3, and Gln deamidation at B4 in insulin also play a critical role in formation of product-related variants.18,23,24 According to the European Pharmacopoeia (EP) 01/2008:2085 (6.0), the impurities other than that specified in monograph should be within 0.50%. 17
Figure 5a and b present the results of the 14 day stability study performed on insulin glargine innovator and biosimilar products. It was observed that only soluble aggregates were formed due to lack of visible turbidity. One batch of Biosimilar 4 showed elevated HMW (2.4%); one batch of Lantus® and Biosimilar 4 generated HMWs at a rate of 0.5% and 0.8% per week, respectively (Table S7 in ESM 2). Also, one batch of Biosimilar 1, Biosimilar 2, Biosimilar 3, and Biosimilar 4 formed RS at a rate of 0.78%, 0.43%, 0.74%, and 0.32% per week, respectively (Table S8 in ESM 2). Rate of HMW or RS formation per week was calculated as relative values after deducting the initial values (0 day) from the end values (14 days).
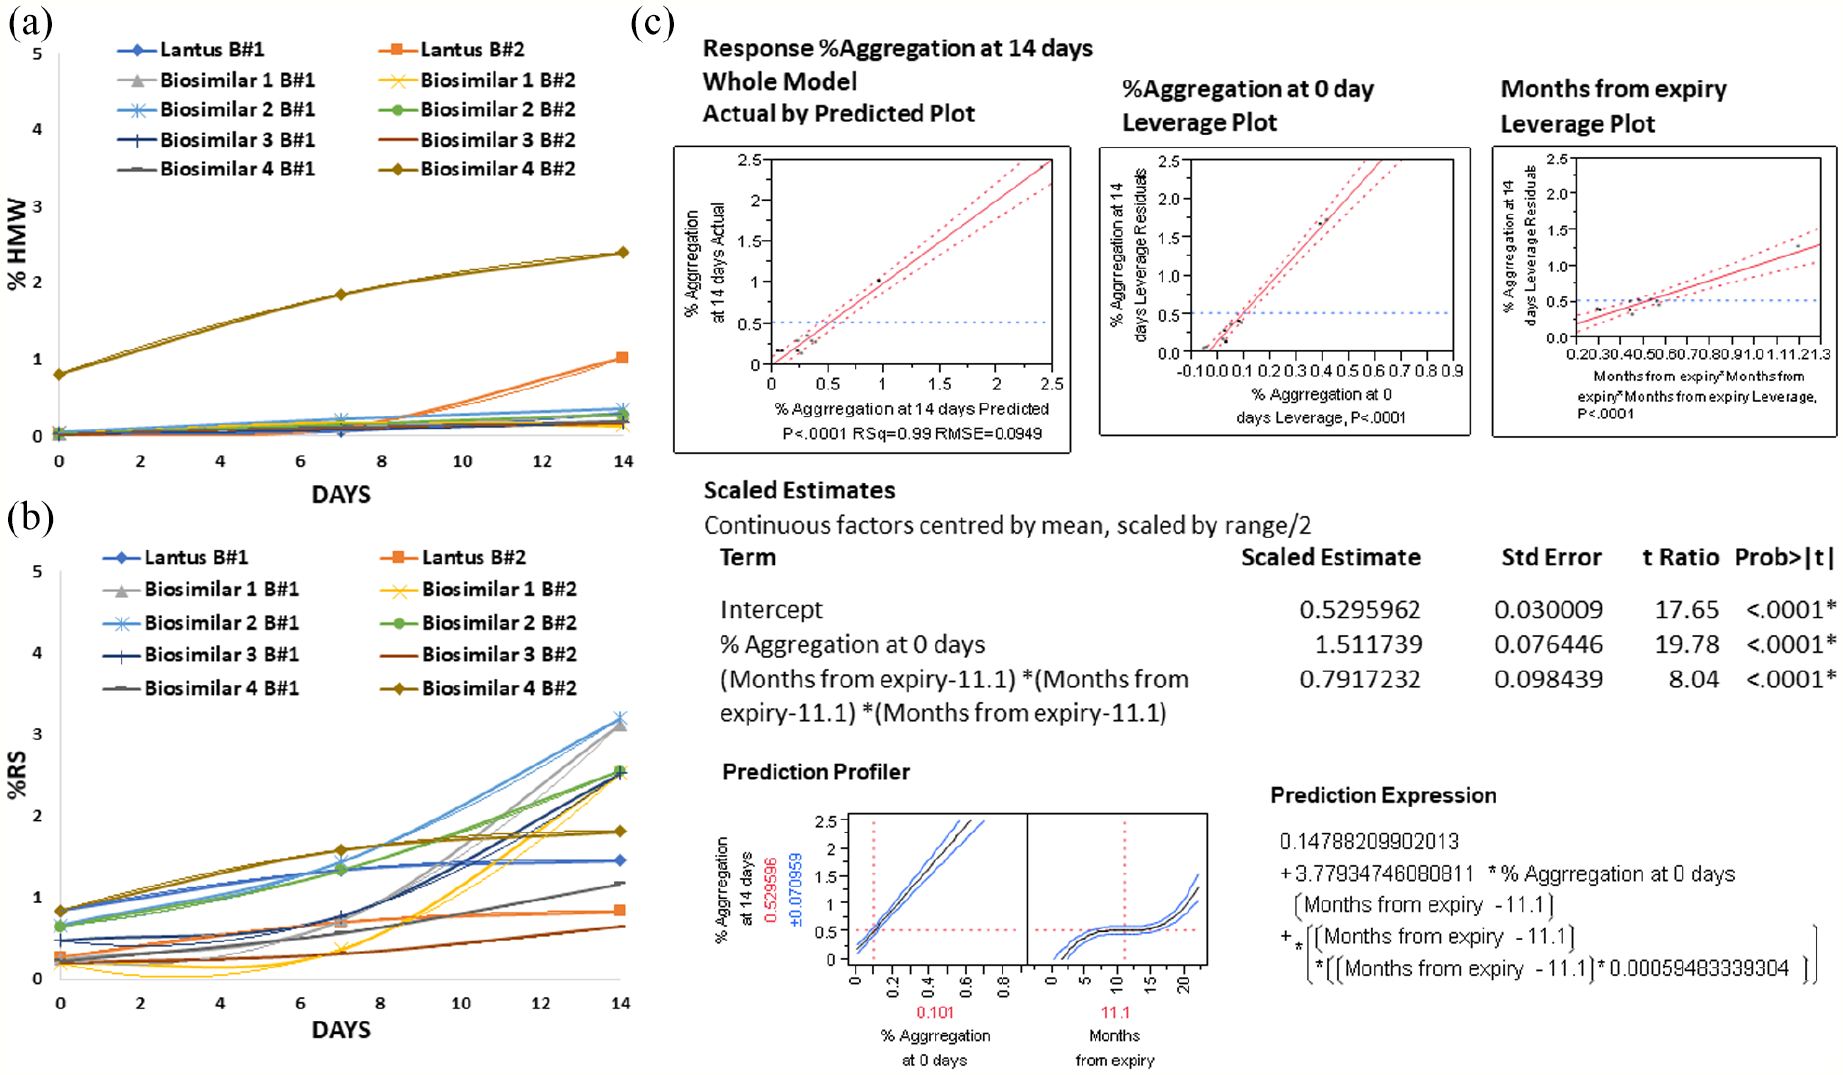
Results of the 14-day stability study of insulin glargine biosimilars. (a) Size exclusion chromatogram showing aggregation on Day 0, 7, and 14, (b) Reverse phase chromatogram showing total impurities formed on Day 0, 7, and 14, (c) Summary of the regression model developed for %aggregation at 14 days (Y) as a function of %aggregation at 0 day and months from expiry (X). * means statistically relevant. Abbreviations: HMW, high molecular weight; RS, related substances; RMSE, root mean square error.
Furthermore, a statistical model was developed to correlate the %aggregation in 14 days to %aggregation on 0 day and the number of months from expiry. The resulting empirical model has been illustrated in Figure 5c and was statistically relevant (R2 = 0.99, RMSE = 0.095). It was interesting to know that while the dependence on %aggregation on 0 day was linear, it was nonlinear for number of months from expiry (raised to the power 3). This signifies the overpowering impact of the latter on %aggregation. As expected from this correlation, Biosimilar 4 batch 2 (expired on September, 2019) exhibited highest rate of aggregation with %HMW of 0.8% on day 0, which increased to 2.4% in 14 days.
UV Spectroscopy
UV absorption spectra at wavelength from 200 to 400 nm yielded characteristic peak maxima at 270 nm (Figure 6a), which scales linearly with protein concentration in solution. The absorption intensity or protein concentration of insulin and its analogues can be measured at 270 nm using UV-Vis spectroscopy. 25
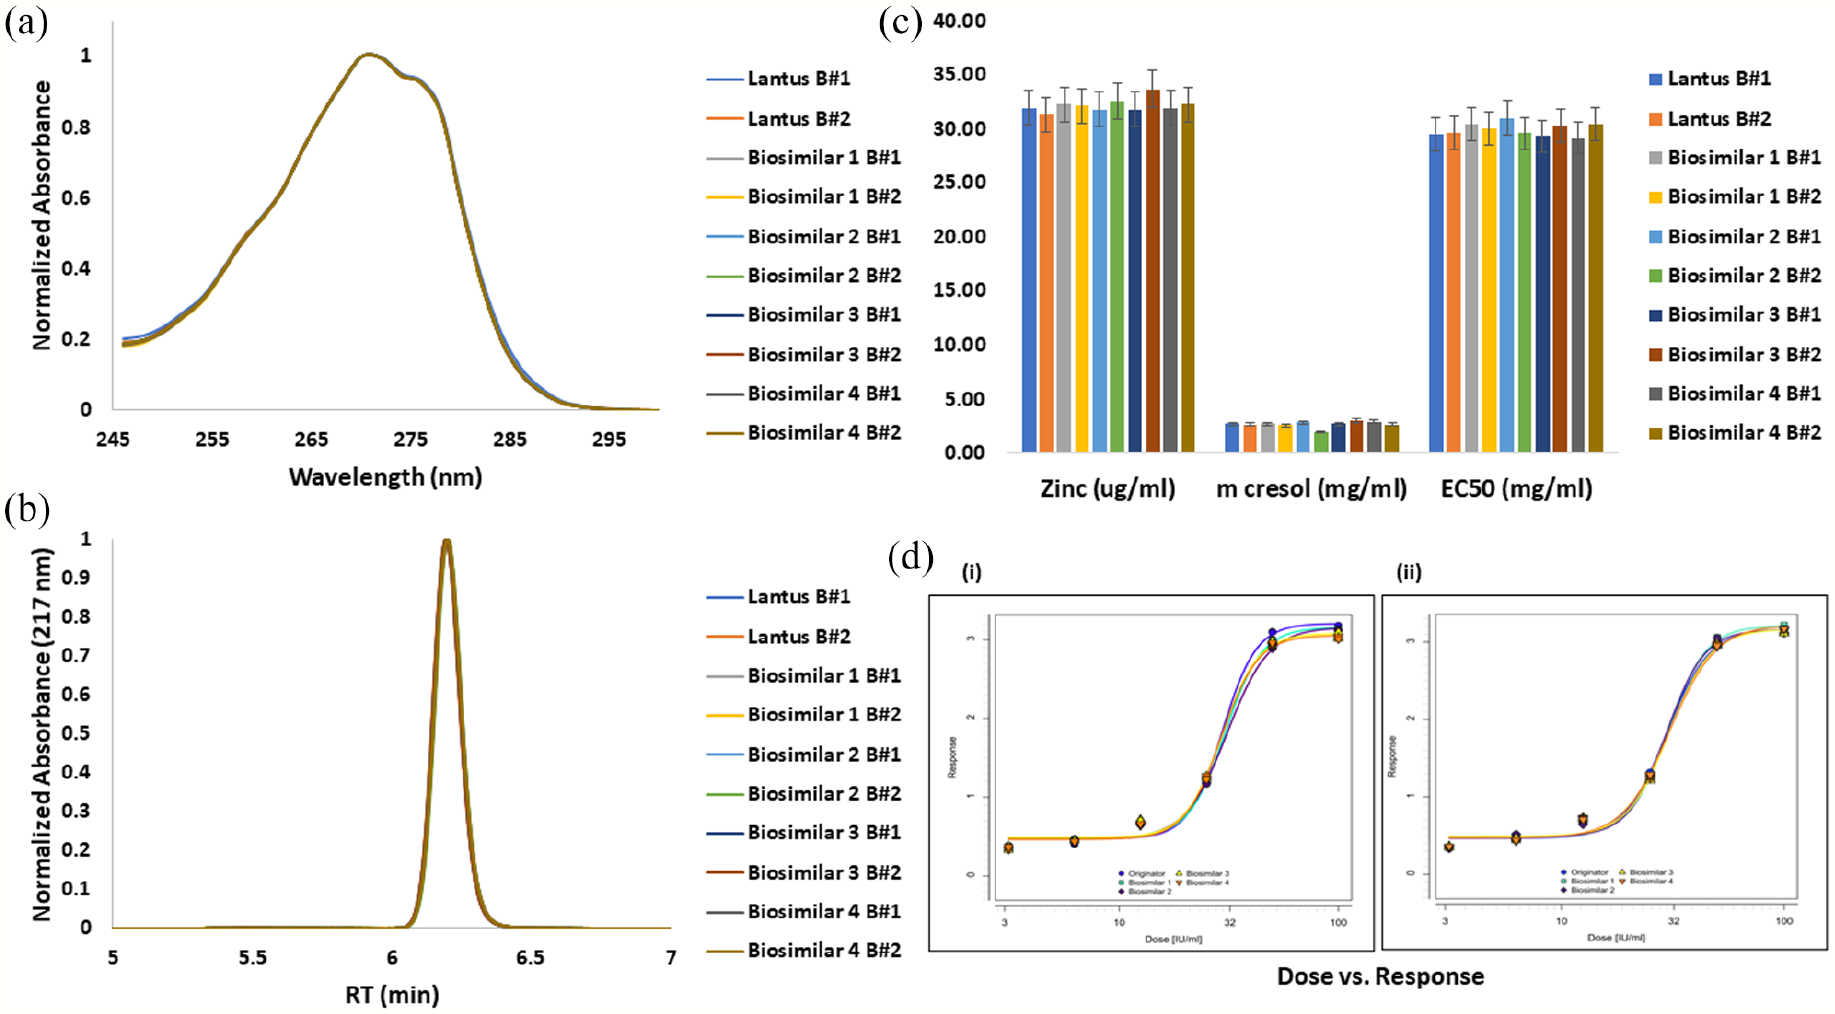
Excipient estimation and glucose uptake assay of insulin glargine. (a) UV spectra, (b) Reverse phase chromatogram for m-cresol estimation, (c) Bar graph for zinc/ m-cresol/ glucose uptake rate estimation by atomic absorption spectroscopy/RP-HPLC/ bioassay, respectively, (d) Concentration-response curve determined by colorimetric glucose uptake assay using 4-parameter logistic regression model fit comparing insulin glargine innovator and biosimilars for batches 1 (i) and 2 (ii). Abbreviations: UV, ultraviolet; RP-HPLC, reverse phase–high-performance liquid chromatography; RT, retention time; EC50, half maximal effective concentration.
Excipient Estimation
M-cresol, a preservative present in insulin glargine and other pharmaceutical formulations, is used as a preservative (bactericidal). In rats, oral LD50 of m-cresol (undiluted) was reported to be 242 mg/kg by weight. 26 Delayed hypersensitivity reactions (DHRs) caused by m-cresol have been reported in commercial formulation of insulin. 27 M-cresol was quantified by RP-HPLC and is seen as a peak eluting at 6.2 minutes (Figure 6b). The calibration curve was constructed by plotting the total peak area versus concentration and showed excellent linearity with the value of the coefficient of determination (R2= 0.97). Upon integration and relative quantification with respect to the total peak area, amount of m-cresol was calculated as 2.73 mg/mL and 2.66 mg/mL for Lantus® batches 1 and 2, respectively. Maximum deviation of biosimilars from Lantus® across batches was observed for Biosimilar 2 (0.55 mg/mL) and Biosimilar 3 (0.36 mg/mL; Table S9 in ESM 2).
Validated flame AAS method was used for the quantification of zinc (Zn) in insulin glargine formulation where 0.1% Triton X-100 was used as a neutral dispersant to overcome any residual viscosity that could affect the nebulization efficiency. Zn acts as a stabilizing agent maintain the hexamer structure of insulin glargine. Similar to m-cresol, Zn residues were also found to cause DHRs in humans. 26 The calibration curve was constructed by plotting absorbance versus concentration and showed excellent linearity with the value of the coefficient of determination (R2 = 0.98). The amount of Zn2+ was calculated as 32 µg/mL and 31.4 µg/mL for Lantus® batches 1 and 2, respectively, represented in the form of bar graph (Figure 6c). Maximum deviation of biosimilars from Lantus® across batches was observed for Biosimilar 3 (2.35 µg/mL; Table S9 in ESM 2). Results obtained for both Zn2+m-cresol were found in agreement with the concentration depicted on the product label. 10
Glucose Uptake Assay
Insulin glargine binds to insulin receptors (IR), required for the regulation of glucose and lipid acting primarily on the liver, skeletal muscle, and adipose tissue. The IR is a tyrosine kinase receptor which has 2 extracellular alpha domains and 2 intracellular catalytic beta domains. 28 Glucose-uptake assay was performed to assess glucose uptake rate by HepG-2 cells in presence of the drug under investigation. Glucose uptake was measured using the glucose analog, 2-deoxyglucose (2-DG), which was taken up by HepG-2 cells and phosphorylated by hexokinase to 2-deoxy-D-glucose-6-phosphate (2-DG6P). Furthermore, 2-DG6P was oxidized and produced nicotinamide adenine dinucleotide phosphate (NADPH) which was utilized by glutathione reductase and produced glutathione. 29 The glutathione eventually resulted in conversion of TNB from DTNB, which was detected by measuring the absorbance at 412 nm. 30 Dose-response curves were generated (Figure 6d), and glucose-uptake rate was calculated from EC50 values through simultaneous regression using Quantitative Response Assay of PLA 3.0. The EC50 values were found as 29.54 mg/mL and 29.67 mg/mL for Lantus® batches 1 and 2, respectively. There was little or negligible difference between the biosimilars across both the batches (Table S9 in ESM 2).
Statistics for Biosimilarity
Euclidean distance method helped deduce biosimilarity by calculating element wise distance between 2 samples i.e., innovator and a biosimilar. Minimum Euclidean distance from Lantus® was observed for Biosimilar 2 (3.85), followed by Biosimilar 4 (4.37), Biosimilar 1 (5.88), and Biosimilar 3 (6.61). The result was further validated by Wilcoxon signed rank test method (Table S10 in ESM 2).
Discussion
To date, only a few biosimilarity studies have been reported for insulin glargine biosimilars in public domain. To our knowledge, this is the first study presenting the structural and functional data on biosimilarity of insulin glargine biosimilars present in Indian market with respect to Lantus®. Typically multiple, orthogonal analytical tools are required for establishing analytical similarity of a biotherapeutic product. 31 Like our previously published studies on the analytical similarity of filgrastim, trastuzumab, and rituximab biosimilars in the Indian market,1,32 -34 we observed that the insulin glargine biosimilars were similar to Lantus® with respect to primary structure (intact mass, reduced mass, peptide mapping, and disulfide bridging)], higher-order structure, product-related variants, excipient (Zn2+ and m-cresol) content and bioactivity. However, minor variations existed with respect to few product-related variants and the overall stability. The current similarity exercise included analytical tools for all CQAs of active substance, product-related variants as well as in vitro assays recommended in the USP monograph for insulin glargine. 35 Profiles of mass spectrometry, chromatographic, spectroscopic analysis for Lantus® batch 1 are available in ESM 2 (Figures S1, S2, S3, S4, and S5).
The results generated in this study are in alignment with previously published studies with respect to intact mass, reduced peptide mass fingerprinting, Far UV CD spectra, monomer content (for SE-HPLC method given in USP monograph), 4 protein content, 36 Zn2+, 37 and m-cresol 38 estimation. Excipient plays an important role in commercial formulations, but their excessive concentration can be undesirable. M-cresol aided reaction at injection site after administration of human insulin has been reported, and it has shown local cutaneous hypersensitivity. 27 Aggregation causes misfolding and stimulates immune responses, hence aggregates need to be accurately quantified and be present as per product specification. 29 It was worth noting that HMW varied from 0% (for most DPs) to 0.81% for Biosimilar 4 (Table S6 in ESM 2). With respect to other product-related variants, deamidation is proven to have a significant impact on aggregation 39 and presence of deamidation at position B4 in Biosimilar 4 might be the reason for the observed enhanced aggregate formation (Table S3 in ESM 2). Hence, this was further undertaken through an accelerated stability study, where the DPs showed very slow aggregation rate for 14 days with maximum aggregation propensity observed for Biosimilar 4 as compared with other DPs. Biosimilar 4 had the age nearer to its expiry at the time of analysis and so age of the sample might be playing a critical role in determining product stability (Table S7 in ESM 2).
Three DPs (Biosimilar 1, Biosimilar 2 and Biosimilar 4) appeared to have relatively higher reduced/ oxidized variants with respect to Lantus®. In addition, Biosimilar 2 observed oxidized peak (0.13% vs. 0% in Lantus®). Given that these results were consistent when conducted in triplicates, they were unlikely to be an artifact. However, the identification of these variants via MS analysis would shed more light on their identity (Table S6 in ESM 2). Also, the effect of reduced/ oxidized variant did not translate to bioactivity, probably because the difference was not significant enough (0.16% for Biosimilar 1 to 0.45% for Biosimilar 4 vs. 0% in Lantus®; Table S6 in ESM 2).
In conclusion, the current similarity exercise was conducted successfully to map the similarities and highlight the differences in insulin glargine biosimilars approved in the Indian market with respect to Lantus®. Using Euclidean distance, the order of biosimilarity was Lantus®>Biosimilar 2>Biosimilar 4>Biosimilar 1>Biosimilar 3.
Supplemental Material
sj-docx-1-dst-10.1177_19322968211058482 – Supplemental material for Assessing the Structural and Functional Similarity of Insulin Glargine Biosimilars
Supplemental material, sj-docx-1-dst-10.1177_19322968211058482 for Assessing the Structural and Functional Similarity of Insulin Glargine Biosimilars by Gayatri Vishwakarma, Neh Nupur and Anurag S. Rathore in Journal of Diabetes Science and Technology
Supplemental Material
sj-docx-2-dst-10.1177_19322968211058482 – Supplemental material for Assessing the Structural and Functional Similarity of Insulin Glargine Biosimilars
Supplemental material, sj-docx-2-dst-10.1177_19322968211058482 for Assessing the Structural and Functional Similarity of Insulin Glargine Biosimilars by Gayatri Vishwakarma, Neh Nupur and Anurag S. Rathore in Journal of Diabetes Science and Technology
Footnotes
Acknowledgements
This work was funded by the Center of Excellence for Biopharmaceutical Technology grant under Department of Biotechnology, Government of India (BT/COE/34/SP15097/2015). The authors would also like to thank Agilent Technologies India Private Limited for funding this research as part of its corporate social responsibility initiative.
Abbreviations
°C, degree Celsius; µg, microgram; µl, microliter; μm, micrometer; 2-DG, 2-deoxyglucose; 2-DG6P, 2-deoxy-D-glucose-6-phosphate; Å, Angstrom; AAS, atomic absorption spectroscopy; ACN, acetonitrile; Arg, arginine; Asn, asparagine; Asp, asparagine; ATR, attenuated total reflectance; AU, absorbance units; CD, circular dichroism; cm, centimeter; CQAs, critical quality attributes; Cys, cysteine; D2, deuterium; Da, Dalton; DAD, diode array detector; DHRs, delayed hypersensitivity reactions; DMEM, Dulbecco’s modified Eagle’s medium; DNA, deoxyribonucleic acid; DP, drug product; DTNB, 5,5’-dithio-bis-(2-nitrobenzoic acid); DTT, dithiothreitol; EC50, half maximal effective concentration; EDTA, ethylenediaminetetraacetic acid; EMA, European Medicines Agency; EP, European Pharmacopeia; ESM, electronic ![]() ; FA, formic acid; FBS, fetal bovine serum; FLR, fluorescence spectroscopy; FTIR, Fourier transform infrared spectroscopy; Gln, glutamine; Gly, glycine; Gn-HCl, guanidine hydrochloride; His, histidine; HMWs, high molecular weight species; IAM, iodoacetamide; IR, insulin receptor; IU, international units; KRPH, Krebs-Ringer-Phosphate-HEPES; LC-ESI-TOF-MS, Liquid chromatography-Electrospray ionization-Time-of-Flight-Mass Spectroscopy; LD50, median lethal dose; Lys, lysine; m/z, mass/charge; MaxEnt, maximum entropy; MFE, molecular feature extraction; mg, milligram; mL, milliliter; mm, millimeter; mM, millimolar; MRE, mean residue ellipticity; NADPH, nicotinamide adenine dinucleotide phosphate; nm, nanometer; Phe, phenylalanine; pI, Isoelectric point; ppm, parts per million; Pro, Proline; PTMs, post translational modifications; pyroGlu, pyroglutamate, RMSE, root mean square error; RP-HPLC, reverse phase–high-performance liquid chromatography; RS, related substances; SE-HPLC, size exclusion–high-performance liquid chromatography; SPE, solid phase extraction; ThT, Thioflavin T; TIC, total ion chromatogram; TNB, tri-nitro-benzene; Tyr, tyrosine; USFDA, United States Food and Drug Administration; USP, United States Pharmacopeia; UV-Vis, ultraviolet-visible; V, voltage; Val, valine; Vcap, capillary gas temperature/voltage; Vfrag, fragmentor voltage; Zn, zinc; α, alpha.
; FA, formic acid; FBS, fetal bovine serum; FLR, fluorescence spectroscopy; FTIR, Fourier transform infrared spectroscopy; Gln, glutamine; Gly, glycine; Gn-HCl, guanidine hydrochloride; His, histidine; HMWs, high molecular weight species; IAM, iodoacetamide; IR, insulin receptor; IU, international units; KRPH, Krebs-Ringer-Phosphate-HEPES; LC-ESI-TOF-MS, Liquid chromatography-Electrospray ionization-Time-of-Flight-Mass Spectroscopy; LD50, median lethal dose; Lys, lysine; m/z, mass/charge; MaxEnt, maximum entropy; MFE, molecular feature extraction; mg, milligram; mL, milliliter; mm, millimeter; mM, millimolar; MRE, mean residue ellipticity; NADPH, nicotinamide adenine dinucleotide phosphate; nm, nanometer; Phe, phenylalanine; pI, Isoelectric point; ppm, parts per million; Pro, Proline; PTMs, post translational modifications; pyroGlu, pyroglutamate, RMSE, root mean square error; RP-HPLC, reverse phase–high-performance liquid chromatography; RS, related substances; SE-HPLC, size exclusion–high-performance liquid chromatography; SPE, solid phase extraction; ThT, Thioflavin T; TIC, total ion chromatogram; TNB, tri-nitro-benzene; Tyr, tyrosine; USFDA, United States Food and Drug Administration; USP, United States Pharmacopeia; UV-Vis, ultraviolet-visible; V, voltage; Val, valine; Vcap, capillary gas temperature/voltage; Vfrag, fragmentor voltage; Zn, zinc; α, alpha.
Author Contributions
Gayatri Vishwakarma: Methodology, investigation, formal analysis, writing-original draft. Neh Nupur: Methodology, investigation, formal analysis, writing-original draft. Anurag S. Rathore: Conceptualization, supervision, project administration, writing-review & editing, funding acquisition & resources.
Declaration of Conflicting Interests
The author(s) declared no potential conflicts of interest with respect to the research, authorship, and/or publication of this article.
Funding
The author(s) disclosed receipt of the following financial support for the research, authorship, and/or publication of this article: This work was funded by the Center of Excellence for Biopharmaceutical Technology grant under Department of Biotechnology, Government of India (BT/COE/34/SP15097/2015).
Supplemental Material
Supplemental materials for this article is available online.
References
Supplementary Material
Please find the following supplemental material available below.
For Open Access articles published under a Creative Commons License, all supplemental material carries the same license as the article it is associated with.
For non-Open Access articles published, all supplemental material carries a non-exclusive license, and permission requests for re-use of supplemental material or any part of supplemental material shall be sent directly to the copyright owner as specified in the copyright notice associated with the article.