
Abstract
Background:
For new insulin analogs with properties that vary from human insulin, defining activity in units of human insulin based on glycemic lowering efficacy may be challenging. Here we present a new method that can be used to quantify a unit dose of an experimental insulin when the traditional euglycemic clamp method is not adequate.
Methods:
Joint modeling of insulin dose and the glycemic outcome variable hemoglobin A1c (HbA1c), where both were response variables, was used to evaluate insulin unit potency for basal insulin peglispro (BIL). The data were from the Phase 3 program for BIL, which included greater than 5500 patients with type 1 or type 2 diabetes who were treated for 26 or 52 weeks with BIL or a comparator insulin. Both basal-bolus and basal insulin only studies were included, and some type 2 diabetes patients were insulin-naïve.
Results:
The analysis showed that 1 unit of BIL, composed of 9 nmol of active ingredient, had similar or slightly greater potency compared to 1 unit insulin glargine or NPH insulin for all populations.
Conclusions:
Despite some limitations, the joint modeling of HbA1c and insulin dose provides a reasonable approach to estimate the relative potency of a new basal insulin versus an established basal insulin.
Insulin therapy is the only treatment option for patients with type 1 diabetes (T1D), and an important treatment option for patients with type 2 diabetes (T2D). A variety of human and analog insulin formulations are available, which allows the individualization of insulin therapy. However, approximately 50% of patients with T2D treated with insulin are still not achieving the American Diabetes Association (ADA) recommended HbA1c target of <7.0%. 1 Intensification of insulin therapy is often accompanied by weight gain and the risk of hypoglycemia. 2 Therefore, the development of new insulin analogs continues.
For new insulin analogs with properties that may vary from human insulin, it is critical to define their activity in terms of units of human insulin, which is the current standard of insulin dosing for patients and health care providers. The World Health Organization currently defines one unit of human insulin (EP/US/IU) as 0.0347 mg of “insulin human.” 3 The standard prior to the 1980’s was a bio-identity test (Rabbit Blood Glucose Test), 4 which the US Food and Drug Administration has maintained as a guidance. A unit of an insulin analog should be biologically equivalent to a unit of human insulin. The molar amount of one unit of an insulin analog is ultimately determined as the dose amount providing equivalent glycemic control to a suitable comparator. In early phase insulin development, preclinical data and the euglycemic insulin clamp procedure in humans have been used to estimate the glycemic lowering efficacy of insulin analogs under development. Clinical trials are later used to confirm those preliminary observations. All available insulin analogs have a U-100 formulation of 600 nmol/mL (6 nmol per unit), with the exception of insulin detemir, which is formulated as 2400 nmol/mL (24 nmol per unit). 5
The duration of action of insulin analogs is varied by design. Short- or rapid-acting insulin analogs are used to replace or supplement the bolus of endogenous insulin secreted in response to a meal. Short- or rapid-acting insulin analogs have amino acid sequences which have been altered from human insulin; these changes increase the dissociation rate of insulin hexamers (which provide formulation stability to increase shelf life) to increase the rate of absorption from the subcutaneous compartment into the circulation. 6 Long-acting insulin formulations or analogs are used to replace or supplement endogenous insulin secretion during the fasting or basal state; prolongation of action is achieved primarily by delaying absorption from the subcutaneous compartment. The mechanisms used to delay absorption include stabilization of the hexamer by protamine or zinc, pH-induced micro-precipitation of insulin crystals, micro-fibril formation, increasing formulation concentration, and increasing molecular weight.
Insulin detemir and insulin degludec bind to albumin, resulting in a circulating reservoir of these insulins; this is additive to the prolongation of absorption in increasing duration of action. 7 Last, reducing insulin clearance may also prolong the duration of action. As insulin is cleared mainly via lysosomal degradation following its interaction with its receptor, and to a lesser extent via renal excretion, reducing binding affinity of the insulin analog to the insulin receptor or reducing its glomerular filtration may also prolong its duration.
A reduction in receptor binding affinity, which would reduce the activity of an insulin analog, can be compensated by an increase in circulating concentration. Both detemir and degludec circulate in concentrations much higher than human insulin, which is a reflection of both the albumin-binding property and the reduced receptor binding affinity. Increasing the molar dose of detemir four-fold achieves activity comparable to human insulin. Degludec has other properties, such as a significantly increased half-life (~25 hours), that may compensate for its reduced binding affinity (12-13% of that of human insulin), allowing it to be dosed with a molar concentration similar to that of other insulins (6 nmol/U). 7
Insulin analogs with long half-lives and therapeutic accumulation require steady-state assessment using euglycemic clamps to assess pharmacodynamics. A single dose study will not properly characterize the therapeutic effect of these insulins. Therefore, insulin degludec must be dosed for >5 days (5 × half-life) prior to an assessment at steady state. 8 Pharmacokinetic assessment is preferable to pharmacodynamic assessment for determining onset and half-life, as euglycemic clamps are limited in duration of observation. Since euglycemic clamps are typically performed with a predetermined fixed insulin dose (eg, 0.4 U/kg) to all participating subjects, this dose would have to be administered for 5 half-lives to achieve steady state. 9 This dose may not be therapeutically appropriate for all participants with diabetes and detrimental for participants without diabetes.
Basal insulin peglispro (BIL) is an insulin analog with a half-life of 2-3 days, delayed absorption and reduced clearance, and with intravenous administration has a reduced volume of distribution (~5 L) compared with insulin glargine.10,11 This volume of distribution is suggestive of the restrictive transport of BIL into the periphery and its hepato-preferential action. For similar activity in suppressing endogenous glucose production, BIL had less activity in stimulating peripheral glucose uptake compared with insulin glargine.12-14 Binding affinity to the receptor, volume of distribution, and half-life must be similar to human insulin to use a molar analogy for establishing a unit definition, and BIL shares none of these features with human insulin. 15 Insulin clamps assess glucose disposal and endogenous glucose production indirectly by the glucose infusion rate. The presumption is that the dose of insulin administered during the clamp is high enough to fully suppress glucose production and therefore glucose infusion rate is equal to the glucose disposal rate and is used to characterize the pharmacodynamics of the experimental insulin.
A basal insulin is not expected to fully suppress endogenous glucose production and glucose uptake is expected to be low. In normal physiology, euglycemia is achieved with net glucose production balanced by net glucose uptake. If the basal insulin were optimized for an individual patient with diabetes, euglycemia would be achieved with a zero glucose infusion rate (endogenous glucose production is equal to glucose uptake), and the glucose infusion rate could not characterize the pharmacodynamics of the basal insulin. Therefore, the clamp technique is very dependent on the basal insulin’s action on glucose uptake. 16 For the hepato-preferential BIL, with less peripheral glucose uptake (ie, lower glucose infusion rate) compared to insulin glargine, the clamp method would underestimate the potency because the full effect of BIL on endogenous glucose production could not be assessed. In a Phase 2 clamp substudy, the total amount of glucose infused with BIL was lower compared to glargine. 17 The molar ratio of BIL to glargine based on glucose infused was therefore overestimated by the clamp technique 17 when compared to clinical data. 18
An alternative approach for quantifying the unit definition of a new basal insulin analog is to use a glycemic outcome measure from a clinical trial where the new insulin is compared to a commercially available insulin. If the outcome measures of glycemic control at the study endpoint have similar mean values in both treatment groups, the unit of the new basal insulin can be defined by equating the final basal insulin dose between the two treatment groups. However, the glycemic outcome measures might have different mean values, due to the different properties of the basal insulins being tested. Therefore, adjusting for glycemic control is important in establishing the unit definition.
Adjusting for differences in glycemic control may be accomplished with regression of a glycemic outcome (eg, HbA1c) on the insulin dose; then the relationships of HbA1c with insulin dose can be compared between the new insulin and the comparator insulin. However, since in treat-to-target studies insulins are titrated according to the glucose response, the insulin dose is also an important secondary outcome. This is fundamentally different from a dose response study where preselected doses are randomly assigned and fixed throughout the study, and hence are not impacted by the glycemic response. Therefore, analysis based on regression of insulin dose on glycemic control variables may provide confounding results in treat-to-target studies.
Here a new statistical method is presented based on joint modeling of insulin dose and HbA1c, where both are modeled as response variables for evaluating insulin unit potency. Relative insulin unit potency could be expressed on a molar basis or a unit basis. This method was employed to evaluate the potency of BIL versus comparator insulins on a unit basis using results from the Phase 3 studies. Prior to the Phase 3 studies, the unit for BIL was determined based on final mean basal insulin dose in Phase 2 studies with insulin glargine as comparator, adjusting for the mean glycemic response.18,19 This article will provide more complete results including the statistical methods, as well as results from the overall BIL Phase 3 program (which included studies in several cohorts of patients with T1D or T2D). These methods could be used for future basal insulin development.
Methods
Study Population
Data from 6 Phase 3 studies comparing BIL with insulin glargine or NPH insulin were used in the analyses. Table 1 provides a brief summary of study features. The details for the study design, demographics, and efficacy and safety were previously published.20-25 All of the studies in the analysis were conducted in accordance with the International Conference on Harmonization Guidelines for Good Clinical Practice and the Declaration of Helsinki. All patients signed an informed consent document, and the protocols and consent documents were approved by local ethical review boards prior to study initiation. The studies were registered at clinicaltrials.gov as follows: NCT01435616, NCT01468987, NCT01481779, NCT01454284, NCT01582451, NCT01790438.
Key Features of Phase 3 Active-Comparator Studies for BIL.
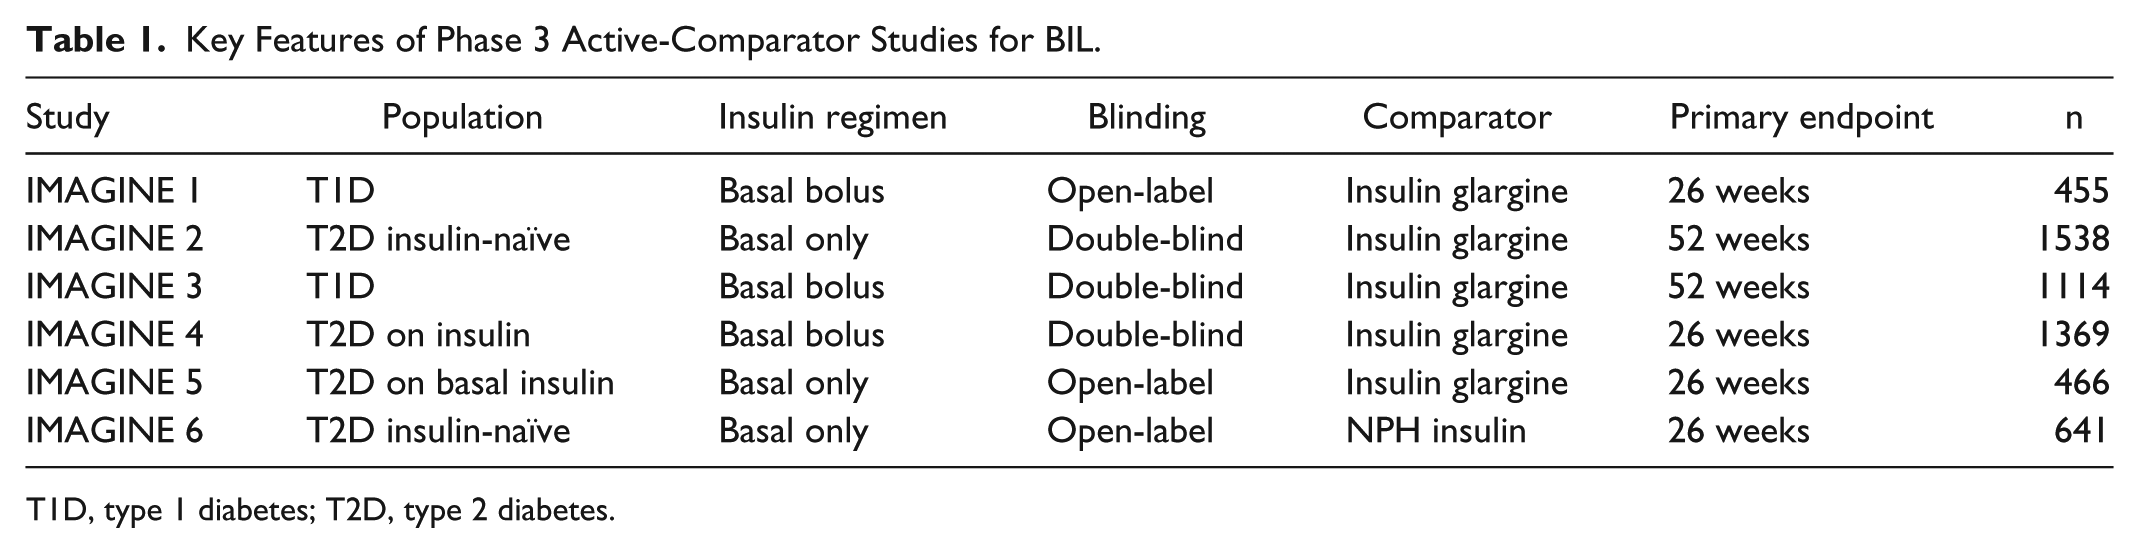
T1D, type 1 diabetes; T2D, type 2 diabetes.
The unit definition for BIL used in the Phase 3 studies was estimated based on final mean basal insulin dose adjusting for the mean glycemic response through a bivariate normal distribution in two Phase 2 studies: a study in T2D patients previously treated with basal insulin and then randomized to either BIL or insulin glargine, 19 and a study in T1D patients, without adjusting for the difference in mean bolus dose. 18 Based on this analysis, 1 unit dose was defined to have 9 nmoles of BIL (U-100 = 900 nmol/mL).
Statistical Methods
The assumption was made that the relationship between the change in HbA1c and the change in insulin dose (from baseline to primary endpoint) is linear. Linearity is a reasonable assumption in clinical trials due to a relatively narrow range of change in HbA1c and change in basal insulin doses from baseline to endpoint.
In randomized clinical studies, the baseline theoretic mean for a given variable is the same for both treatment groups. The following notations are introduced:
Let
Let
Let
All of the above variables (as applicable) are assumed to be from a multivariate normal distribution; a joint linear model was used and the mean responses and the corresponding covariance matrix were estimated. The constrained longitudinal data analysis method was used to model both baseline and endpoint outcomes as response variables and constrain the baseline means to be the same across treatment groups. 26
Insulin potency is defined as the reduction in % HbA1c per 10 U dose of insulin or per 1 U/kg of insulin. Let
Next, the formulae for calculation of
Studies with patients who were insulin-naïve prior to study entry and treated with basal insulin only
Studies with patients who were previously treated with basal insulin and then switched to an experimental basal insulin or a comparator basal insulin without bolus insulin treatment (basal switch study)
Studies where basal-bolus therapies were used
Insulin-Naïve Patients Treated With Basal Insulin Only
For insulin-naïve patients, the baseline basal insulin dose was 0. The insulin potency was
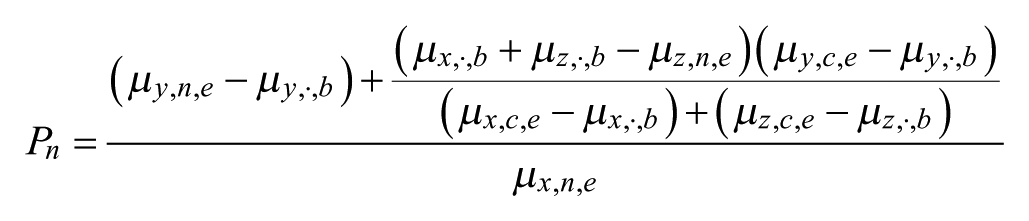
Basal Switch Studies
For patients who took basal insulins prior to the study and were randomized to the experimental insulin, the insulin potency cannot be simply calculated by the change in HbA1c divided by the change in basal insulin dose, since the potencies for the baseline insulin and experimental insulin might be different. It was assumed that all insulins taken at baseline as well as the insulin used in the comparator arm during the study had the same potency. Then, the basal insulin potency should be calculated by (details in the online appendix)

Basal-Bolus Studies
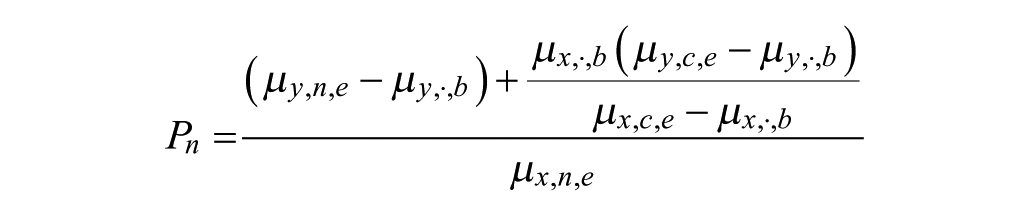
The complexity of basal-bolus treatment is that the basal insulin dose and HbA1c may be impacted by the bolus insulin dose. If the experimental and comparator treatment groups had similar bolus insulin doses at the end of treatment period, the bolus dose can be ignored and the previously described statistical methods for the basal switch studies can be applied. However, for basal-bolus studies, especially those in patients with T1D, BIL-treated patients used a significantly lower total bolus insulin dose versus comparator insulin-treated patients.20,25 Therefore, changes bolus insulin dose had to be taken into consideration in evaluating the basal insulin potency. Since it was not possible to separate the impact of bolus insulin and basal insulin on HbA1c, it was assumed that the comparator basal insulin had the same potency as other existing insulins used at baseline and bolus insulins used during the study. This assumption is based on the facts that (1) the unit activity of the previous basal insulin was determined by comparison to a marketed insulin; and (2) basal insulin glargine and bolus insulin lispro treatments resulted in similar HbA1c levels and similar insulin doses. 28
The basal insulin potency can be calculated as (details in the online appendix)

Statistical Analyses
Statistical analyses were performed using SAS (Version 9.2, Cary, NC). The joint modelling was implemented by the MIXED procedure. The SAS IML procedure was used to calculate the absolute and relative differences in insulin potency between treatment arms, together with 95% confidence intervals and P values.
Results
A summary of baseline and change from baseline to primary endpoint for HbA1c, basal insulin dose, and bolus insulin dose for all studies are provided in Table 2. Across the six studies, treatment with BIL compared to insulin glargine or NPH consistently resulted in significantly reduced HbA1c, and higher basal insulin dose at endpoint.20-25 For T1D studies, the bolus insulin dose was also significantly lower with BIL versus insulin glargine, and the total insulin dose in the BIL treatment arm was similar to or lower than in the insulin glargine treatment arm.20,25
Summary of HbA1c and Insulin Dose for Phase 3 BIL Studies.
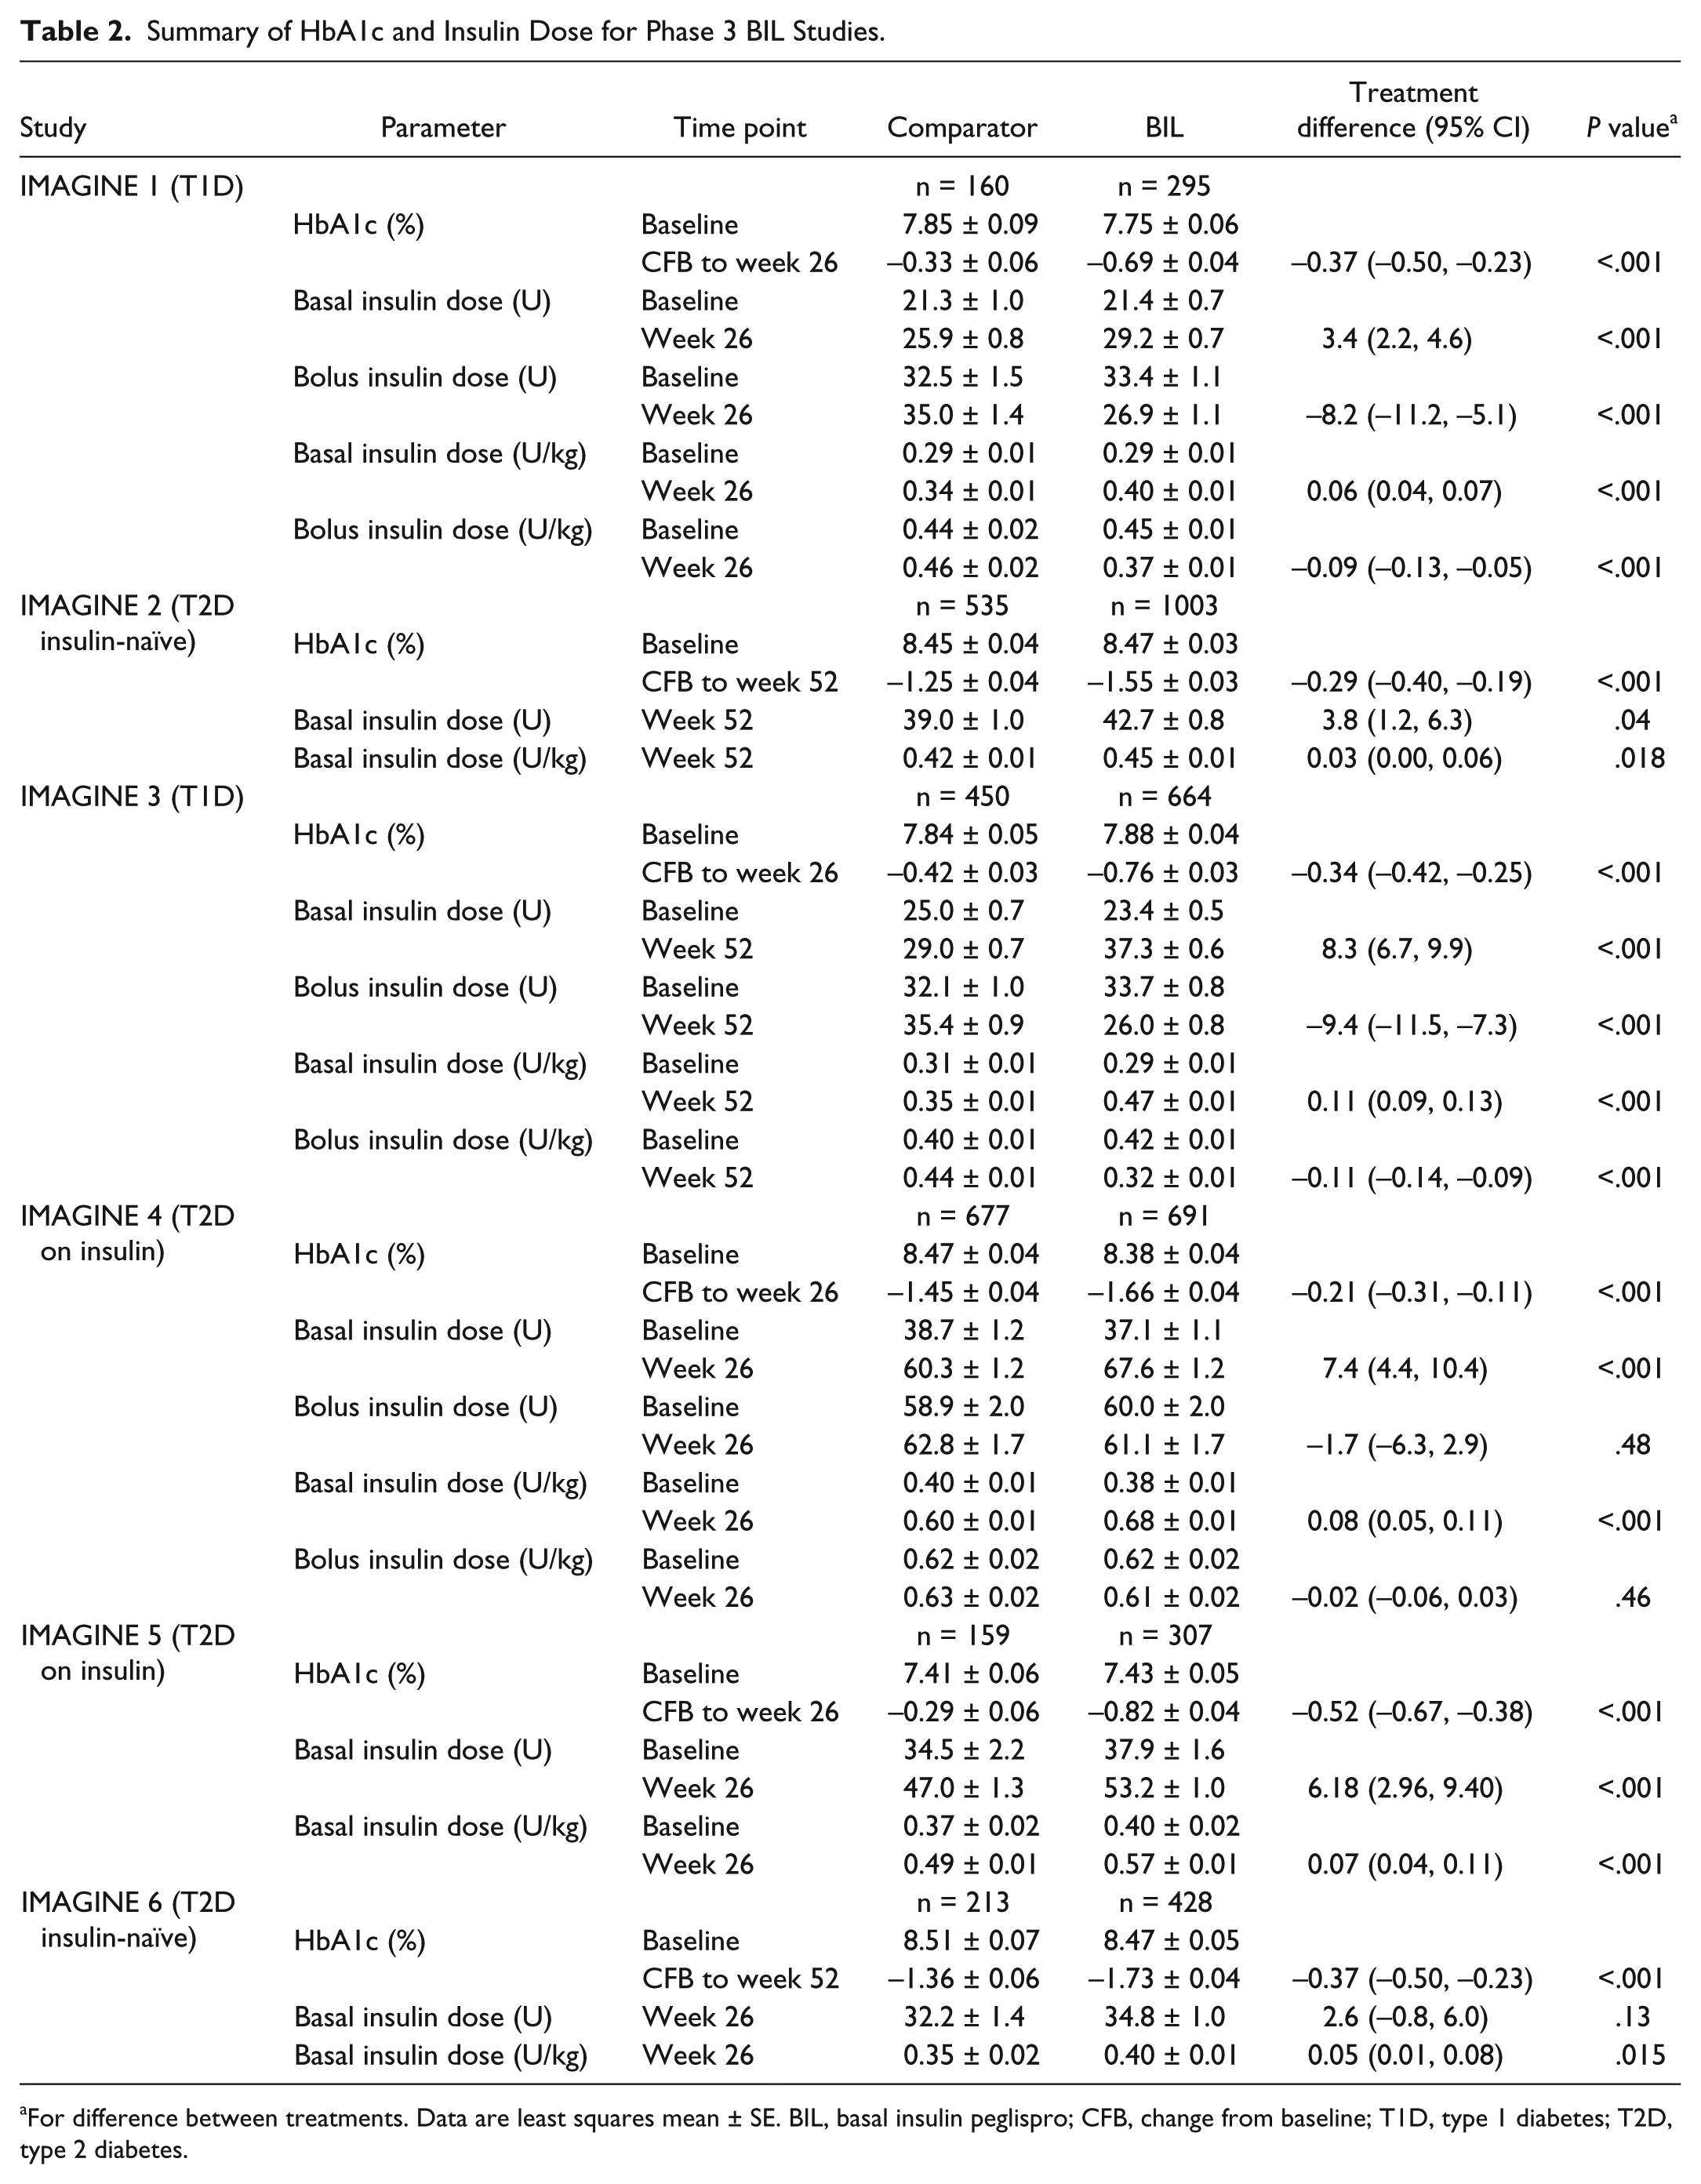
For difference between treatments. Data are least squares mean ± SE. BIL, basal insulin peglispro; CFB, change from baseline; T1D, type 1 diabetes; T2D, type 2 diabetes.
The results for the insulin potency in terms of HbA1c reduction per 10 U of insulin, or HbA1c reduction per U/kg of insulin, are given in Table 3. It shows BIL had slightly higher potency compared to insulin glargine or NPH for all studies except IMAGINE 4, where BIL and glargine had similar potency. It appears that the relative potency for BIL versus insulin glargine was higher for patients with T1D compared to patients with T2D.
Potency for BIL Relative to Insulin Glargine, NPH.
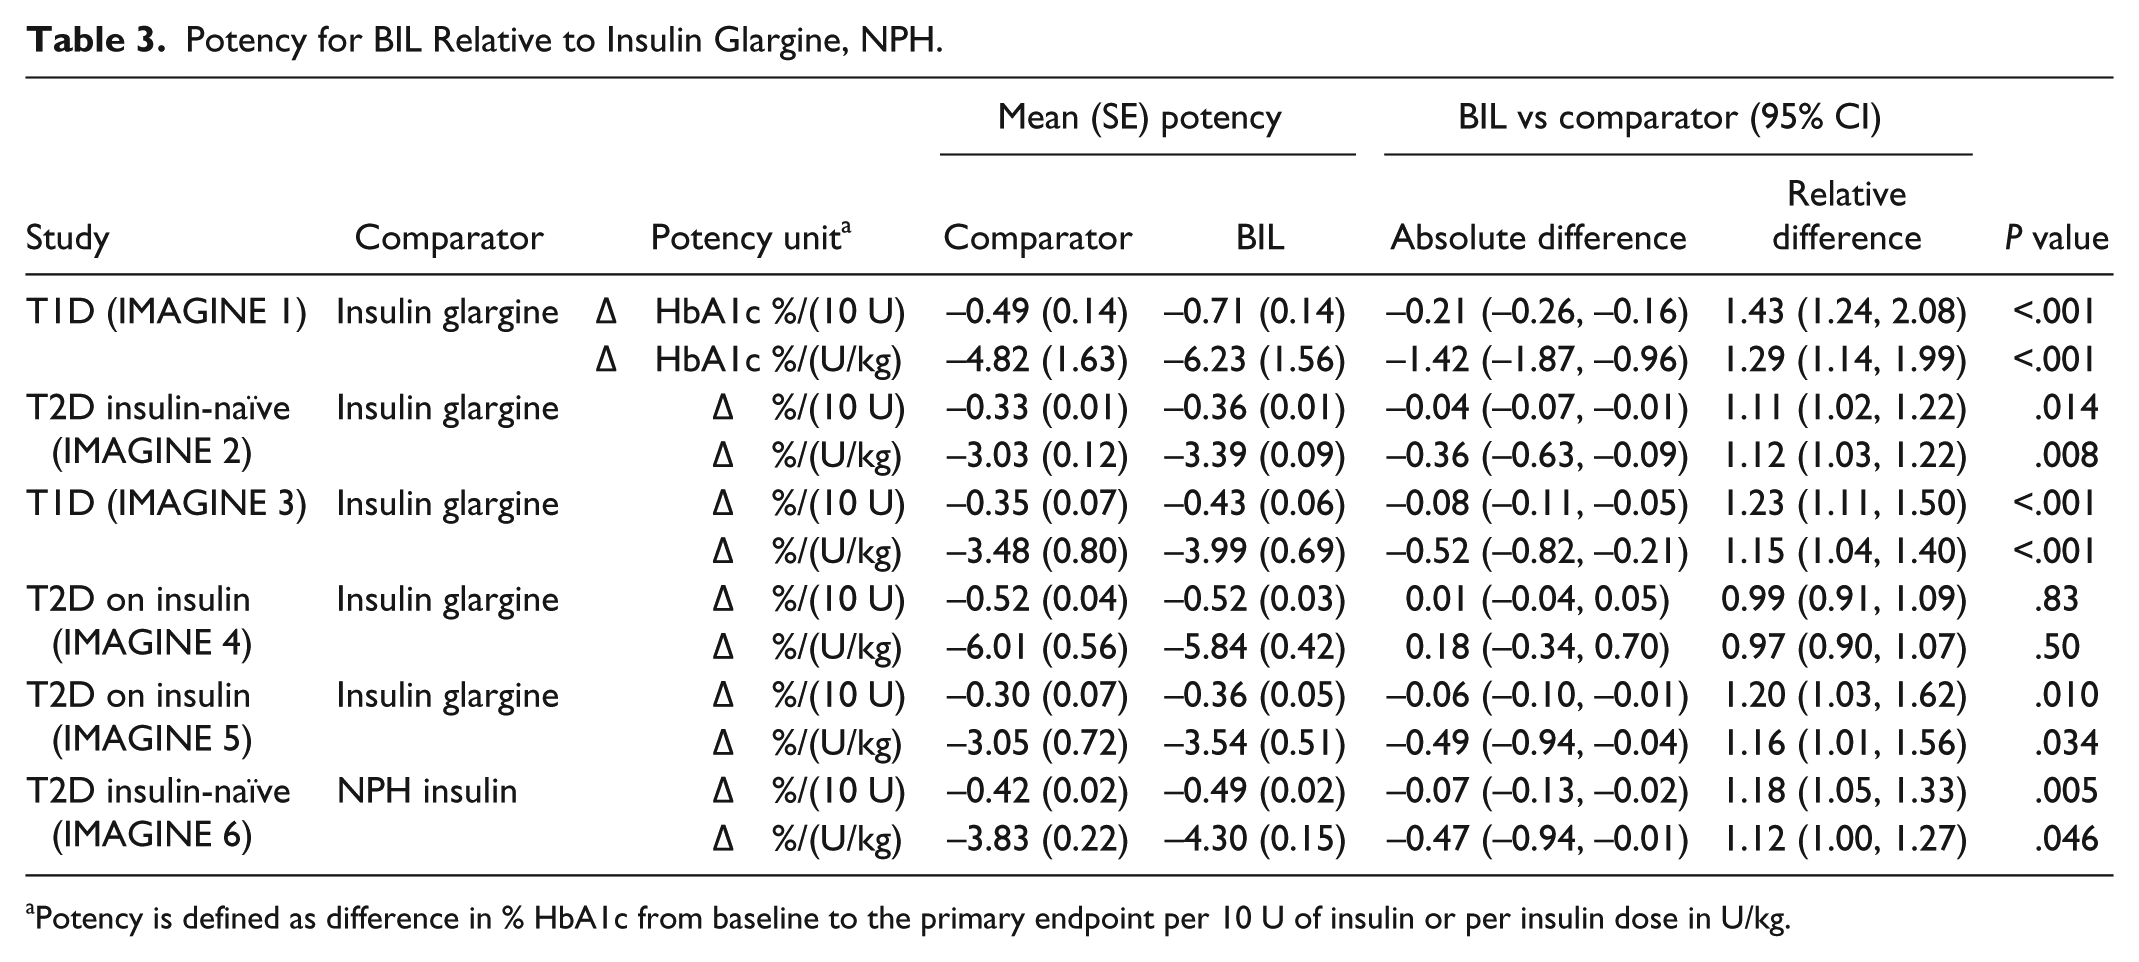
Potency is defined as difference in % HbA1c from baseline to the primary endpoint per 10 U of insulin or per insulin dose in U/kg.
To test our assumption that the potency of the insulin used at baseline was the same as the comparator insulin, the analyses were repeated for the subset of patients from IMAGINE 5 who were on insulin glargine at baseline (n = 334).The results showed that the relative potency for BIL versus insulin glargine was 1.29 (95% CI: 1.05, 2.44) per 10 IU and 1.26 (1.03, 2.36) per IU/kg, similar to the results for all of IMAGINE 5 (Table 3).
Discussion
We have provided a statistical method to evaluate the potency of an experimental long-acting basal insulin, which can be used to determine the amount of active ingredient in a dose that provides the equivalent of one unit of human insulin. Applying the method to BIL Phase 3 studies, we show that with the new unit definition from the Phase 2 studies, BIL had similar or slightly greater potency compared to insulin glargine or NPH insulin on a unit basis for all patient populations. These results confirm that the unit definition for BIL was appropriate and patients could transfer from existing basal insulin to BIL without changing the unit dose.
In the IMAGINE studies, patients treated with BIL were titrated to higher basal insulin doses and lower HbA1c compared to those treated with insulin glargine or NPH, without increasing the risk of nocturnal hypoglycemia. 15 This may have more to do with the mechanism of action of BIL, which results in a flatter and less variable PK/PD profile 29 and lower glucose variability, 15 and less to do with the potency.
Results from the Phase 2 clamp substudy suggested one unit of BIL should have 14.1 nmol of active ingredients to have the same glucose infusion rate as insulin glargine. 17 However, glycemic control data from the same Phase 2 study demonstrated 1 unit of BIL with 9 nmol of active ingredients had approximately equivalent potency compared to 1 unit of insulin glargine. 18 A similar analysis of a Phase 2 study in patients with T2D confirmed this unit definition. 19 Therefore, the euglycemic clamp method, which assessed principally glucose uptake, underestimated the glycemic lowering potency of BIL by ~36%. 17
The original analysis used for analyzing data from the Phase 2 study for T1D patients did not adjust for the difference in bolus insulin use, while the newly proposed method for Phase 3 studies does adjust for the potential difference in bolus insulin use. Notably, in the T1D Phase 2 study, patients who were treated with BIL used approximately 18% less total bolus insulin at the end of the trial compared to insulin glargine-treated patients. 18 Not accounting for the reduction in bolus insulin may explain the slightly higher unit potency compared to glargine observed in the Phase 3 studies with the newly proposed method (Table 3), especially in the T1D studies.
This method may be limited by the assumptions employed. First, for studies in patients previously treated with insulin, we assume a hypothetical HbA1c value if patients were not given insulin, based on a linear relationship between HbA1c and insulin dose. While this assumption may be reasonable for a certain range of HbA1c, it might not be true for very high or low HbA1c. However, when the analyses were repeated, excluding patients outside of the 10th to 90th percentile for baseline HbA1c or baseline insulin doses for each individual study, the results for insulin potency and treatment differences were similar to the results obtained when all data were included. Second, we assume the potencies for all marketed insulins are the same. Third, the physiological differences between T1D and T2D may also impact the estimates of insulin potency, as patients with T2D may have different amounts of endogenous insulin secretion when the glucose and exogenous insulin levels are different.
Conclusions
In summary, despite some limitations, the joint modeling of HbA1c and insulin dose provides a reasonable approach to estimate the relative potency of an experimental basal insulin versus an established basal insulin. The method allows a unit definition for an experimental insulin to be set (nmol of active ingredient per unit) based on Phase 2 study results and then confirmed in Phase 3 studies. Especially in the development of hepato-preferential insulins, the established methods via clamp are not delivering plausible results and therefore new methods like this need to be introduced and validated.
Footnotes
Abbreviations
BIL, basal insulin peglispro; CFB, change from baseline; HbA1c, hemoglobin A1c; T1D, type 1 diabetes; T2D, type 2 diabetes.
Declaration of Conflicting Interests
The author(s) declared the following potential conflicts of interest with respect to the research, authorship, and/or publication of this article: All authors are employees and minor shareholders of Eli Lilly and Company.
Funding
The author(s) disclosed receipt of the following financial support for the research, authorship, and/or publication of this article: This study was funded by Eli Lilly and Company.
Supplemental Material
Supplementary material is available for this article online.
References
Supplementary Material
Please find the following supplemental material available below.
For Open Access articles published under a Creative Commons License, all supplemental material carries the same license as the article it is associated with.
For non-Open Access articles published, all supplemental material carries a non-exclusive license, and permission requests for re-use of supplemental material or any part of supplemental material shall be sent directly to the copyright owner as specified in the copyright notice associated with the article.